Fig. 1.
Geometrical models with color coded activation times resulting from the electrophysiological simulation.
2.2 Electrophysiological Modeling
The ion kinetics at each of the voxels representing atrial myocytes were computed using the formulation by Courtemanche et al [4]. The different ion currents  in this model are described by Hodgkin-Huxley type formulations:

with  being the gating variables describing the open probability,
  being the transmembrane voltage, and
  being the Nernst potential of the ion type carrying
  . The maximum conductivities
  of several ion channels were adjusted as given in Table 1 to account for regional heterogeneities as described before [15]. The conductivities perpendicular to cardiac fiber orientation and the anisotropy factor for propagation along the fibers are also given in Table 1. Excitation propagation was computed with a monodomain reaction-diffusion solver acCELLerate [30]. The finite element method and explicit Euler integration with constant time stepping of 20
  s was used after initialization in a single cell environment for 10 cycles to establish steady state conditions.
 in this model are described by Hodgkin-Huxley type formulations:
(1)
 being the gating variables describing the open probability,
  being the transmembrane voltage, and
  being the Nernst potential of the ion type carrying
  . The maximum conductivities
  of several ion channels were adjusted as given in Table 1 to account for regional heterogeneities as described before [15]. The conductivities perpendicular to cardiac fiber orientation and the anisotropy factor for propagation along the fibers are also given in Table 1. Excitation propagation was computed with a monodomain reaction-diffusion solver acCELLerate [30]. The finite element method and explicit Euler integration with constant time stepping of 20
  s was used after initialization in a single cell environment for 10 cycles to establish steady state conditions.
Table 1.
Relative values  of ion channel conductivities representing regional heterogeneities [15] with respect to the original Courtemanche et al. model of human atrial myocytes [4]. Monodomain conductivity perpendicular to fiber orientation
  and anisotropy factor. Highlighted values differ from normal myocardium.
 of ion channel conductivities representing regional heterogeneities [15] with respect to the original Courtemanche et al. model of human atrial myocytes [4]. Monodomain conductivity perpendicular to fiber orientation
  and anisotropy factor. Highlighted values differ from normal myocardium.
Anatomical structure |  |  |  |  (mS/m) (mS/m) | Anisotropy |
|---|---|---|---|---|---|
RA / LA | 1.0 | 1.0 | 1.0 | 87 | 3.75 |
Crista Terminalis | 1.0 | 1.0 | 1.67 | 87 | 6.56 |
Atrial appendages | 1.0 | 0.68 | 1.06 | 87 | 3.75 |
Atrio-ventricular rings | 1.0 | 1.53 | 0.67 | 87 | 3.75 |
Pectinate muscles | 1.0 | 1.0 | 1.0 | 58 | 10.52 |
Bachmann’s Bundle | 1.0 | 1.0 | 1.0 | 101 | 9.0 |
Inferior isthmus | 1.0 | 1.0 | 1.0 | 75 | 1.0 |
2.3 Forward Calculation of the ECG
The impressed currents stemming from the gradient of the transmembrane voltage  act as the source for the differences of the extracellular potential
  on the body surface that are measured during ECG acquisition:

 represents the intracellular conductivity tensor,
  the extracellular conductivity tensor. To compute the ECG,
  obtained from the electrophysiological simulations was therefore first interpolated onto the tetrahedral torso mesh. A reduced bidomain formulation [14] allowed for the subsequent computation of body surface potentials with a time increment of 1 ms. Tissue conductivities were set as in [14]. Body surface potentials were extracted at the standard 12 lead ECG locations. VCG was computed using the inverse Dower matrix [2].
 act as the source for the differences of the extracellular potential
  on the body surface that are measured during ECG acquisition:
(2)
 represents the intracellular conductivity tensor,
  the extracellular conductivity tensor. To compute the ECG,
  obtained from the electrophysiological simulations was therefore first interpolated onto the tetrahedral torso mesh. A reduced bidomain formulation [14] allowed for the subsequent computation of body surface potentials with a time increment of 1 ms. Tissue conductivities were set as in [14]. Body surface potentials were extracted at the standard 12 lead ECG locations. VCG was computed using the inverse Dower matrix [2].
To evaluate left and right atrial contribution to the P-wave, two separate forward calculations were performed for each set of transmembrane voltages. To obtain only the share of the P-wave caused by the LA,  in the RA was set to 0 mV before solving (2), thus muting the sources originating from the RA. Similarly, the LA was muted to compute the right atrial contribution to the P-wave. As the problem is linear, the principle of superposition holds. Hence, the regular P-wave composed of both left and right atrial sources could be obtained by adding the two separate results.
 in the RA was set to 0 mV before solving (2), thus muting the sources originating from the RA. Similarly, the LA was muted to compute the right atrial contribution to the P-wave. As the problem is linear, the principle of superposition holds. Hence, the regular P-wave composed of both left and right atrial sources could be obtained by adding the two separate results.
3 Results

Fig. 2.
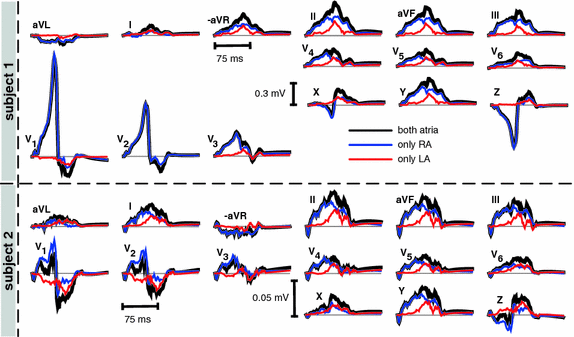
Simulated 12 lead ECG and VCG leads. The blue traces originate from sources in the RA only, the red traces from sources in the LA. The addition of right and left traces yields the normal P-wave generated by both atria (black traces) (Color figure online).

Fig. 3.
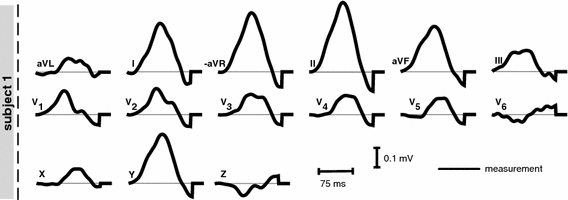
Measured 12 lead ECG for S1. The VCG leads were computed using the inverse Dower matrix [2].
Table 2.
Contribution of the two atria to the P-wave integral of absolute values in lead II during the entire P-wave as well as split by temporal thirds. Values were normalized to the integral value in II for each subject.
 |
Figure 1 shows the activation times resulting from the monodomain simulation. The last voxel was activated at 107 ms after initial stimulation in S1 and after 105 ms in S2. The corresponding ECGs (see Fig. 2) exhibit positive P-waves in leads I, II, and  . Furthermore, P-waves in both subjects were monophasic in II and biphasic in
  and the largest amplitude in the limb leads is found in II as expected. For S1, a measured reference ECG (see Fig. 3) was available and showed overall correspondence with the simulated P-waves. However, the polarity in aVL was positive and X was biphasic in the simulation as opposed to the measurement. The electrical axis of the atria
  was calculated using the P-wave amplitudes in aVF and I:
 . Furthermore, P-waves in both subjects were monophasic in II and biphasic in
  and the largest amplitude in the limb leads is found in II as expected. For S1, a measured reference ECG (see Fig. 3) was available and showed overall correspondence with the simulated P-waves. However, the polarity in aVL was positive and X was biphasic in the simulation as opposed to the measurement. The electrical axis of the atria
  was calculated using the P-wave amplitudes in aVF and I:


