Fig. 1.
(a) Cylindrical fibers (direction of highest stiffness); (b) boundary conditions
The LV model contained 5490 nodes and 4320 first-order hexahedral elements. Physiologically realistic helical fibers from histology were imbedded and interpolated at each nodal location. Fiber angles measured with respect to the short axis plane varied from approximately −60 to +60 degrees transmurally from epicardium to endocardium, respectively. The epicardial basal nodes were fixed and a displacement of 0.2 mm at 60 Hz was prescribed at 41 epicardial nodes at the apex (Fig. 2).
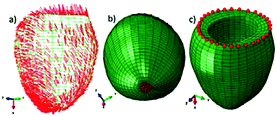
Fig. 2.
(a) LV fibers; (b) apical nodes in red which were displaced 0.2 mm/60 Hz; (c) epicardial basal nodes in red that were fixed (no-displacement) (Color figure online)
A linearly elastic, transversely isotropic material model was used to describe the passive mechanics of the material in the cylindrical and LV models. This is considered to be a good assumption at the small strains induced by MRE. To generate the ground truth for later comparison, the fiber direction (E3) was assigned a Young’s modulus of 60 kPa and the transverse directions (E1, E2) were set to 18 kPa. A Poisson’s ratio of 0.495 was applied as cardiac tissue is largely incompressible and a density of 1.06 g/cm3 was assumed.
In Abaqus, the steady-state response due to harmonic loading is solved using the harmonic equation of motion where  is the complex forcing term,
  is the complex displacement,
  is the mass matrix,
  is the damping matrix and
  is the stiffness matrix. The stiffness matrix is the inverted elasticity matrix, which is a function of the elasticity constants (E1, E2 and E3) and Poisson’s ratios.
is the complex forcing term, is the complex displacement, is the mass matrix, is the damping matrix and is the stiffness matrix. The stiffness matrix is the inverted elasticity matrix, which is a function of the elasticity constants (E1, E2 and E3) and Poisson’s ratios.(1)
Structural damping was applied in order to provide a means of extracting energy from the model as would be expected for biological tissue. Structural damping forces are proportional to forces caused by stressing the structure and oppose the velocity. One common representation of structural damping is as a complex stiffness ( ) involving a real component (
 ) and an imaginary component (
 ); the latter acts as a loss modulus which accounts for damping.
where s is the structural damping coefficient, which relates the real and imaginary components of stiffness to one another. Equation (1) then becomes:
) involving a real component () and an imaginary component (); the latter acts as a loss modulus which accounts for damping.(2)
(3)
2.2 Objective Function
To assess the determinability of the transversely isotropic stiffness parameters from the MRE displacement field, an objective function of the unknown parameters must be defined. Four parameters need to be defined: E 1/2 , E 3 , v 12 , and v 13/23 to describe a transversely isotropic material. A simplification was made where the Poisson’s ratios, which account for the incompressibility of the tissue, were assumed to be the same in the transverse-transverse (1-2, 2-1) and fiber-transverse directions (3-1, 3-2) thereby reducing the number of parameters to three. The Poisson’s ratios in the transverse-fibre directions (1-3, 2-3) are related to the Young’s moduli and the Poisson’s ratios in the fibre-transverse direction according to the following equation:
(4)
In this study we wanted to also identify the damping coefficient ( ) resulting in the following four parameters to be identified: s, E 1 , E 3 and v 12 .
) resulting in the following four parameters to be identified: s, E 1 , E 3 and v 12 .The error,  , was calculated as the root mean square of the Euclidian distance between nodal displacements generated from the estimated parameters and ground truth displacements generated from the true parameters and expressed as a percentage of the root mean square ground truth displacement.
![$$ E(u^{*} ) = \frac{{\sqrt {\frac{1}{3N}\sum\nolimits_{{}}^{N} {\sum\nolimits_{{}}^{x,y,z} {\left[ {\left( {U_{R}^{C} - U_{R}^{M} } \right)^{2} + \left( {U_{I}^{C} - U_{I}^{M} } \right)^{2} } \right]} } } }}{{\sqrt {\frac{1}{3N}\sum\nolimits_{{}}^{N} {\sum\nolimits_{{}}^{x,y,z} {\left[ {\left( {U_{R}^{M} } \right)^{2} + \left( {U_{I}^{M} } \right)^{2} } \right]} } } }} $$](/wp-content/uploads/2016/09/A339585_1_En_40_Chapter_Equ5.gif)
where subscripts R and I indicate the real and imaginary components of displacement; superscripts C and M represent the calculated (or simulated) and the ground truth displacement, respectively; and N denotes the number of nodes. In both the cylindrical and LV models, only the internal nodes, which were not subject to displacement boundary constraints, were used to calculate the error function.
, was calculated as the root mean square of the Euclidian distance between nodal displacements generated from the estimated parameters and ground truth displacements generated from the true parameters and expressed as a percentage of the root mean square ground truth displacement.(5)
2.3 Determinability of Material Properties
Three criteria were evaluated in order to assess the determinability of the material parameters from the Hessian matrix computed at the minimum of the objective function, [9, 10].
D-Optimality Criterion. This is related to the volume of the indifference region, defined by the p-dimension hyper ellipsoid with size determined by the eigenvalues of the Hessian matrix. The indifference region is named thus since a small change in the parameter space within this region doesn’t affect the error function significantly. Since the volume is inversely proportional to the determinant of the Hessian, a D-optimal design would maximize det(H).
Related posts:
 Motion Estimation Using Ultrafast Ultrasound Imaging Tested in a Finite Element Model of Cardiac Mechanics
Stay updated, free articles. Join our Telegram channel

Full access? Get Clinical Tree


