Fig. 1
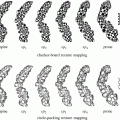
Chemical structure of gadoxetic acid. Note the lipophilic ethoxybenzyl group (red circle) that has been added to the Gd-DTPA (Magnevist®) molecule to increase protein-binding capabilities
Molecular Properties
At the level of the hepatocytes, gadoxetic acid is actively transported into the cell through the “organic anion transporting polypeptide 8” (OATP8), which belongs to the solute carrier transporter superfamily of the OATPs, located at the sinusoidal membranes of the cells (Fig. 2). The uptake of gadoxetic acid can be limited by competition with other endogenous compounds such as bilirubin and therapeutic drugs. In functional liver cells, gadoxetic acid can then be excreted into the biliary canaliculi via the “multidrug resistance-associated protein 2” (MRP2) located at the canalicular membrane of the cell or back into the bloodstream via MRP3 located at the sinusoidal membrane (Fig. 2). It is important to note that the function of all membrane proteins involved with the transport of gadoxetic acid can be altered by up- or downregulation, most commonly by retrieval from or insertion into the cell membrane [3]. A large number of factors can have an influence on the regulation of the membrane proteins such as oxidative stress or cholestasis [3]. The resulting alterations in uptake and excretion of gadoxetic acid at the level of the hepatocytes can affect the enhancement pattern of the liver rendering characterization of certain atypical liver lesions more complex and challenging.
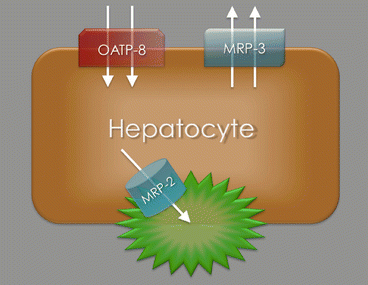

Fig. 2
Model of a hepatocyte showing the different membrane transporter proteins. Gadoxetic acid is actively transported from the bloodstream into the hepatocyte by the “organic anion transporting polypeptide 8” (OATP8) located at the sinusoidal membranes. The molecules can then be excreted into the biliary canaliculi via the “multidrug resistance-associated protein 2” (MRP2) or back into the bloodstream via MRP3. The function of all membrane proteins can be altered by up- or downregulation
Pharmacokinetics
When gadoxetic acid is injected intravenously, it is initially distributed in the extracellular fluid compartment just as the extracellular agents. Despite its significantly lower dose, it can be used for dynamic imaging of the liver similar to extracellular contrast agents; however, detection rate for subtle hyperenhancing lesions might be limited. Since gadoxetic acid is competing with other molecules such as bilirubin at the membrane transporter proteins, the degree of hepatic excretion is dependent on the liver function. In patients without significant liver disease, approximately 50 % of gadoxetic acid is excreted through the biliary system as described above and 50 % through the kidneys. Hepatic-specific enhancement is detectable as early as 1–2 min after contrast administration (Fig. 3) [4]. The high biliary excretion rate allows for a new hepatobiliary phase that becomes significant for imaging at about 10 min and is unique to this class of agents. Enhancement in the hepatobiliary phase depends on the constellation of molecular transporters (Fig. 2) and typically reflects the presence of functioning hepatocytes and biliary canaliculi. The unique contrast kinetics with a steady background increase of hepatic parenchymal signal intensity over the first 20–30 min after contrast administration prohibits a true equilibrium phase with gadoxetic acid (Fig. 3) [4]. This change in background signal intensity has the potential to complicate evaluation of vascular structures and vascular lesions.


Fig. 3
Different contrast phases after injection of 0.025 mmol/kg gadoxetic acid. Note the reversal of portal vein-to-liver contrast between arterial and delayed imaging and the absence of a true equilibrium phase due to progressive enhancement of the hepatic parenchyma
Protocol Optimization
The recommended time frame for hepatobiliary phase acquisition is within a relatively broad window of 10–120 min, with a delay of 20 min being most commonly used. In order to minimize the scanning time, some of the standard sequences can safely be acquired during the “wait time” between the early contrast phases and the hepatobiliary phase. It has been shown that ADC values of most organs are not different if acquired after contrast injection [5, 6] so diffusion-weighted imaging can be moved into the time slot between dynamic and hepatobiliary imaging. Similar holds true for standard T2-weighted turbo spin-echo (TSE) sequences. By using this strategy, total imaging time can be as low as 25 min. There is conflicting evidence regarding the quality of post-contrast acquisition of high-resolution respiratory-triggered 3D MR cholangiopancreatography (MRCP) sequences [7, 8]. Assuming a slow increase of intrabiliary concentration of the T2 shortening gadolinium-based contrast agent and a long image acquisition time secondary to the necessary respiratory triggering technique, it can reasonably be speculated that reduced intrabiliary T2 signal is a potential problem as confirmed by Ringe et al. [7]. It is therefore currently recommended that 3D MRCP sequences be performed prior to contrast administration.
While most institutions use a delay of about 20 min after contrast injection for the hepatobiliary phase, more delayed imaging can offer better opacification of the biliary tree allowing for noninvasive contrast-enhanced MR cholangiography [9]. These extra sequences can be acquired after 30 and if needed 40 min, but given this substantial amount of extra time necessary, they are mostly reserved for specific clinical indications such as evaluation for suspected postoperative bile leakage. Since acquisition speed is not of critical importance for the delayed T1-weighted gradient echo sequences, respiratory triggering can be used to reduce respiratory motion artifacts and also increase spatial resolution [10].
Imaging Appearance of Focal Liver Lesions
The characterization of focal liver lesions is a common clinical request for abdominal radiologists, partly due to the widespread use of cross-sectional imaging and the associated discovery of incidental liver lesions. Accurate classification of these lesions is crucial to enable selection of the most appropriate treatment strategy. Despite the high tissue contrast and fast dynamic imaging with MRI, some focal liver lesions are difficult to confidently characterize with extracellular contrast agents alone. Gadoxetic acid with its hepatobiliary properties is a very important adjunct to conventional MR imaging providing further information about the properties of the lesion, improving diagnostic confidence and accuracy [11].
Cavernous Hemangioma
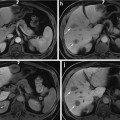
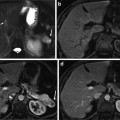
Hepatic hemangiomas (Figs. 4 and 5) are the most common benign hepatic tumors and are frequently found incidentally at routine examinations. Using CT or MRI extracellular contrast agents, hemangioma typically shows peripheral nodular arterial enhancement with progressive centripetal filling on the portal venous and equilibrium phase. This enhancement pattern is highly specific for hemangioma. However, high-flow or “flash-filling” hemangiomas, which account for about 20 % of all hemangiomas and 40 % of hemangiomas less than 1 cm in diameter [12, 13], show immediate homogenous enhancement in the arterial phase. With extracellular agents, the enhancement characteristics of hemangiomas usually follow the blood pool in the later imaging phases, so lesions will be iso- or mildly hyperintense to the liver parenchyma in the portal venous and equilibrium phases, depending on the variable degree and speed of filling. However, this hyperintensity allows confident diagnosis of hemangioma. Due to the absence of a true equilibrium phase and the increasing enhancement of the liver parenchyma with gadoxetic acid, hemangiomas are typically hypointense compared to background liver starting a few minutes after contrast administration [13]. This hypointensity of hemangiomas in the later phases makes its differentiation form hepatocellular carcinoma (HCC) and hypervascular metastases more challenging, in particular for high-flow hemangiomas lacking the classic peripheral nodular enhancement with progressive filling or lesions smaller than 1 cm (Fig. 5). This differentiation of small and/or atypical hemangioma from metastasis is a common pitfall with the use of gadoxetic acid [14, 15]. While comparison of lesion signal intensity with that of the portal vein as representative of the blood pool could be very helpful to establish the diagnosis of a hemangioma, accurate measurements of signal intensity can be challenging in small lesions. Combination with other signal characteristics such as high T2 signal intensity and ringlike arterial enhancement will also help increasing diagnostic accuracy for hemangioma versus metastasis [14]. In selected cases, it might ultimately be necessary to bring patients back and add delayed sequences after administration of a conventional extracellular contrast agent, where the blood pool remains hyperintense compared to the hepatic parenchyma, allowing the confident diagnosis of hemangioma if lesions are iso- or hyperintense (Fig. 5).
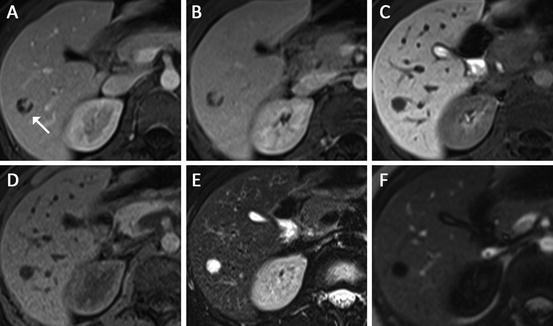


Fig. 4
Hemangioma in 39 year-old female (white arrow in (a)). Axial post-gadoxetic acid series ((a) arterial, (b) portal venous, (c) delayed 20 min) demonstrate peripheral nodular enhancement in the early phases followed by hypointensity on hepatobiliary phase imaging. Blood pool signal intensity was confirmed using the main portal vein on a different slice position (not shown). The lesion is hypointense on T1 non-contrast (d) and markedly hyperintense on fat-saturated T2 turbo spin-echo (e) also consistent with a hemangioma. Magnetization-prepared T1 GRE sequence (f) is an inversion recovery technique with the inversion time optimized for hemangioma; therefore the significant signal suppression on this sequence can serve as additional confirmation

Fig. 5
Multiple focal liver lesions detected on CT in a 37 year-old female with history of colon cancer. The upper row shows one of the larger lesions (white arrow), the lower row one of the smaller subcentimeter lesions (black arrow) ((a/f) arterial, (b/g) portal venous, (c/h) hepatobiliary phase, (d/i) T2 turbo spin-echo, (e/j) 30 min post-gadobenate dimeglumine). Based on the initial gadoxetic acid exam ((a–d) and (f–i)) confident characterization was not possible due to atypical arterial enhancement pattern, and despite some features suggesting hemangioma such as very high T2 signal intensity and blood pool signal intensity on hepatobiliary phase images. The patient was brought back for additional gadobenate dimeglumine (Multihance®) series, which on the 30-min delayed series demonstrated hyperintensity compared to background liver confirming the suspected diagnosis of hemangioma for not only the large but also the smallest lesions
Focal Nodular Hyperplasia
Focal nodular hyperplasia (FNH) are the second-most commonly encountered benign liver lesions after hemangioma with a prevalence of about 1 % [16]. In contrast to hepatic adenoma, they are classified as a regenerative lesion rather than a true neoplastic lesion [16]. FNHs have a strong female predilection of about eight to one and are believed to be a hyperplastic response of the hepatic parenchyma to a preexisting vascular malformation [16]. They are asymptomatic in most patients with none of the known complication inherent to other focal lesions such as spontaneous hemorrhage or malignant transformation. FNHs are often incidental findings and no usually no treatment is required. Currently, FNHs are classified as classic (80 %) or nonclassic (20 %). The latter group may lack the nodular abnormal architecture or malformed vessels, but always show bile duct proliferation. At gross pathology, FNHs demonstrate lobulated contours and nodular hyperplastic parenchyma with normal-appearing hepatocytes but a thickened plate architecture characteristic of regeneration. The parenchyma is surrounded by radiating fibrous septa originating from a central scar that contains large arterial vessels and is seen in about 50 % of cases [17]. The arterial blood in FNH, as opposed to that in adenomas flows centrifugally from the anomalous central arteries to the periphery of the lesion. FNHs contain abnormal bile ducts that have no connection to the hepatic biliary tree.
Typically, FNHs are iso- or slightly hypointense on T1-weighted images and slightly hyper- or isointense on T2-weighted images (Figs. 6 and 7). When the central scar is visible, it is hypointense to the lesion on the T1-weighted images and hyperintense on T2-weighted images. FNHs do not have a true capsule, although a pseudocapsule resulting from compression of the surrounding liver parenchyma by the lesion can be seen. On the dynamic contrast-enhanced images, FNHs show intense homogeneous enhancement in the arterial phase and become isointense to the liver in the portal venous phase. On delayed phase imaging, FNHs are iso- or hyperintense compared to the surrounding liver parenchyma, likely secondary to the combination of functioning hepatocytes and reduced or absent biliary drainage [18]. The central scar, while hyperintense on delayed images when an extracellular contrast agent is given, appears hypointense compared to the background liver due to the intense specific hepatic enhancement.
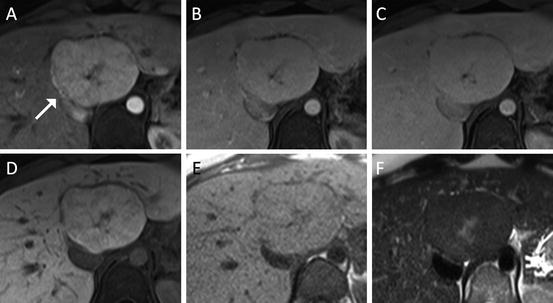
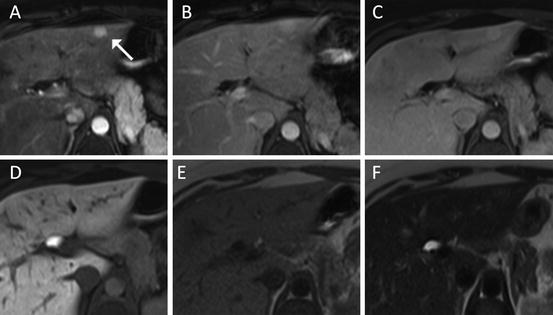

Fig. 6
Liver lesion in a 37 year-old female representing a typical FNH with central T2-hyperintense scar and multiple fibrous septa with spoke wheel pattern ((a) arterial, (b) portal venous, (c) 4-min delay, (d) hepatobiliary phase, (e) T1 non-contrast, (f) T2 turbo spin-echo). The lesion demonstrates typical arterial hyperenhancement and isointensity on the 20-min post-gadoxetic acid images highly suggestive of FNH

Fig. 7
FNH with similar imaging features as lesion in Fig. 6 (white arrow), however due to smaller size much less classical appearance ((a) arterial, (b) portal venous, (c) 4-min delay, (d) hepatobiliary phase, (e) T1 non-contrast, (f) T2 turbo spin-echo). Diagnosis here is mostly based on isointensity of the lesion on delayed images
Hepatic Adenoma
Hepatic adenomas are benign neoplasm of the liver often associated with the use of oral contraceptives and consecutive strong female predilection [19]. Growth of adenomas is driven by both the dose and duration of estrogen use. Other risk groups for hepatocellular adenoma are patients with type I glycogen storage disease and patients on anabolic/androgenic steroids. Many or most patients with no more than a few adenomas are asymptomatic and almost invariably have normal liver function and no elevation of serum “tumor markers” such as AFP. Large adenomas may cause a sensation of right upper quadrant fullness or discomfort. However, a possible clinical manifestation of hepatic adenoma if not discovered incidentally is spontaneous rupture or hemorrhage, leading to acute abdominal pain or even signs of hypovolemia [20]. Liver adenomatosis appears to be a distinct entity characterized by ten or more hepatic adenomas. Although the adenomas in liver adenomatosis are histologically similar to other adenomas, they are not steroid dependent and more likely to lead to symptoms, impaired liver function, hemorrhage, and perhaps malignant degeneration [20].
Stay updated, free articles. Join our Telegram channel

Full access? Get Clinical Tree


