Fig. 13.1
Anatomy of the iliac and femoral arteries. a Coronal plane. b Sagittal plane. 1 abdominal aorta; 2 common iliac artery; 3 external iliac artery; 4 internal iliac artery
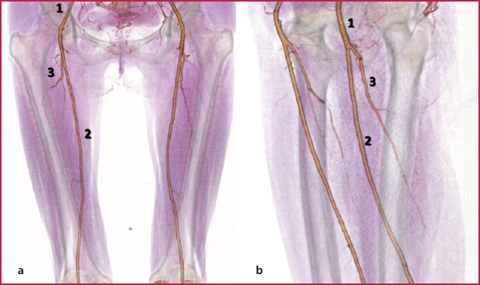
Fig. 13.2
Anatomy of the femoral arteries. a Coronal plane. b Oblique sagittal plane. 1 common femoral artery; 2 superficial femoral artery; 3 deep femoral artery
Table 13.1
Iliac arteries and collateral branches
Common | ||
External | Inferior epigastric artery | Cremasteric artery (external spermatic artery) |
Deep circumflex iliac artery | ||
Internal | Anterior branch | Superior, middle, inferior vesical artery Middle hemorrhoidal artery Obturator artery Internal pudendal artery Inferior gluteal artery Uterine artery Vaginal artery |
Posterior branch | Ilio-lumbar artery Lateral sacral artery Superior gluteal artery |
Table 13.2
Femoral arteries and collateral branches
Common | Superficial epigastric artery Superficial circumflex iliac artery Superficial external pudendal artery Deep external pudendal artery |
Deep | Lateral circumflex femoral artery Medial circumflex femoral artery Perforating branches (generally 4) Muscular branches (sartorius muscle, vastus medialis and adductors) |
Superficial | Highest genicular artery |
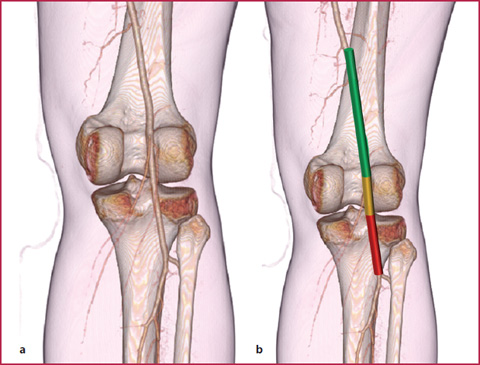
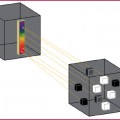
Fig. 13.3
a Anatomy of the popliteal artery. b Arterial segments are represented with different colors: supra-articular portion (green); articular portion (yellow); infra-articular portion (red)
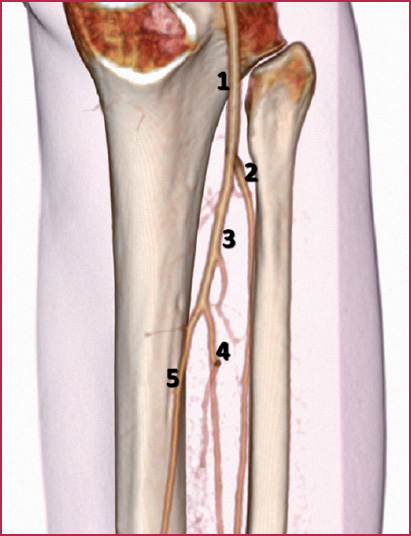
Fig. 13.4
Anatomy of the calf arteries. 1 popliteal artery; 2 anterior tibial artery; 3 tibio-peroneal trunk; 4 peroneal artery; 5 posterior tibial artery
Table 13.3
Calf arteries and collateral branches
Popliteal artery | Superior medial genicular artery | Tibio-peroneal trunk | |
Superior lateral genicular artery | |||
Medial genicular artery | Posterior tibial artery | Posterior medial malleolar artery | |
Inferior medial genicular artery | Medial calcaneal artery | ||
Inferior lateral genicular artery | Muscular branches | ||
Sural arteries | Communicating branches | ||
Anterior tibial artery | Posterior tibial recurrent artery | Nutrient branches | |
Fibular artery | Peroneal artery | Lateral calcaneal artery | |
Anterior tibial recurrent artery | Nutrient branches | ||
Anterior medial malleolar artery | Perforating branches | ||
Anterior lateral malleolar artery | Communicating branches | ||
Muscular branches | Muscular branches | ||
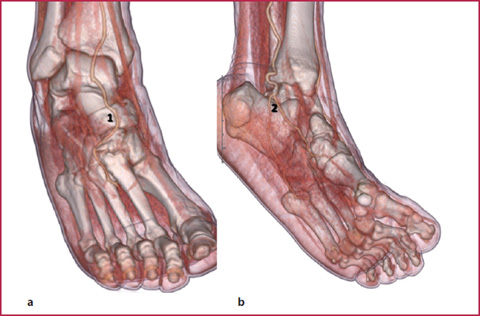
Fig. 13.5
Anatomy of the dorsal (a) and plantar (b) arteries. 1 dorsal vessels; 2 plantar vessels
Table 13.4
Arteries of the foot and collateral branches
Anterior tibial artery | Arteria dorsalis pedis (dorsal arch) | Medial and lateral tarsal arteries |
Arcuate artery First dorsal metatarsal arteries Deep plantar artery | ||
Posterior tibial artery | Medial and lateral plantar artery (plantar arch) | Metatarsal plantar arteries |
Digital branches | ||
Perforating branches |
Congenital abnormalities of the peripheral vessels are very uncommon compared to those found in other arterial districts. The most frequently observed abnormalities are the early bifurcation of the common or superficial femoral artery (Fig. 13.6) and the early origin of the tibial artery from the popliteal segment (Fig. 13.7).
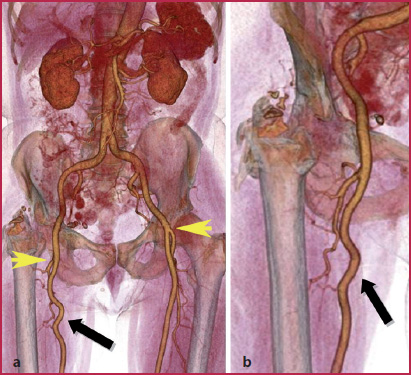
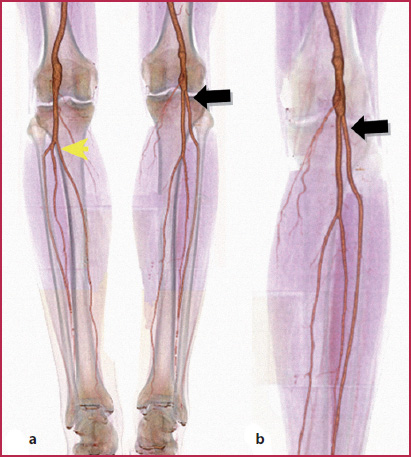
Fig. 13.6
a Early bifurcation of the left common femoral artery compared to the right femoral artery (arrowheads). b Detail of the proximal tract of the right superficial femoral artery shows a tortuous course of the vessel (arrow)
Fig. 13.7
a The same patient presented with trifurcation of the popliteal artery (arrowhead) and an early origin of the anterior tibial artery from the joint plane (arrow); both the popliteal arteries show fusiform dilatation of the lumen. b Detail of the left leg is a better indication of the abnormality of the anterior tibial artery (arrow)
The persistent sciatic artery is a rare congenital vascular anomaly occurring in approximately 0.025 to 0.04% of the population. The sciatic artery supplies blood during the early stages of embryonic development and regresses to form the proximal part of the inferior gluteal artery after the third month of embryonic life following the development of the femoral artery from the external iliac artery (Mandell et al., 1985) (Fig. 13.8). Patients with persistent sciatic arteries may be asymptomatic or have a painful pulsatile gluteal mass due to the development of an aneurysm (which occurs in approximately 46% of cases) or possible embolic events. (Fung et al., 2008).
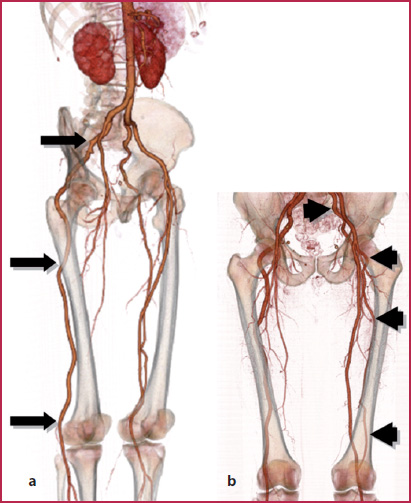
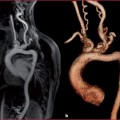
Fig. 13.8
Persistence of the sciatic artery. a Complete persistence of the sciatic artery (arrows) that extends from the gluteal region to the popliteal and calf arteries. Superficial and deep femoral arteries end in the middle third of the thigh. b Incomplete persistence of the sciatic artery, that runs through the distal third of the femur (arrowheads); in this leg the popliteal artery regularly originates from the superficial femoral artery
13.2 13.2 CTA Technique
Patient Preparation
Supine position, feet first;
Legs close to each other with a slight internal rotation of the feet;
Peripheral venous access (at least 18 G);
Remove any metal material present in the abdomen and legs.
Image Acquisition
Acquire topogram on a coronal plane and place the scan volume (from the diaphragm to the feet; approximately 130 cm longitudinal extension).
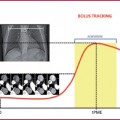
Place the region of interest (RoI) on the suprarenal abdominal aorta, avoiding possible calcifications of the vessel wall (if a bolus tracking technique is used); start the scan when a 150–200 Hounsfield Unit value is reached. If an aortic aneurysm is present, the RoI may be placed within the dilated lumen in order to reach optimal opacification of the aneurysm and avoid image acquisition too early compared to contrast medium circulation (the presence of an aneurysm may in fact cause flow turbulence that leads to contrast medium dilution).
Acquire images in the craniocaudal direction. Achieving adequate and uniform arterial opacification for the entire duration of the CT scan is critical for diagnostic quality CT angiography. When scanning the peripheral arteries it is mandatory to have (Tables 13.5–13.6):
a fast injection rate (at least 4 mL/s) with multi-detector scanners (from 64 to 128 MDCT, dual source MDCT);
high iodine concentration contrast agents (370–400 mgI/mL);
an optimal scan duration (about 38–40 s).
Table 13.5
Technical parameters used with different scanners
4 MDCT | 16 MDCT | 64 MDCT | 128 MDCT | Dual source | |
kVp | 120 | 120 | 120 | 120 | 120 |
mAs | 140 | 160 | 190* | 190* | 190* |
Collimation | 4 × 2.5 | 16 × 1.5 | 64 × 0.6 | 128 × 0.6 | 64 × 0.6 × 2 |
Slice thickness (mm) | 3 | 2 | 2 | 1 | 1 |
Recon increment (mm) | 2 | 1 | 1 | 1 | 1 |
Table 13.6
Contrast medium administration strategies used with different scanners
Cm | 4 MDCT | 16 MDCT | 64 MDCT | 128 MDCT | Dual source |
Concentration (mgI/mL) | 370-400 | 370-400 | 370-400 | 370-400 | 370-400 |
Volume (mL) | 125 | 120 | 115 | 115 | 115 |
Saline solution volume (mL) | 50 | 50 | 50 | 50 | 50 |
Flow rate (mL/s) | 2.5 | 3 | 4.5 | 4.5 | 4.5 |
The scan duration is fundamental in order to obtain optimal opacification of the arteries, in particular at the distal level where vessels are very small and can be difficult to evaluate in case of severe disease.
In fact, when a late scan is performed, there will be poor opacification of the arteries and enhancement of the veins, thus affecting the diagnostic quality of the images; contrarily, an early scan can cause poor opacification of the arteries due to the lack of iodine in the distal vessels (Fig. 13.9). In these latter cases, performing a delayed caudocranial scan can help in recovering previously missed data; this can be helpful in patients with severe atherosclerotic disease (severe stenosis or aneurysms) or with a vascular prosthesis such as bypass.
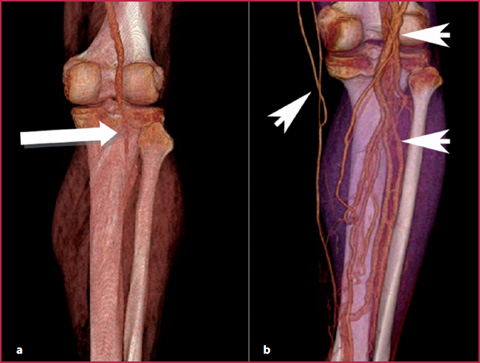
Fig. 13.9
Volume Rendering (VR) reconstruction. a Scanning too fast may cause overtaking of the contrast bolus and can thus easily miss the opacification of the distal vessels (arrow); this is often evident in patients with severe multiple stenosis or peripheral aneurysms that have reduced transit times. b Contrarily, scanning too slowly may lead to the opacification of the venous vessels of the calf (arrowheads) and make the evaluation of the distal arteries difficult
However, sometimes asymmetric arterial opacification or venous overlap between the two legs is inevitable because of diseases causing unilateral delay (Fig. 13.10) or acceleration of the patient’s circulation (Fig. 13.11).
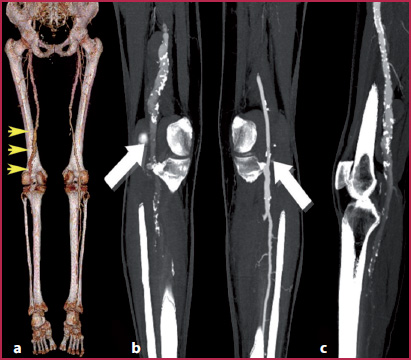
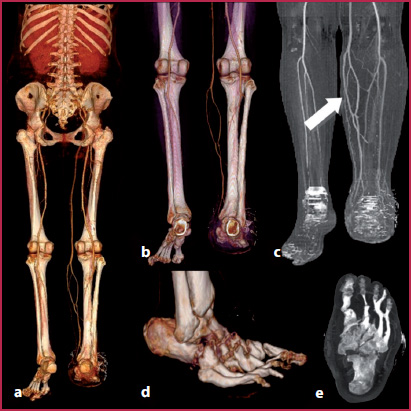
Fig. 13.10
Patient with left superficial femoral artery aneurysm. a VR reconstruction showing asymmetric circulation speed caused by an aneurysm of the distal portion of the left superficial femoral artery involving the popliteal artery (aarrowheads). b Flow turbulence causes a progressive lack of opacification of the distal vessel compared to the contralateral arteries (arrows). c MIP reconstruction of the left popliteal artery
Fig. 13.11
Patient with asymmetric circulation speed identified with VR (a,b) and MIP (c) reconstructions. In this case the early venous opacification on the left side is caused by hyperemia of the right arterial circulation and dilatation of the capillary network due to multiple bone fractures (d,e)
13.3 13.3 MRA Technique
Patient Preparation
Supine position, feet first;
Peripheral venous access (at least 20–22 G);
Remove any metal material present in the abdomen and legs;
Superficial coils for the abdomen and legs.
Image Acquisition
Time of Flight (ToF) Sequences
These sequences remain well validated and useful primarily in the distal runoff vessels (Fig. 13.12). (Cambria et al., 1997; Ho KY et al., 1997). The main limitations are (Table 13.7):
long acquisition times;
signal loss due to turbulent flow or wrong positioning of the scan volume;
flow void or ghosting due to saturation artifacts or pulsatility.
Acquire localizer on three planes;
Place the scan volume on a transversal plane (flow direction must be perpendicular to that of the sequence).
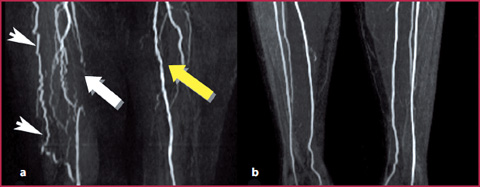
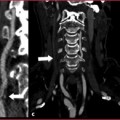
Fig. 13.12
Patient with intermittent claudication (Fontaine IIa). ToF sequences show a segmental obstruction of the right superficial femoral artery (a, white arrow) and compensatory hypertrophy of the deep femoral artery that re-establishes circulation with the collateral vessels (arrowheads). The left superficial femoral artery is patent with multiple mild irregularities of the vessel wall (yellow arrow). The distal arteries are regularly patent and clearly visible on the coronal plane (b)
Table 13.7
Technical parameters for ToF sequences
TR (ms) | 30 |
TE (ms) | 3.9 |
FoV (mm) | 180 × 140 |
Slice thickness (mm) | 1 |
Matrix | 256 × 224 |
Acquisition time (min) | 5 |
T1-Weighted 3D Gradient-Echo (GRE) Sequences
These sequences are most often used thanks to their high spatial and contrast resolution that enables diagnostic accuracy similar to that of conventional angiography.
They also can be used together with time-resolved sequences in a so-called hybrid protocol.
The parameters for contrast administration are summarized in Table 13.8; technical parameters of T1 GRE 3D sequences are shown in Table 13.9.dfdfdfd
Table 13.8
Contrast medium injection strategy used with GRE T1-weighted sequences
Concentration (M) | 0.5 |
Volume (mL) | 15 (0.2 mL/kg) |
Saline solution volume (mL) | 20 |
Flow rate (mL/s) | 1.5-2 |
Table 13.9
Technical parameters for GRE T1-weighted sequences
Abdomen | Legs | Feet | |
TR (ms) | 3 | 3 | 3 |
TE (ms) | 0.9 | 0.9 | 1.4 |
Flip angle | 25° | 25° | 25° |
Slice thickness (mm) | 1.4 | 1.4 | 1.2 |
Matrix | 384 × 384 | 384 × 384 | 512 × 512 |
Acquisition time (s) | 15 | 16 | 21 |
Three-Step Protocols
Acquire a localizer on three planes in the abdomen, thigh, and calf region;
Acquire a GRE 3D as a pre-contrast mask on the coronal plane for each region;
Use a fluoro-MR sequence to visualize the contrast agent arrival;
Acquire the contrast-enhanced sequence (GRE 3D) identical to the mask when the abdominal aorta is enhanced. Images are acquired for all three regions in the craniocaudal direction;
Subtract the last-acquired sequence from the mask.
Hybrid Protocol (Fig. 13.13)
The combination of a standard bolus-chase MRA and time-resolved sequences offers a valuable alternative for the assessment of the vascular status of patients with asymmetric circulation in the peripheral arteries or when an optimal arterial phase of the distal vessels is required (i.e. in diabetic patients), allowing, moreover, the visualization of small collateral vessels not identified at the first pass.
Acquire time-resolved MRA of the calf and foot on a coronal plane by injecting a small bolus of the contrast agent (8–10 mL);
Acquire conventional contrast-enhanced sequences (GRE 3D) of the remaining two regions (abdomen and thigh) by injecting a second small bolus of the contrast agent (10–15 mL).
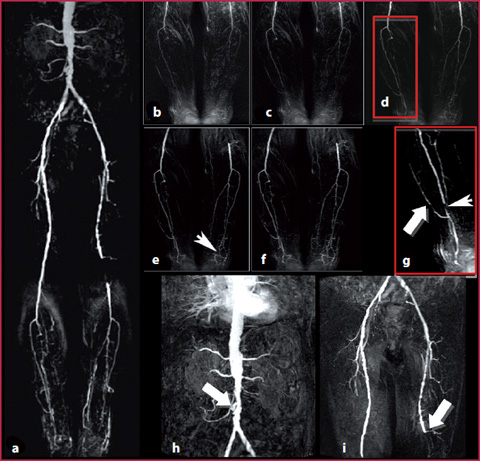
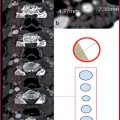
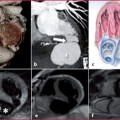
Fig. 13.13
a Hybrid MRA protocol in a patient with intermittent claudication (Fontaine lib). b-f Images obtained with time-resolved sequences show the presence of multiple obstruction at the level of the distal vessels, with thin collateral vessels (e, arrowheads). g The right anterior tibial artery is obstructed at the distal tract (arrowheads), while the dorsal circulation of the foot is sustained from a collateral vessel (arrow). h,i GRE sequences obtained in the abdomen and thigh show a severe irregularity of the wall at the level of the infrarenal aorta with evidence of ulceration on the right side (h, arrow) and an obstruction of the left popliteal artery on the joint plane (i, arrow)
Related posts:
Stay updated, free articles. Join our Telegram channel

Full access? Get Clinical Tree


