Wedge-shaped area of hyperattenuation with straight margins seen during arterial phase of CECT or MR
Becomes isodense to hepatic parenchyma during portal venous phase of CECT or gadolinium-enhanced MR
• Peripherally within hepatic segment or lobe
• Usually ≤ 1.5 cm (e.g., cirrhotic arterioportal [AP] shunts)
Larger in some cases of post-biopsy AP shunts
Early enhancement of peripheral portal vein (PV) branches prior to visualization of main PV
TOP DIFFERENTIAL DIAGNOSES
• Hypervascular liver mass (e.g., hepatocellular carcinoma [HCC])
Usually round or oval, not wedge-shaped
Usually shows washout on venous phase
• Hemangioma
Attenuation tracks blood pool on all phases
• Focal sparing with fatty liver
Not really hypervascular foci
Relatively high-attenuation areas of “normal” liver surrounded by low-attenuation fatty liver
PATHOLOGY
• Small AP shunts are not amenable to biopsy
Too small; invisible on NECT and US
DIAGNOSTIC CHECKLIST
• Small (< 1.5 cm) AP shunts are common in cirrhosis
If unassociated with focal lesion on MR, it is probably insignificant
Follow-up in ∼ 6 months is indicated and adequate
• Do not mistake multiple small AP shunts for multifocal HCC
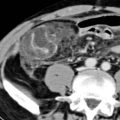
(Left) Seen only on the arterial set of images are multiple peripheral, wedge-shaped, hyperenhancing foci in this 60-year-old man with cirrhosis due to chronic viral hepatitis.
(Right) Axial arterial phase CECT in the same patient shows additional peripheral, wedge-shaped, hypervascular foci . Also note the large, “corkscrew” hepatic arterial branch , a typical feature of cirrhosis. The liver has a cirrhotic morphology with wide fissures.
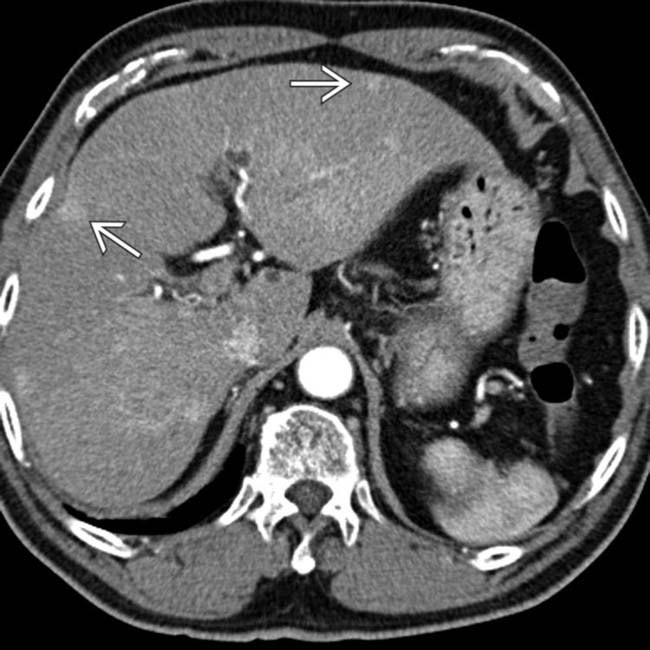
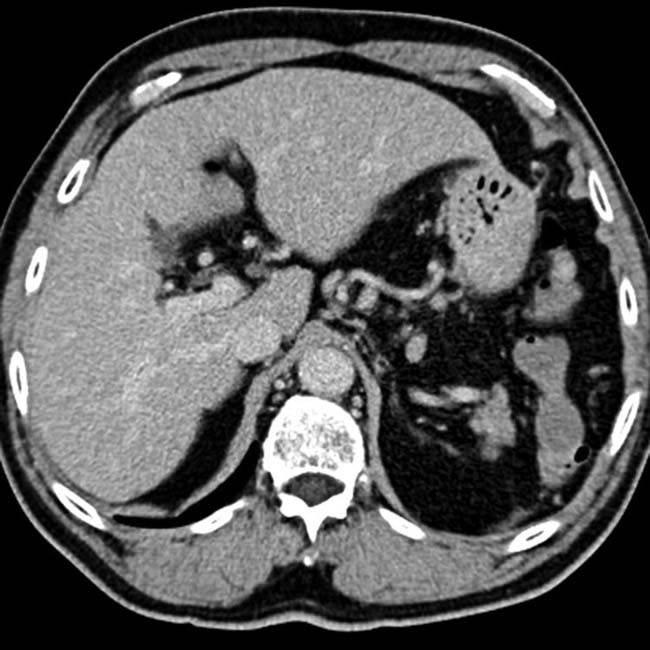
(Left) Axial portal venous phase CECT in the same patient shows none of the peripheral hypervascular lesions, which have become isodense to liver.
(Right) Axial delayed phase CECT shows no washout or other evidence of the focal peripheral lesions seen on arterial phase. AP shunts are common within the cirrhotic liver. Imaging features that favor AP shunt over HCC include peripheral, subcapsular location, small size, wedge shape, and no corresponding lesion on venous or delayed phase imaging.
TERMINOLOGY
Abbreviations
• Arterioportal (AP) shunt
Definitions
• Communication between a branch of hepatic artery and portal venous system
IMAGING
General Features
• Best diagnostic clue
Nodular or wedge-shaped area of hyperattenuation with straight margins seen during arterial phase of CECT or gadolinium-enhanced MR
Becomes isodense to hepatic parenchyma during portal venous phase of CECT or gadolinium-enhanced MR
• Location
Peripherally within hepatic segment or lobe
• Size
Usually ≤ 1.5 cm (e.g., cirrhotic AP shunts)
– Larger in some cases of post-biopsy AP shunts
– Transient hepatic attenuation difference (THAD) and transient hepatic intensity difference (THID) can be much larger
Can involve entire hepatic segment or lobe
• Morphology
Wedge-shaped with straight margins
Imaging Recommendations
• Best imaging tool
Multiphasic CECT or gadolinium-enhanced MR
• Protocol advice
Arterial phase acquisition of CECT or MR at 25-35 seconds after injection
– Followed by venous phase (60-70 seconds) and delayed phase (∼ 120 seconds)
CT Findings
• Arterial phase imaging
Early enhancement of peripheral portal vein (PV) branches prior to visualization of main PV
Peripheral wedge-shaped area of increased attenuation with straight edges within affected segment or lobe
– Hyperdense areas on arterial phase imaging
• Portal venous and delayed phase imaging
Area of previously increased attenuation equilibrates, becomes nearly isodense with rest of liver
Cause of larger AP shunt (e.g., PV thrombosis, hepatic mass) may be more visible during portal venous phase
MR Findings
• T1WI
T1WI and T2WI usually normal for nontumoral causes of AP shunts
• T2WI
Rarely slight increase in T2 signal in affected lobe or segment of nontumoral shunts
Underlying mass may cause abnormal T2 signal with AP shunts related to hepatic masses or tumors
• Dynamic gadolinium-enhanced MR
Arterial phase imaging (25-35 seconds after injection)
– Wedge-shaped area of increased signal intensity in segment or lobe of shunt
Only gold members can continue reading. Log In or Register to continue


 in this 60-year-old man with cirrhosis due to chronic viral hepatitis.
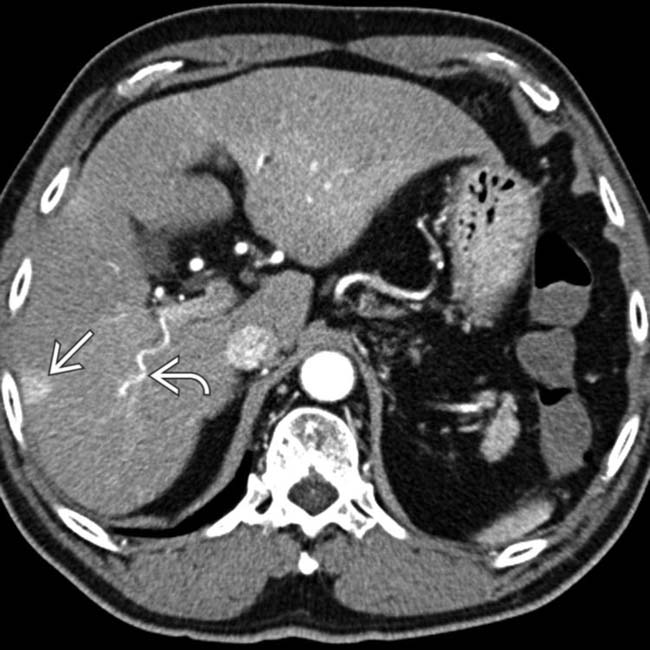
 . Also note the large, “corkscrew” hepatic arterial branch
  , a typical feature of cirrhosis. The liver has a cirrhotic morphology with wide fissures.
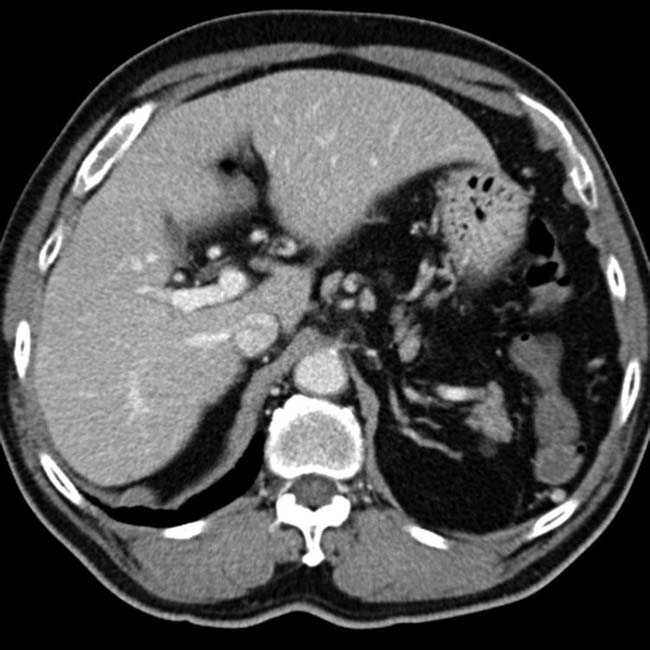
 Nodular or wedge-shaped area of hyperattenuation with straight margins seen during arterial phase of CECT or gadolinium-enhanced MR


 Arterial phase imaging (25-35 seconds after injection)