, P. Peloschek1, H. Bischof1 and F. Kainberger1
(1)
Institute for Computer Graphics and Vision, Graz University of Technology, Inffeldgasse 16, 8010 Graz, Austria
Abstract
Rheumatoid arthritis (RA) is a chronic disease that affects joints of the human skeleton. During therapy and during clinical trials, the accurate and precise measurement of the disease development is of crucial importance. Manual scoring frameworks exhibit high inter-reader variability and therefore constrain therapeutical monitoring or comparative evaluations during clinical trials.
In this chapter an automatic method for the quantification of rheumatoid arthritis is described. It is largely based on appearance models, and analyses a radiograph with regard to the two main indicators of RA progression: joint space width narrowing and erosions on the bones.
With the automatic approach a transition from global scoring methods that integrate over the entire anatomy, towards local measurements and the tracking of individual pathological changes becomes feasible. This is expected to improve both specificity and sensitivity of imaging biomarkers. It can improve therapy monitoring in particular if subtle changes occur, and can enhance the significance of clinical trials.
1 Introduction
Rheumatoid arthritis (RA) is a chronic systemic inflammatory disease involving joints on e.g. the fingers, wrists and feet. It is chronic and progressive, and can result in severe pain. Recurring inflammation of the affected joints (i.e. arthritis) leads to a degradation of cartilage (joint space narrowing) and to erosive destructions (erosions) of the bone. If not treated properly RA can lead to the complete destruction of the joints. It affects physical function and mobility, and causes substantial short-term and long-term morbidity and increased mortality.
In Fig. 1a a joint affected by the disease is depicted. On the left side the course of the synovitis is shown. On its inner side the joint capsule is covered by the synovia. During the early phases of the disease the synovia becomes thicker and hypervascularized, also called synovitis (i.e. inflamed synovia, or pannus). The synovitis invades the bone and destroys the cartilage starting at the bare areas where the bone is not protected by cartilage. In Fig. 1b the two radiological markers for the disease progression are indicated: the thinned cartilage causes the joint space width to decrease since the two bones constituting the joint converge. The bare area lies between the cartilage and the osseous fixation of the joint capsule. It is not covered by cartilage, which has an osteo-protective effect against synovitis, thus the inflamed synovia starts here with the destruction of the bone (erosions).
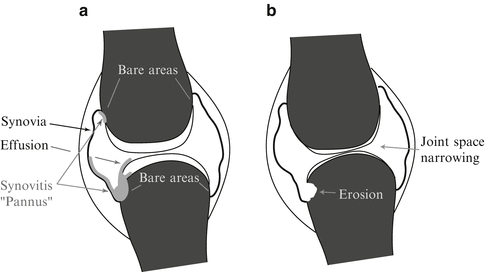

Fig. 1
A joint affected by synovitis and succeeding RA exhibiting joint space narrowing and erosive destructions in the bare area
1.1 The evolving state of the art in RA assessment
The radiographic surrogates associated with the progression of RA are joint space narrowing (JSN) which reflects an impairment of the cartilage and erosions, the destructions of the bony structure. The precise quantification of these markers is a decisive factor during treatment and during clinical multi-center trials. While ultrasound and magnetic resonance imaging are used to monitor synovitis, radiography is the standard modality for long-term RA progression monitoring [34]. Scoring of radiographic joint space width and erosions are accepted imaging biomarkers to assess the progression of RA during therapy.
Several manual scoring systems [21, 27] have been published and refined over the last 30 years. They use a discrete scale of categories to integrate the status of multiple joints. They are time consuming, require specialized training, and suffer from significant inter-and intra-reader variation [35]. This limits long-term assessment of disease progression, as well as the feasibility and discriminative power of multi-center studies.
Automated continuous local measurements can be expected to exceed traditional ordinal scoring scales in terms of sensitivity and precision.
The availability of digital image acquisition systems has prompted the development of new, increasingly automatic, quantitative measurement methods for radiographic features such as bone axes, bone density, or joint space width. In one study [1] an interactive joint space measurement method for rheumatoid arthritis of the finger joints gave highly reproducible results, thus increasing the study power while remaining consistent with traditional scoring.
Another interactive approach [25, 26], where points had to be placed manually in the metacarpophalangeal joint (MCP), achieved a considerably high reproducibility rating. In [8, 10] the diagnostic performance of a computer based scoring method was also found to surpass traditional scoring. These methods are restricted to angle- and distance measurements, include manual annotation on the image as part of the measurement procedure, and integrate only a limited degree of automation with user input. In [30] different methods for the measurement of the joint space width with various states of automation were compared. In [24] initial experiences with a fully automatic joint space width measurement method for RA were reported.
In a number of recent clinical studies [2, 3, 15, 22] erosions proved to provide more discriminative information on disease progression with respect to the treatment as opposed to the joint space width. The manual assessment of erosions in the traditional scoring frame work impedes the precise follow-up quantification and suffers from the afore-mentioned limitations.
2 Localized pathology quantification and tracking
A fully automatic local assessment of the pathological changes is highly desirable since it is a prerequisite for an accurate, reproducible and ultimately more sensitive measurement of the disease status. It is a development from discrete global scoring schemes towards continuous measurement methodologies [26, 28]. Model-based methods allow for a location consistent monitoring or tracking of subtle changes of anatomical structures. This can result in higher accuracy and becomes essential, due to advances in therapy that decelerate the disease development considerably [9]. Model-based strategies for an automated analysis of radiographs are applicable to osteoarthrtitis, spondylosis, osteoporosis, and axial malalignments in a straightforward manner.
Appearance models are used to solve three different problems during the disease assessment:
Detection of the anatomical structures of interest in the radiography data.
Consistent identification of individual positions in the anatomy over time for a single patient (pathology tracking), and localization of corresponding positions between patients.
Analysis and measurement of the deviation from a healthy training population: the residual error after appearance model matching can be used to indicate pathologies if the training population is sufficiently representative.
In this chapter, we describe an automatic method to measure both joint space width and erosive destructions caused by RA. Parts of it have been proposed in [17, 19, 20, 24]. The basis of the approach are appearance models, and we will emphasize the particular uses one can make during the application of this family of methods.
3 Automatic Quantification of Rheumatoid Arthritis
Given a hand radiograph, the RA quantification is initialized by a local linear mapping which uses texture appearance, to locate the relevant joint positions. Subsequently active shape model (ASM) driven snakes identify the individual bone contours with a statistical shape and texture model. They account for deviations from the training population due to pathological changes. This allows for an accurate bone contour delineation even with difficult and ambiguous image data and results in a reproducible identification of landmark positions on the bones.
The joint space widths are measured between the detected contours and the location information covered by the model landmarks (i.e. the definition of the joint region on the bone). Erosions and their extent are determined by a boosted classifier ensemble that analyses texture features extracted from the bone contour region. It results in a label for each contour point describing the extension of erosive destructions. Furthermore erosions can be marked by the residual appearance model fitting error [20]. For both measures the model landmarks serve to establish correspondences across individuals, e.g. in order to define the joint space width measurement region and to track changes during follow-up assessment of one individual.
4 Locating the Joints: ShapeLLMs – Appearance Models and Local Linear Mappings
As a first step before segmenting the individual bone contours, a coarse estimate of the joint positions is necessary to provide the ASMs with a reliable initialization. The repetitive appearance and the variability of the hand positioning during acquisition is beyond the capture range of the ASMs that delineate the bone contours. Local linear mappings (LLMs) are trained to detect the positions of 12 joints (Fingertips, metacarpophalangeal joint metacarpophalangeal joints (MCP) and carpo metacarpal joints (CMC) of Fingers 2,3,4, and 5). They have been used for hand gesture recognition [23] and perform well on salient structures. In the case of radiographs they model dependencies between local image texture and landmark positions, and give reliable results for the initial detection of the hand, its orientation and the positions of the individual bones for the ASM initialization [17]. For each of the 12 joints a cascade of LLMs is trained on a series of increasingly small texture patches. The initial estimate is based on features extracted from a configuration of 12 overlapping windows on the radiograph. Subsequent iterations are based on features extracted locally at the current joint position estimate. The deformation of the configuration is constrained by a statistical shape model. In Fig. 2 an overview of this estimation is shown, a detailed explanation is given in [17, 19].
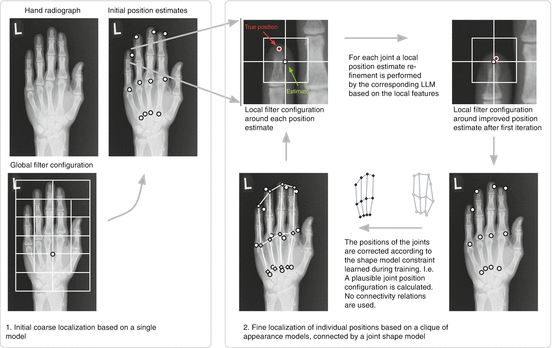

Fig. 2
Schematic overview of the joint localization by ShapeLLMs
5 Delineating the Bone Contours: Active Shape Model Driven Snakes
Based on coarse joint position estimates active shape model (ASM) driven snakes [18, 19] delineate the bone contours and identify regions relevant to analysis. ASM driven snakes (ASMdS) segment the bones in a two-phase process: first they rely on a statistical shape model (ASM) to obtain a stable contour estimate, this is followed by an active contour approach, that controls the statistical model constraint in a gradual manner and adapts to deviations from the training population, while retaining the landmark identities.
5.1 ASM driven snakes
ASMs [6] are statistical landmark based models that represent the variation of shape and local gray values of a training set of examples in a compact manner. Although they provide very reliable estimates, the accuracy of ASMs with respect to the true image structure or contour is limited because of the shape model constraint that is based on a finite training population. This is a drawback if fine details that possibly deviate from the training population have to be analyzed, and the ASM training set stems from bones with no deviations from normal anatomy, e.g. because the variability of local pathological changes cannot be modeled with a reasonable training set size and evades the representative power of a linear model. A similar issue was addressed in [7]. ASM driven snakes overcome this constraint by gradually decreasing the influence of the model constraint. They refine the contour estimate obtained by ASM and fit slight deviations from the normal training anatomy. However, they retain the location information captured by the model landmarks. The result is a dense delineation of the bone contour, and known positions of the landmarks on this contour.
5.2 ASM driven snakes search
The ASM search results in landmark estimates x ASM = (x 1, . . . ,x n ). These landmarks are interpolated by a spline which is sampled at smaller intervals: c = (c 1, . . . ,c d ). Gray level profiles p i with length m are extracted from the image orthogonally to the interpolated contour. They build a matrix P = [p 1, . . . ,p d ]. Figure 3 shows the original positions of the grey level extraction points for a contour section of a proximal phalanx, and the set of extracted profiles P(x, y) for the entire bone contour. The spline interpolation in between the ASM landmarks is positioned at points s 1 = (x, y) i=1,…,d : (x, y) i = (i, m/2) in P(x, y), and can serve as initialization for a search with an active contour in P. As in the standard active contour search, we minimize an energy functional

where the first term is the internal energy E int capturing elasticity and rigidity properties of the curve, and the second term is the external energy E ext . Their influence is determined by the factors α and β. The external energy E ext is derived from the image and usually drags the contour towards high gradient edges in the data. In our case the local texture model of the ASM is taken advantage of by deriving E ext from the image in the following way: the mean grey-level profiles corresponding to the landmarks in the ASM: g 1 ASM , . . . , g n ASM are interpolated in order to derive an ordered set g 1 , . . . , g d . Thus, for every column in P a corresponding grey level profile g i is generated approximating the mean appearance in the training set from the model grey value profiles. The identification between g i and p i is defined by the landmarks on the fitted ASM. Then

(1)


