Functional MR imaging is the technique of choice to evaluate and manage malignant musculoskeletal masses. Advanced MR imaging sequences include chemical shift MR imaging, diffusion-weighted imaging with apparent diffusion coefficient mapping, MR spectroscopy imaging, and dynamic contrast-enhanced perfusion imaging. Functional MR imaging adds value to morphologic sequences in the detection, characterization, staging, and posttherapy assessment of malignant musculoskeletal malignancies. This article reviews the technical role of each functional sequence and their clinical applications to allow more confident decisions to be made. Multiparametric analysis of functional and anatomic MR sequences allows musculoskeletal tumors analysis to be improved.
Key points
- •
Functional MR imaging sequences include chemical shift (in-phase and opposed-phase) MR imaging, diffusion-weighted imaging (DWI) with apparent diffusion coefficient mapping, MR spectroscopy imaging, and dynamic contrast-enhanced imaging.
- •
Advanced MR imaging techniques can provide improved tools to characterize skeletal lesions and differentiate benign from malignant lesions.
- •
Whole-body MR imaging with DWI may become a widespread first-line tool for detection and therapy monitoring of malignancy on bone.
- •
Multiparametric MR imaging is an accurate and reliable imaging modality in local tumor staging in patients with soft tissue sarcoma.
- •
Posttreatment evaluation using functional MR imaging sequences adds value after chemotherapy and/or radiation therapy to help determine treatment response and distinguish postoperative fibrosis and inflammation.
Introduction
MR imaging is the technique of choice to manage malignant musculoskeletal masses. The radiologic evaluation of musculoskeletal malignancies has changed within recent years, mainly because of the introduction of evolving new MR imaging sequences. The new advances in MR imaging have made the imaging of musculoskeletal masses more complex. MR imaging can be used for detection, characterization, staging, and assessment of tumor after treatment.
Different combinations of pulse sequences might be necessary to provide additional value for the assessment of a musculoskeletal mass. Each sequence, either conventional (anatomic) or advanced (functional), provides specific information through the analysis of anatomy, physiology (cellularity and vascular function), metabolism, or molecular biology of the tumor tissue.
Functional MR imaging combines information on tumor morphology with quantitative information on underlying tissue characteristics using different imaging biomarkers. Advanced MR imaging sequences include chemical shift (in-phase and opposed-phase) MR imaging, diffusion-weighted imaging (DWI) with apparent diffusion coefficient (ADC) mapping, MR spectroscopy imaging (MRSI), and dynamic contrast-enhanced (DCE) MR imaging. Table 1 lists the biological-pathogenic process studied by each functional MR imaging sequence.
| Sequence | Biological Significance |
|---|---|
| Chemical shift imaging | Presence of microscopic fat |
| Perfusion, DCE, MR imaging | Vascularization (angiogenesis) |
| Diffusion (DWI) | Cellularity (viable tumor) |
| Spectroscopy (MRSI) | Metabolism (choline: cellular membrane turnover) |
In this article, the role of functional MR imaging in the evaluation of malignant musculoskeletal malignancies is discussed, with a focus on detection, characterization, staging, and tumor assessment after treatment. It also reviews the technical adjustments necessary in each sequence for the enhancement of their clinical applications in the musculoskeletal system in order to allow more confident decisions to be made when dealing with malignancies. Note the importance of performing a combined analysis of the information provided by conventional sequences (T1-weighted and fluid-sensitive sequences) together with the functional sequences, because each may provide some additional value for the assessment of a musculoskeletal lesion, in its characterization, determination of extent, or posttreatment evaluation.
Functional MR imaging techniques
Chemical Shift Imaging
Chemical shift imaging is based on the principle of separately detecting protons that precess with very similar but slightly different frequencies (such as fat and water), to identify potentially neoplastic lesions in bone marrow using 2 different echo times (TEs). When the protons of fat and water are located within the same voxel and are imaged while in phase, they are responsible for additive signal intensity on the image because the protons are in sync with each other; but when they are imaged in opposed phase they are responsible for a decrease in signal intensity on the image because the protons are out of sync with one another. This condition occurs most prominently when the amounts of fat and water are similar. At 1.5 T, the most commonly used TEs are 2.3 milliseconds and ∼4.7 milliseconds for opposed-phase and in-phase imaging, respectively. With current software, images at both TEs can be obtained in the course of a signal dual-echo acquisition.
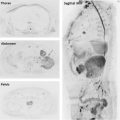
Chemical shift imaging has the ability to reveal microscopic fat, which makes it especially useful in distinguishing normal bone marrow with abundant fat from a pathologic condition that may replace fatty marrow ( Fig. 1 ). In contrast, in a process in which fatty marrow is not replaced (such as edema or red marrow mixed with yellow marrow), there is a decrease in signal intensity on the opposed-phase image compared with the in-phase image. The signal intensity ratio (SIR) of the marrow on the opposed-phase image to the in phase can be calculated, creating a region of interest (ROI). It has been shown that using an SIR greater than 0.8 is suggestive of malignant process and an SIR less than 0.8 is typical of nonmalignant processes. The utility of the technique is likely greater for distinguishing a true marrow-replacing tumor from other processes such as edema or hematopoietic marrow than for strictly distinguishing benign and malignant bone tumor.
It is important to remember that the voxel of interest must contain both lipid and water; hence, a benign tumor such as a lipoma may show no decrease in signal intensity on opposed-phase images compared with in-phase images, even though the neoplasm is benign. Modern MR magnets can combine the in-phase and out-of-phase images with water-only (fat-suppressed image) and fat-only images, resulting in the Dixon method. The current Dixon-type sequences produce 4 sets of images: water only, fat only, in phase, and out of phase. The fat-only images offer the potential for fat quantification.
Diffusion-weighted MR Imaging
Only specific aspects of DWI relevant to the assessment of musculoskeletal malignancies are discussed here. However, a detailed explanation of the physics of DWI is presented elsewhere in this issue. DWI complements the morphologic information obtained with conventional MR imaging. DWI measures the random motion of water at a microscopic level in the body, and is sensitive to changes in the microdiffusion of water within the intracellular and extracellular spaces, as well as transcellular and intravascular spaces (microcirculation-perfusion fraction).
DWI is commonly performed using a single-shot or multishot echo-planar imaging (EPI). This sequence is faster and less sensitive to patient motion, and allows large volume coverage. However, EPI DWI images are prone to artifacts, particularly magnetic susceptibility artifacts, especially at tissue interfaces such as between air and soft tissue or bone and soft tissue. The EPI DWI images are also prone to geometric distortions, particularly in large fields of view.
To detect the characteristic differences in water movement, diffusion-probing gradients are applied during the scan period. The strength of these gradients determines the degree of diffusion weighting and is expressed by the b value. The typical DWI acquisition produces image sets at 2 or more b values. The signal intensity change over these different b values is quantified through calculation of the ADC, which is performed automatically for each voxel at the time of imaging, creating the ADC map, which is a visual representation of the calculated ADC values. It is possible to calculate the specific ADC value by drawing ROIs. Areas of restricted diffusion have low ADC values and high signal intensity on high–b-value diffusion-weighted images, with the reverse occurring for areas with unrestricted diffusion.
In addition to diffusion of water molecules in the extracellular space contributing to ADC values, the ADC values of tumors are increased by the degree of tumor perfusion. The perfusion fraction (microcirculation) tends to be higher in malignant than in benign tumors, and therefore contributes more to increasing ADC values in malignant tumors than it does in benign tumors. Hence, perfusion could increase the ADC value more in malignant tumors than in benign tumors, resulting in an overlap in ADC values between benign and malignant tumors. To overcome this analysis, it has been proposed to use a biexponential model of diffusion signal analysis, also known as intravoxel incoherent motion (IVIM), to separate tissue microcapillary perfusion from the true tissue diffusivity using quantitative parameters. This model separates the diffusion signal decay in 2 different diffusion compartments. For low b values, between 0 and 100 s/mm 2 , the diffusion signal experiences a fast decay because of the blood flow along the microvasculature, whereas for higher b values, more than 100 s/mm 2 , the signal decay corresponds with the conventional diffusion of the tissue. This DWI sequence with the IVIM model obtains 2 diffusion coefficients, one related to molecular diffusion restriction (higher b values), D, and another related to the tissue perfusion, called D* (lower b values). Calculation and quantification of D* (perfusion contribution to signal decay), D (real diffusion of H 2 0 molecules), and f (perfusion contribution to the diffusion signal) are possible with this approach, and they are more reliable markers of tissue diffusion than the previously used ADC. IVIM analysis can provide an independent measure of tissue perfusion, because malignant tumors show lower diffusion (D) and higher perfusion (D*) compared with benign tumors ( Fig. 2 ). A easier way to moderate the effect of perfusion on ADC calculation is to avoid b values less than 100 s/mm 2 in ADC quantification in order to minimize perfusion effects; this parameter has been called perfusion-insensitive ADC by some investigators.
Another important consideration to interpret DWI sequence is known as the T2 shine-through effect. Any tissue with sufficiently long T2 relaxivity (eg, fluid within a simple cyst) can show high signal intensity on the high–b-value image, even though diffusion may not be impeded in such tissues. However, T2 shine-through can be distinguished from true impeded diffusion by corroborating the signal intensity on the ADC map. A lesion with T2 shine-through shows high ADC value ( Fig. 3 ).
It should be considered together the content of the tumor, with the interpretation of DWI (at low and high b value) and ADC images ( Table 2 ), when analyzing skeletal tumors. The ROI should be placed independently on different locations within the lesion according to solid, cystic, or necrotic tissues, instead of performing an average or a total placement of the ROI within the lesion, to minimize overlaps between ADC values of malignant and benign tumors ( Fig. 4 ). Some investigators prefer the use of the minimum ADC value to mean ADC, because it reflects the area of the highest tumor cellularity.
| b = 0 | b = 500–1000 | ADC | Interpretation |
|---|---|---|---|
| High | High | Low | High cellularity Malignant tumor |
| High | High | High | Cyst/hemangioma T2 shine-through |
| Low | Low | Low | Fibrosis |
| High | Low | High | Fluid (edema) Necrosis |
Magnetic Resonance Spectroscopic Imaging
MR spectroscopy (MRS) is a noninvasive metabolic imaging technique that has shown value in identifying malignant tumors. In clinical practice, MRS produces spectra from the patient with an anatomic/spatial reference. MRS is mainly based on 1 H, because hydrogen is one of the main elements in the human body. In vivo MRS allows the analysis and quantification of metabolites present in a tissue in a noninvasive way. MRS is based on the fact that protons in different molecules resonate at slightly different frequencies. This feature is secondary to the differences in the local electron cloud, which may shield the nucleus from the main magnetic field. Different metabolites containing the same nucleus show characteristic chemical shifts in resonance frequency. Proton MRS peaks provide signal from water, lipid, and other metabolites, such as choline, creatine, lactate, N -acetyl-acetate, and or trimethylamine ( Fig. 5 ). To date, the main diagnostic value of 1 H MRSI in tumors is the detection of increased levels at 3.2 ppm of choline-containing compounds or total choline, which includes contributions from choline, phosphocholine, and glycerophosphocholine. MRS provides a specific curve related to the region analyzed. Multivoxel 1 H MRS or the single-voxel technique can be used to analyze choline peaks. The ROI to analyze should be combined with the other functional sequences in order to obtain the information within the solid areas showing early and intense contrast uptake. Detection of certain metabolites provides a noninvasive method to help distinguish malignant from nonmalignant tissue. The lesion should be positioned in the center of the magnet and coil whenever possible, and artifacts should be avoided. The smallest ROI available (1–3.0 cm 3 ) should be positioned in solid and homogeneous tumor areas, to avoid hemorrhage, necrosis, and calcification. Shimming in the voxel and suppression of water are important, and are usually performed automatically by the scanner. Increased levels of choline, which is a marker of increased cell membrane turnover, has been shown to be increased in malignant tumors. MRS studies on musculoskeletal tumors have produced variable results because choline level is increased in malignant as well as benign tumors. Recent investigations at 3 T show that choline concentrations are notably different for benign and malignant musculoskeletal lesions, determining the absolute choline concentration at MRS by using a water-referencing method.
Dynamic Contrast-enhanced Perfusion MR Imaging
DCE-MR imaging is usually performed with volumetric gradient-echo sequences (T1 or relaxivity-based methods) repeated several times after intravenous contrast agent administration. The temporal resolution depends on the need for spatial resolution and filed-of-view coverage. Highly time-resolved MR angiographic sequence, named TRICKS, TRAK or TWIST depending on the vendors name’s, allows the analysis of perfusion and vessels within 1 sequence ( Fig. 6 ). It is advisable to perform a temporal resolution acquisition of less than 5-seconds for 4 to 5 minutes. Analysis of the DCE-MR imaging sequence can be performed using a variety of postprocessing methods and creating time-intensity curves from an ROI. Analysis can be done in a qualitative (time–signal intensity curve [TIC] profile), semiquantitative (parameters derived from changes in the signal intensity), or quantitative manner. Qualitative approaches use the types of curve profile: progressive enhancement, delayed plateau, or delayed washout, corresponding with curves type I, II, or III, respectively. Semiquantitative values measure and quantify, among other things, the relative signal intensity (higher postcontrast signal intensity/precontrast signal ratio), slope of the intensity-time curve (which shows speed of enhancement), or the area under the intensity-time curve (AUC). These measurements are easy to obtain in the workstations and can be represented in parametric maps, but cannot be compared among different vendors or examination times. For obtaining quantitative parameters, pharmacokinetics models defining 2 or more compartments are used, which allow quantification of various parameters: k trans (transit of the contrast from the vascular compartment to the interstice through the endothelium), k ep (return to the vascular compartment), and V e (fraction of extracellular space of tumor). In addition, using these data parametric maps representing the intratumoral heterogeneity of the vascular distribution can be generated. Nonetheless, the complexity behind these parameters, the lack of standardization, and the lack of a of universal postprocessing model or software must be taken into account. In areas in which the tumor shows high vascular permeability (such as the peripheral zone), k trans values depend mainly on the flow, whereas in the center of the tumor (where permeability is the limiting factor) k trans values depend on the permeability surface. Interpretation difficulties arise from the lack of standardization.
The first-pass kinetics should mainly be analyzed ( Table 3 ). Malignant lesions usually show early rapid enhancement and higher slopes, although this pattern is not specific and benign lesions might show rapid arterial enhancement ( Fig. 7 ). The entire tumor should be evaluated in order to correlate the different components of the tumor tissue before and after treatment; mainly the presence of necrosis ( Fig. 8 ).
Related posts:
 Body Diffusion-weighted MR Imaging in Oncology
 Assessment of Tumor Angiogenesis
Clinical Imaging of Tumor Metabolism with 1H Magnetic Resonance Spectroscopy
Multiparametric MR Imaging in Abdominal Malignancies
Multiparametric MR Imaging of Breast Cancer
Role of Multiparametric MR Imaging in Malignancies of the Urogenital Tract
Assessment of Tumor Angiogenesis
Clinical Imaging of Tumor Metabolism with 1H Magnetic Resonance Spectroscopy
Multiparametric MR Imaging in Abdominal Malignancies
Multiparametric MR Imaging of Breast Cancer
Role of Multiparametric MR Imaging in Malignancies of the Urogenital Tract
Stay updated, free articles. Join our Telegram channel

Full access? Get Clinical Tree


