Six hundred fifty thousand asymptomatic patients with no known coronary artery disease (CAD) present with acute coronary events annually. These patients represent a grand failure of the current risk assessment system for CAD, which consists primarily of conventional cardiac risk factor assessment. Substantial evidence indicates that coronary artery calcium (CAC) scoring is the most powerful predictor of subclinical atherosclerosis today, and it is underused clinically in the United States. CAC scoring may be the key to preventing asymptomatic patients with subclinical CAD from experiencing coronary events.
Pathophysiology
CAC is pathognomonic for coronary artery atherosclerosis because atherosclerosis is the only vascular disease that causes calcification of coronary arteries. Atherogenesis begins with lipid accumulation, cell proliferation, and extracellular matrix synthesis. These atherosclerotic plaques are also associated with circulating proteins normally associated with bone remodeling, and the proteins are believed to regulate the accumulation of the hydroxyapatite form of calcium phosphate in these lesions.
Whether coronary arterial calcification is a result of the ongoing inflammation associated with plaque formation or an attempt to repair damage to the vascular wall is not known. Whether coronary artery calcification is a dynamic phenomenon, like the ongoing formation and degradation of bone tissue, is also unknown.
Rumberger et al demonstrated that the total area of CAC highly correlates in a linear fashion with the total area of coronary artery plaque on a segmental, individual, and whole coronary artery system basis ( Figs. 22-1 and 22-2 ). These investigators also demonstrated that CAC generally comprises approximately 20% of total plaque size.


Methodology
Technical Considerations
Until relatively recently, electron beam tomography (EBT) was the principal method for acquiring the images used for calcium scoring. In fact, most of the data substantiating the importance of calcium scoring were acquired through EBT. Multidetector computed tomography (MDCT) is a more recent, widely used development that will likely completely replace EBT for calcium scoring in the near future.
EBT uses a rotating electron beam (current, 630 mA; voltage, 130 kV) to acquire 50-ms x-ray images at 3-mm intervals by using prospective triggering in the space of a 30- to 40-second breath hold. The volume mode on EBT allows acquisition of a single image with each preselected movement of the patient table. Up to 40 continuous slices can be obtained by scanning 12 to 32 cm of anatomy, thus allowing adequate images for CAC scoring to be obtained.
MDCT uses a rotating gantry with a special x-ray tube and a variable number of detectors to acquire images while a patient advances through the machine on a moving table. MDCT is able to acquire 73- to 375-msec temporal resolution images in 0.5- to 3.0-mm intervals by using prospective triggering if the heart is steady and the rate is less than 60 beats/minute. To avoid coronary motion artifacts, image acquisition with temporal resolutions of less than 50 msec is needed because the right coronary artery exhibits translational motion of up to 60 mm/second. The left anterior descending and left circumflex arteries exhibit 20 to 40 mm/second of translational motion. Single source MDCT is therefore plagued by more motion artifacts than is EBT.
Radiation
The radiation exposure for each patient undergoing a calcium scan is approximately 1 mSv with either EBT or MDCT. Comparatively, mammograms, which are recommended annually for breast cancer screening in all women after the age of 40 years, cause approximately 0.6 mSv of radiation exposure.
Scoring
Multiple methods of calcium scoring are used. On EBT, CAC is defined as a lesion of at least two to three adjacent pixels in any of the three dimensions (effective pixel size, 0.68 to 1.02 mm 2 for a 512 × 512 reconstruction matrix and field of view size of 30 cm) greater than 130 Hounsfield units (HU) anywhere in the epicardial coronary system. On MDCT, calcified lesions are similarly defined, although the effective pixel size is 0.26 mm 2 with a typical field of view of approximately 26 cm.
Agatston et al originally determined a calcium score by the summation of the product of the calcified plaque area and a factor for maximum calcium density (1 for lesions with maximal density of 130 to 199 HU, 2 for 200 to 299 HU, 3 for 300 to 399 HU, 4 for >400 HU) in each lesion. Calcium scores are generally classified in as follows: 1 to 10, minimal; 11 to 100, mild; 101 to 400, moderate; and greater than 400, severe. The major weakness of the Agatston score is that it is reproducible only at approximately 20%. One reason for this limitation is that the calcium density score based on HU does not increase in a linear pattern, and small incremental differences in HU can result in nonlinear scoring differences.
The calcium volume score is a more reproducible measure of CAC score. The volume score is derived using an isotropic interpolation principle, and it represents a direct measurement of calcium volume in an atherosclerotic plaque (measured in picoliters). Unlike the Agatston score, the volume score accounts for pathophysiologic changes that are likely in a healing plaque. As volumetric contraction and loss of noncalcified contents on plaque occur, the Agatston score, with its dependence on density, could conceivably overestimate CAC in this situation. The volume score is not susceptible to this problem.
Two newer types of CAC scores are still being validated. The calcium mass score is calculated as the summation of the product of the volume and density of each voxel of each lesion. The calcium coverage score measures CAC score as a percentage of coronary artery segments that contain calcium.
The comparability of MDCT- and EBT-derived CAC scores has been well validated by several studies involving more than 400 patients. The most recent study between EBT and 64-slice MDCT demonstrated 99% interscan agreement for the presence of CAC. The linear relationship between the scores from the 2 scanners was significant, and the interscanner variability was not significantly different. Multiple studies further confirmed that 64-slice MDCT and EBT were comparable for both Agatston and volumetric CAC scanning.
Examples and Pitfalls
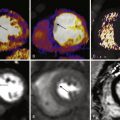
Sample images of CAC scans on 64-slice MDCT scanner are shown in Figures 22-3 to 22-5 .


The following common pitfalls can make CAC scoring challenging:
- 1.
Mitral annular calcification can often complicate CAC scoring in the left circumflex artery territory ( Fig. 22-6 ).

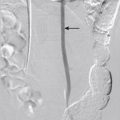
Figure 22-6
Mitral annular calcification (arrow) .
- 2.
A beam hardening artifact causes the edges of an object to appear brighter than the center. Calcium is particularly susceptible to this artifact, which can make CAC scoring difficult ( Fig. 22-7 ).

Figure 22-7
Beam hardening artifact (arrowhead) . The thick arrow points to aortic root calcium, and the thin arrow points to left main coronary artery calcium.
- 3.
Aortic root calcium can be mistaken for left main coronary artery calcium (see Fig. 22-7 ).
- 4.
Refusal to compute a CAC score on segments that include a stent is appropriate because the presence of a stent falsely increases the CAC score.
Epidemiology
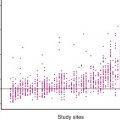
Figure 22-8 shows CAC score percentiles based on the age and gender of asymptomatic patients. These data are based on large databases of asymptomatic patients. This nomogram, albeit useful, does not take into account race.

The Multi-Ethnic Study of Atherosclerosis (MESA), a study of 6814 asymptomatic patients with 53% women and an average age of 62 years, revealed more specific data on CAC scores according to race. As expected, the MESA showed that men have greater CAC scores on average than women. Additionally, among men, whites and Hispanics were first and second, respectively, in terms of average CAC score. Black men had the lowest CAC scores at younger ages, whereas Chinese men had the lowest CAC scores at older ages ( Figs. 22-9 and 22-10 ).


In women, whites had the highest CAC scores. As in men, Chinese women had the lowest CAC scores in the oldest age groups.
The MESA demonstrated very strong CAC predictive value for all gender and ethnic groups. Additionally, younger patients with a family history of CAD had significantly higher CAC scores than did age-matched patients without this risk factor.
Review of the Literature
Guidelines
The main purpose of obtaining a CAC score is to detect subclinical atherosclerosis. In the 2010 American College of Cardiology/American Heart Association (ACC/AHA) guidelines for assessment of cardiovascular risk in asymptomatic patients, measurement of CAC score in asymptomatic patients at intermediate (10% to 20% 10-year risk based on Framingham risk score) risk to assess cardiovascular risk is a IIa recommendation (benefits substantially outweigh the potential risk; generally accepted as reasonable to perform the procedure or test). Measurement of CAC score in asymptomatic patients at low risk (<6% 10-year risk) is not recommended.
In the ACC/Society of Cardiovascular Computed Tomography/American College of Radiology/AHA/American Society of Nuclear Cardiology/Society for Cardiovascular Angiography and Interventions/Society for Cardiovascular Magnetic Resonance (ACC/SCCT/ACR/AHA/ASE/ASNC/SCAI/SCMR) 2010 appropriate use criteria for cardiac computed tomography, CAC scoring was deemed appropriate in asymptomatic patients with no known CAD who are at low risk if they have a family history of premature CAD. CAC scoring in asymptomatic patients with no history of CAD with intermediate risk was also deemed appropriate.
In the future, CAC scoring may be recommended in even low-risk patients. In a cohort of 222 young patients presenting with myocardial infarction (MI) as the first sign of CAD, Akosah et al showed that 70% were in lesser-risk categories. Schmermund et al and Pohle et al indicated that 95% of patients with acute MI would have been identified with a positive CAC score irrespective of age. Perhaps, in the future, as data accumulate on lower-risk patients, these patients will also be deemed appropriate for CAC scoring. In fact, the 2006 Screening for Heart Attack Prevention and Education (SHAPE) guidelines recommended CAC scoring (or carotid intima-media thickness [IMT]) in all but the very lowest-risk asymptomatic men more than 45 years old and women more than 55 years old, with treatment based on CAC score.
Finally, the 2010 American College of Cardiology Foundation (ACCF)/AHA guideline for assessment of cardiovascular risk in asymptomatic adults states that CAC scoring is reasonable for asymptomatic diabetic patients 40 years old and older (IIa recommendation). It further states that stress myocardial perfusion imaging may be considered in asymptomatic diabetic patients who are considered to be at high risk for CAD, including when the CAC score is greater than 400 (IIb recommendation).
Prognostic Value
The prognostic value of CAC scoring has been shown to be excellent in multiple, large studies. In 2000, Raggi et al elegantly demonstrated a graded annualized event rate in a cohort of 632 asymptomatic patients followed up for 32 months. Patients with 0 scores had an annualized event rate of 0.1%. Patients with scores of 1 to 99 had an event rate of 2.1%, those with scores of 100 to 400 had an event rate of 4.1%, and patients with scores higher than 400 had an annualized event rate of 4.8%. With all positive CAC scores having an annualized event rate of more than 2.0%, the risk associated with any positive CAC score exceeds the 2% annual event risk required for secondary prevention using the Framingham risk score.
Shaw et al subsequently showed that all-cause mortality increased proportionally to CAC score, even after adjustment for Framingham risk factors. In this retrospective study of 10,377 patients, Shaw et al also found that CAC scoring had superior area under the receiving operator characteristic (ROC) curves compared with Framingham risk assessment (0.73 versus 0.67; P < .001). Even more impressive, after patients were stratified according to their Framingham risk, CAC scores were able to further stratify risk in these patients accurately. This additional risk stratification was particularly strong in the group of patients with intermediate Framingham risk scores. Finally, Shaw et al also showed that the relative risk of death in patients with a CAC score of just 10 is comparable to the relative mortality risk of patients with diabetes, smoking, and hypertension (see Fig. 22-8 ).
In an asymptomatic cohort of 5635 patients Kondos et al showed that the relative risk for cardiac events with a positive CAC score is 10.5, compared with only 1.98 for diabetes and 1.4 for smoking. This finding is quite striking, especially considering that diabetes is considered a CAD equivalent.
The St. Francis Heart Study, a prospective study of 5585 predominantly moderate-risk to moderately high-risk asymptomatic patients, confirmed these various study results and showed an increasing event rate with increasing CAC scores. Additionally, CAC scores higher than 100 were associated with relative risks from 12 to 32 and were a secondary prevention equivalent with an event rate of more than 2% per year. Of the patients in this study who were classified as intermediate risk by Framingham risk scores, 67% were appropriately reclassified by using CAC tertiles, with outcomes confirmed by monitoring cardiac events in the study.
Prognostic Significance of Very High Scores
Extensive evidence confirms the prognostic significance of very high CAC scores. In a retrospective analysis of 25,203 patients, Budoff et al found that a CAC score higher than 400 was associated with a hazard ratio of 9.2. Additionally, Becker et al conducted a prospective study of 1724 patients and found that a CAC percentile of more than 75% versus 0% was associated with a hazard ratio of 6.8 in men and 7.9 in women. Becker et al also found that 82% of the patients in their cohort who developed MI or cardiac death were classified as high risk by their CAC percentile, compared with only 30% by Framingham risk scores. The area under the ROC curve for the CAC percentile (0.81) in this group was also significantly superior to that of Framingham scoring.
In the MESA, the National Heart, Lung, and Blood Institute sponsored a prospective trial of 6814 patients who were followed up for almost 4 years, and similar results were found. Patients with CAC scores of 101 to 300 had a hazard score of 7.73, whereas patients with CAC scores higher than 300 had a hazard score of 9.67 when compared with patients with no CAC ( P < .001). Among the 4 racial or ethnic groups (white, Chinese, Hispanic, black), doubling of the CAC score increased the risk of a coronary event by 18% to 39%. ROC curve areas were significantly higher when the CAC score was added to the Framingham risk score ( P < .001).
Prognostic Significance of Very Low Scores
Patients with 0 CAC scores may still have atherosclerosis in the form of noncalcified plaque, but their coronary event rates are very low. Raggi et al showed only a 0.11% annual event rate with a 1.1% 10-year risk in asymptomatic patients with 0 CAC scores. The MESA also showed a 0.11% annual event rate in asymptomatic patients without CAC, and the St. Francis Heart Study showed a 0.12% rate. A meta-analysis of 64,873 patients followed up over 4.2 years similarly showed a 0.13% annual event rate for patients with 0 CAC scores. In a cohort of more than 44,000 asymptomatic patients who were followed up for 5.6 years, Blaha et al showed that deaths per 1000 patient-years were 7.48 for patients with CAC scores higher than 10, 1.92 for those with CAC scores between 1 and 10, and 0.87 for those with a CAC score of 0.
Multiple studies have shown that only 5% of acute ischemic syndromes occur in patients with 0 CAC scores and exclusively noncalcified plaque. In their meta-analysis, Sarwar et al showed that only 2 of 183 (1.1%) patients with 0 CAC scores were ultimately diagnosed with acute coronary syndrome after they presented with acute chest pain, normal troponin values, and equivocal electrocardiographic findings. A CAC score higher than 0 had a 99% sensitivity, 57% specificity, 24% positive predictive value, and 99% negative predictive value for acute coronary syndrome.
Correlation with Obstructive Disease and Symptomatic Patients
The presence of CAC is essentially 100% specific for atherosclerosis. Pathologic specimens have shown that the amount of CAC only weakly correlates with the degree of luminal narrowing in the coronary arteries, but the likelihood of obstructive disease certainly increases with increasing CAC scores.
Clinically, Shavelle et al showed that a positive CAC score is 96% sensitive but only 47% specific for an obstructive lesion. This finding was compared with a 76% sensitivity and 60% specificity of treadmill testing for obstructive disease. Rumberger et al showed that higher calcium scores are more specific for obstructive disease, although the sensitivity decreases. Budoff et al later showed that CAC scores facilitated prediction of obstructive CAD when these scores were used collaboratively with age, gender, and risk factors. In the large meta-analysis by Sarwar et al, the cohort contained 10,355 symptomatic patients. This study found that positive CAC score was 98% sensitive and 40% specific for the presence of stenosis of more than 50% of luminal diameter. Additionally, the negative predictive value was 93%, whereas the positive predictive value was 68%.
Treatment
After CAC scoring, clinicians must make management decisions based on the results. According to prognostic data from the St. Francis Heart Study, a CAC score higher than 100 is a CAD equivalent. In this same study, CAC scores higher than 400 or higher than the 90th percentile were associated with a particularly high annual risk (4.8% and 6.5%), and these patients may be good candidates for more aggressive management.
Based on the AHA Prevention V Update and the most recent National Cholesterol Education Program recommendations, Hecht recommended that patients with 0 CAC scores should be treated as a low-risk Framingham equivalent. In addition, patients with CAC scores of 1 to 10 (as long as <75th percentile for age and gender) are at moderate risk, patients with CAC scores of 11 to 100 (as long as <75th percentile) are at moderately high risk, patients with CAC scores of 101 to 400 or higher than the 75th percentile are high risk and have a CAD equivalent, and those with CAC scores higher than 400 or higher than the 90th percentile are at the highest risk.
Numerous studies have reported that CAC scoring improves patient compliance with therapeutic interventions. In a study of 505 asymptomatic patients, Kalia et al showed that 3.6 years after visualizing their CAC scan, 90% of patients with CAC scores higher than 400 complied with their statin therapy, compared with 75% of patients with CAC scores of 100 to 399 and only 44% of patients with 0 CAC scores. Similarly, in a study of 980 asymptomatic patients, Orakzai et al showed that acetylsalicylic acid initiation, dietary changes, and exercise were much better in patients with CAC scores higher than 400 (61%, 67%, and 56%, respectively) than in patients with 0 CAC scores (29%, 34%, and 44%, respectively).
Symptomatic Patients
That symptomatic patients with CAC are also more likely to have events is well established. The National Institute for Health and Clinical Excellence (NICE) guidelines, developed by the National Clinical Guideline Centre for Acute and Chronic Conditions in the United Kingdom, recommended CAC scoring as the first diagnostic intervention in patients with chest pain without known CAD, who have a 10% to 29% likelihood of having CAD. The NICE guidelines further recommended finding noncardiac causes of chest pain in those patients whose CAC score is 0. If the CAC score is 1 to 400, computed tomography coronary angiography is recommended, and if the CAC score is higher than 400, then invasive angiography is recommended. In a meta-analysis of 3924 symptomatic patients with 3.5-year follow-up, patients with a positive CAC score had an event rate of 2.6% per year compared with only 0.5% per year in patients with no CAC.
In a cohort of 1031 patients who presented to the emergency department with chest pain and who had a nonischemic electrocardiogram, normal initial troponin values, and no history of CAD, Nabi et al showed that a CAC score of 0 predicted a normal nuclear stress test result and an excellent short-term outcome. In a cohort of 118 patients, La Mont et al showed that the absence of CAC in patients with false-positive treadmill stress test results had a negative predictive value of 90%. This finding suggests that CAC scoring could potentially be used to rule out CAD in low-probability patients with abnormal stress test results.
Despite these guidelines and studies, the practice of using calcium scoring in the workup of symptomatic patients is not part of the recommended algorithm in the United States.
Additional Applications
Raggi et al showed that diabetic patients with no CAC have the same prognosis as do patients without diabetes. Based on this finding, not treating these patients as having a CAD risk equivalent may be a reasonable approach.
Budoff et al showed that the presence of CAC in 120 patients with heart failure of unknown origin was 99% sensitive to the presence of ischemic cardiomyopathy.
Comparison With Other Biomarkers
CAC scoring has clearly been shown to be superior for predicting outcomes compared with conventional risk factors. Multiple studies in large groups of patients, however, have shown a clear association between CAC score and conventional risk factors, including premature family history of CAD, diabetes, and lipid values. Even so, Hecht et al showed that conventional risk factors do not always correlate with CAC score in individual patients. In a cohort of 930 patients, Hecht et al showed a significant correlation between increasing CAC scores with increasing low-density lipoprotein cholesterol (LDL-C) and decreasing high-density lipoprotein cholesterol (HDL-C), although a lack of correlation was noted in individual patients in this cohort between CAC percentile and levels of LDL-C, HDL-C, triglyceride, and homocysteine. Hecht et al showed that individual patients are certainly missed during screening for CAD with conventional risk factors and related biomarkers.
Individual groups of patients are particularly susceptible to inaccurate conventional risk analysis. Hecht and Superko showed that total cholesterol, LDL-C, and triglyceride levels were not higher in women more than 55 years old with positive CAC scores than in those with 0 CAC scores. This finding shows that risk in postmenopausal women is particularly difficult to stratify using conventional risk factors.
Taylor et al showed that conventional risk factors underestimated CAD in 630 active duty U.S. Army personnel 39 to 45 years old. This finding showed that conventional risk analysis is also a problem in this young, low-risk screening cohort.
Given the suboptimal relationship between lipid values and subclinical CAD, extensive efforts are being made to identify stronger markers for subclinical CAD. CAC scoring compares favorably with these other markers.
CAC scoring is superior to high-sensitivity C-reactive protein (hs-CRP) in predicting cardiac events. In 967 asymptomatic patients, Park et al showed that low to high CAC at any hs-CRP level increased the relative risk of MI or cardiac death fourfold to fivefold after adjustment for conventional risk factors. Low to high hs-CRP at any level of CAC, conversely, increased the relative risk by only 0.25-fold to 0.7-fold. After multivariate analysis, Park et al also showed that CAC score is significantly predictive of cardiac events ( P < .005), whereas hs-CRP is not ( P = .09), with or without adjustment for CAC score.
In the Study of Inherited Risk of Coronary Atherosclerosis, Reilly et al showed no significant relationship between hs-CRP and CAC score. The Dallas Heart Study had similar results. Additionally, in the St. Francis Heart Study, only the CAC score significantly predicted cardiac events ( P < .0001) in a multivariate analysis including standard risk factors, hs-CRP, and baseline CAC score. The hs-CRP value did not predict events independent of CAC score ( P = .47).
Additionally, CAC was more predictive of coronary disease than was carotid IMT because the hazard ratios per each standard deviation increment increased 2.5-fold for CAC (95% confidence interval [CI], 2.1 to 3.1), but only 1.1-fold for IMT (95% CI, 1.0 to 1.4).
Although atherosclerosis undeniably has metabolic and inflammatory components, thus making lipids and hs-CRP worthy considerations for screening measurements, it also probably has a genetic component that is missed by today’s screening blood tests. This is why screening with imaging is so important.
Coronary Artery Calcium Progression
Statins and Lipids
Researchers are currently exploring the utility of following CAC progression over time. They are also exploring CAC progression to help further understand the pathophysiology of CAD.
Numerous animal studies have analyzed CAC progression. In 2000, Stary published a study of 59 rhesus monkeys. These monkeys were fed high-cholesterol diets for several years, followed by a cholesterol-restricted diet. The monkeys were sacrificed at various time points in this experiment. Stary found that when these monkeys were fed cholesterol-rich diets, lipid-rich plaques developed with scattered calcific granules. As plaques expanded, more calcifications became visible. After 3 years of the cholesterol-restricted diet, however, the plaques became less lipid rich and more fibrotic, and the calcium burden remained unchanged.
In a study of 32 adult male cynomolgus monkeys initially fed an atherogenic diet, Williams et al further showed that pravastatin treatment led to a reduction in intimal neovascularization, diminished plaque macrophage infiltration, and a decrease in calcification of both early and advanced plaques. This study showed that statins not only may help lower LDL-C levels, but also may benefit existing plaques.
In similar studies, Daoud et al and Clarkson et al did not find a reduction in coronary artery plaque calcium deposition with intervention in either pigs or monkeys. These findings are a reminder that much more histologic work remains to be done in the field of CAC progression and CAC regression.
Studies have demonstrated that luminal stenosis improvements seen on quantitative invasive angiography result in cardiovascular event reduction, even with the minimal stenosis regression usually seen with medical therapy. Similar studies have been pursued to determine whether CAC regression or progression results in a predictable change in the cardiovascular event rate. Of course, these studies cannot strictly be compared with invasive angiography stenosis change because most of the patients undergoing invasive angiography are symptomatic, unlike most of the patients undergoing CAC scoring.
In 1998, Callister et al conducted an observational study of 149 asymptomatic patients with sequential CAC scans 12 to 15 months apart. The patients included in the cohort required a volume score higher than 30 to maximize reproducibility of the CAC scores. Forty-four of these patients did not receive statin therapy. These patients (mean LDL-C, 147 mg/dL, with standard deviation of 22 mg/dL) averaged CAC score progression of 52 ± 36% per year. Among the treated patients, 65 achieved an LDL-C level lower than 120 mg/dL. These patients showed a net regression of calcium volume score of −7 ± 22% per year. In those patients treated with statin therapy but with an LDL-C level higher than 120 mg/dL, the mean yearly calcium volume score progression was 25 ± 22%. All intergroup comparisons were statistically significant ( P < .0001). This study suggested that the aggressiveness of LDL-C treatment correlates with atherosclerotic plaque change, which can be monitored with CAC scoring.
Budoff et al later showed that statin treatment in 299 asymptomatic patients followed up with sequential CAC scans for 1 to 6.5 years was beneficial. Statin therapy resulted in significant slowing of CAC progression when compared with untreated patients (15 ± 8% per year with treatment versus 39 ± 12% per year without treatment).
In a subsequent prospective study, Achenbach et al studied 66 asymptomatic patients. The patients had known CAC and LDL-C levels higher than 130 mg/dL at baseline. The patients were left untreated for 14 months and had repeat CAC scans. The patients were then started on statin therapy, and repeat CAC scans were obtained 12 months later. The median calcium volume score increase during the drug-free period was 25% during the untreated year, but it slowed to 8.8% during the treatment year ( P < .0001). The 32 patients who achieved an average LDL-C level lower than 100 mg/dL actually achieved median calcium volume regression (−3.4%), whereas these same patients progressed 27% during the untreated year ( P = .0001). This finding provided more evidence of the effectiveness of aggressive LDL-C reduction.
In a subanalysis of the Women’s Health Initiative, Hsia et al studied 914 postmenopausal women. This group found that women with lower scores at baseline had smaller annual increases in CAC score; CAC scores increased 11, 31, and 79 units per year among women with baseline CAC scores in the lowest, middle, and highest tertiles, respectively. Hsia et al also found that age was not an independent predictor of CAC progression. Statin use at baseline was a negative predictor ( P = .015), and baseline score was a strong positive predictor ( P < .0001).
Despite all these favorable results, larger prospective studies failed to confirm an association between LDL-C reduction and CAC progression. The Beyond Endorsed Lipid Lowering with EBT Scanning trial was a randomized study of 615 postmenopausal, dyslipidemic women with sequential EBT CAC scans. The patients were randomized to either atorvastatin (80 mg/day) or pravastatin (40 mg/day). Although atorvastatin achieved better LDL-C levels (94 mg/dL) than pravastatin (129 mg/dL), no significant difference in CAC progression was noted between the 2 groups. The St. Francis Heart Study was also a prospective, randomized study of 1005 healthy patients with CAC scores higher than the 80th percentile for age and sex. The study compared atorvastatin (20 mg/day) with vitamin C and E supplementation versus placebo, and progression was similar (~20% per year) between the 2 treatment arms of the trial on follow-up (mean follow-up 4.3 years).
Other Studies of Coronary Artery Calcium Progression
Although the foregoing large studies did not show that lipid-lowering therapy slowed CAC progression, other interesting studies have been done on various therapies and their impact on CAC changes. In 109 patients with type 1 diabetes (22 to 50 years old) who had sequential EBT scans 2.7 years apart, Snell-Bergeon et al showed that CAC progression was associated with hyperglycemia (odds ratio, 7.11; 95% CI, 1.38 to 36.6; P = .02).
In the Women’s Health Initiative, postmenopausal women in their 50s were randomized to treatment with estrogen or placebo. In a substudy of this group, 1064 of these patients underwent CAC scans after 8.7 years of being enrolled in the trial. Patients receiving estrogen had a significantly reduced CAC score compared with patients receiving placebo (83.1 versus 123.1; P = .02).
In a placebo-controlled, randomized, double-blind pilot study of 23 patients, Budoff et al showed that aged garlic extract slowed CAC progression. The 23 patients in this study were randomized to garlic or placebo and underwent sequential CAC scans 1 year apart. The group taking garlic had significantly lower CAC volume progression than did the group receiving placebo (7.5 versus 18.5; P = .046), with no significant differences in lipid values or CRP in the 2 groups.
Garlic has been shown to reduce cardiovascular risk factors by reducing blood pressure, cholesterol, and platelet function while stimulating endothelial cells to produce nitric oxide. In 2009, Budoff et al showed that aged garlic extract with supplements decreased total cholesterol, LDL-C, homocysteine, immunoglobulin G and immunoglobulin M autoantibodies to malondialdehyde-modified LDL-C, and apolipoprotein B–immune complexes. The group also showed that garlic increased HDL-C, lipoprotein (a), and temperature rebound (a marker of vascular function), as well as slowed calcium progression. All these findings were significant compared with placebo in this placebo-controlled, double-blind, randomized trial of 65 intermediate-risk patients. In this same trial, Budoff et al also showed that garlic significantly increased oxidized phospholipids on apolipoprotein B-100. In an interesting follow-up, Ahmadi et al showed that increased oxidized phospholipids on apolipoprotein B-100 correlated strongly with increases in vascular function and predicted a lack of CAC progression in the same cohort. In a more recent analysis of this cohort, Larijani et al showed a significant decrease in carotid-radial pulse wave velocity (marker correlating with decreased vascular stiffness) in the group taking aged garlic extract with supplement.
Nanobacteria have been implicated as a trigger for the initiation of CAC and atherosclerosis. In contrast, ethylenediaminetetraacetic acid (EDTA) disodium salt has been theorized to remove calcium from soft tissue deposits. Maniscalco et al conducted an interesting study in which 77 volunteers with stable CAD were given therapy composed of EDTA, tetracyclines, coenzyme Q10, and vitamins. This therapy reduced lipid levels in many of these patients, most of whom were already receiving statin therapy. Additionally, 44 of the patients showed CAC regression in CAC scans performed 4 months apart.
End-stage renal disease results in cardiovascular disease rates much higher than those in the general population. Calcium-based phosphate-binding therapy for hyperphosphatemia in these patients has been implicated in the development and progression of arterial and valvular calcification. In the Treat-to-Goal study, 200 patients who had received hemodialysis for at least 3 years before study entry were randomized to sevelamer, a calcium-free nonabsorbable polymer or the traditional calcium-based phosphate binders to control hyperphosphatemia. During the study period, serum phosphorus levels were maintained between 3 and 5 mg/dL, serum calcium levels were between 8.5 and 10.5 mg/dL, and serum parathyroid hormone levels were between 150 and 300 pg/mL. CAC scans were obtained at baseline and at 1-year follow-up. Both groups had CAC score progression, but no significant difference was noted between the groups. The group taking sevelamer had a significantly lower mean LDL-C level compared with the group taking calcium-based phosphate binders, even though the latter group received statins more frequently. CAC progression between the group taking sevelamer and the group taking calcium-based phosphate binders was similar when adjusted for LDL-C.
Block et al subsequently conducted a similar trial, but had very different results. At the end of 18 months follow-up, the group taking calcium-based phosphate binders had an 11-fold greater CAC progression than did the group taking sevelamer ( P < .002). Additionally, after 4.5 years, the sevelamer group had significantly lower mortality (hazard ratio, 2.2; P < .02).
More recently, the Calcium Acetate Renagel Evaluation-2 (CARE-2) study failed to show a difference between sevelamer and the calcium-based phosphate binders. The investigators found that CAC progression was similar in both groups. This study was poor, however, because parathyroid hormone levels for the treated patients were double those of patients in earlier studies and suggested inadequate control of mineral metabolism.
Prognostic Value of Coronary Artery Calcium Progression
A few studies have investigated the clinical implications of CAC progression. Raggi et al followed 817 asymptomatic patients who were referred for sequential CAC scores at an average interval of 2.2 ± 1.3 years. The use of statin therapy in these patients was at the discretion of the treating physicians. Several years after the sequential CAC scans, telephone interviews were conducted to determine the occurrence of MI in these patients, among other end points. The mean yearly CAC volume score change for those patients who subsequently suffered an MI was 47 ± 50%, but it was only 26 ± 32% for those who did not ( P < .001). Both treatment of hyperlipidemia (likely secondary to greater baseline risk) and CAC progression were independent predictors of events.
Raggi et al did another observational study on 495 asymptomatic patients with sequential CAC scans followed for a median 3 years. The 41 patients in this group who had an MI had significantly higher CAC score progression compared with the event-free group (42 ± 23 versus 17 ± 25%; P < .001). The subjects who had MIs also had an average relative CAC score increase of more than 15%, which has been identified as the cutoff for true score change, as opposed to a measurement reproducibility error. Both groups had identical average LDL-C levels (~120 mg/dL). In a multivariable model, the best predictors of yearly CAC increase of more than 15% were smoking ( P = .032), male gender ( P = .014), and baseline CAC score ( P = .02).
In the St. Francis Heart study, 4613 patients had CAC scores determined 2 years apart. The median absolute CAC score increase was 4 in patients who did not suffer from cardiac events during follow-up, but it was 247 for those with events ( P < .0001). A 2-year change in CAC score was significantly associated with the risk of cardiovascular events ( P < .0001).
More recently, in 4609 asymptomatic patients, Budoff et al showed that CAC progression added incremental value in predicting all-cause mortality over baseline score, time between scans, demographics, and cardiac risk factors.
The clinical implications of CAC progression have been demonstrated to be significant in observational studies, and standard therapies have shown variable utility in slowing CAC score progression. Whether sequential CAC scoring should be recommended in clinical practice remains controversial.
Related posts:

Stay updated, free articles. Join our Telegram channel

Full access? Get Clinical Tree


