Age-associated changes
Plausible mechanisms
Possible relation to human disease
Vascular structural remodeling
⇑ Vascular intimal thickness
⇑ Migration of leucocytes matrix production by VSMC
Promotes development of atherosclerosis
Possible derivation of intimal cells from other sources
⇑ Vascular stiffness
Elastin fragmentation
Systolic hypertension
⇑ Elastase activity
Left ventricular wall thickening
⇑ Collagen production by VSMC and ⇑ cross-linking of collagen
Stroke
Altered growth factor regulation/tissue repair mechanisms
Atherosclerosis
Left ventricular hypertrophy
Vascular functional changes
Altered regulation of vascular tone
⇓ NO production/effects
Vascular stiffening; hypertension
Early atherosclerosis
Reduced physical activity
Learned lifestyle
Exaggerated age changes in some aspects of vascular structure and function, e.g., arterial stiffening
Frailty
Negative impact on atherosclerotic vascular disease, hypertension, and heart failure
Several studies have shown that the amount of calcification within the vascular system correlates with advanced age. Different entities of cardiovascular calcification can be distinguished: atherosclerotic calcification, medial artery calcification, cardiac valve calcification, and vascular calciphylaxis. Except for the vascular calciphylaxis, which is caused by excessive calcium phosphate levels in end-stage renal disease, all forms of calcifications are more often seen in older patients. Despite minor differences in the molecular pathways of calcification, active osteochondrogenic gene regulatory programs (osteogenic bone morphogenetic protein, Wnt signaling cascade) are present in virtually all types of vascular calcification. Often complete ossification occurs with bone-like structures (Johnson et al. 2006; Towler and Demer 2011).
These changes basically apply to all large- and medium-sized arteries, but an important difference with coronary perfusion compared to other arteries is the coronary flow reserve. The coronary arteries have a very high resting resistance, which gives them the ability to dilate their lumen under higher myocardial oxygen demands and increase the blood flow up to six times compared to the resting perfusion. In other words, impaired coronary dilation capacity affects significantly the ability of the heart to adapt to states of higher myocardial stress (Czernin et al. 1993). It has been shown that coronary flow reserve decreases with age (Lakatta and Levy 2003b; Botvinick et al. 2007). Another characteristic of coronary arteries is that they are not likely to develop medial artery calcification. Thus, the main cause for calcium deposition remains atherosclerotic lesions (Micheletti et al. 2008).
Many of the changes that we see within this aging process of arteries are similar to the pathogenesis of early atherosclerotic disease, and age itself is considered to be a key risk factor for atherosclerotic disease (Lakatta 2008). Today, several questions regarding cardiovascular aging remain unanswered. The most interesting one is: Where is the distinction between illness and physiological changes? How can we identify patients at risk of developing atherosclerosis? Is “successful” cardiovascular aging just a minor and more benign form of atherosclerosis? One important issue, as highlighted by Najjar et al. (2005), will be to improve and standardize the noninvasive measurement of arterial aging in humans to develop standard treatment guidelines.
10.2 Coronary Artery Disease
10.2.1 Epidemiology and Economic Impact
Cardiovascular disease is the leading cause of death in developed countries, in which coronary artery disease (or coronary heart disease) accounts for almost 50 % of all deaths, followed by stroke with around 17 % and heart failure with around 7 % (Fig. 10.1). In recent epidemiological studies, coronary artery disease had a prevalence of around 7 % in all adults over 20 years of age and an incidence of 785,000 new and 470,000 recurrent coronary events per year in America. It is a disease of the older population, and prevalence and incidence increase with age. With the current demographic changes in the world, shifting the aging society toward a population of the old and very old, the disease will become even more relevant in the future. It is estimated that over the next 20 years, the prevalence of cardiovascular disease will increase by 10 %.
Fig. 10.1
Percentage breakdown of deaths due to cardiovascular disease (United States: 2007) (Source: National Heart, Lung, and Blood Institute from National Center for Health Statistics reports and data sets. Total may not add to 100 because of rounding. Reprinted with permission from Roger et al. 2011)
In 2007, one out of every six deaths in the United States was caused by coronary artery disease. With direct and indirect costs of estimated 177 billion dollars per year in the United States, coronary artery disease is the most costly disease in the health-care system (Roger et al. 2011).
10.2.2 Pathophysiology
The National Institutes of Health (NIH) define coronary artery disease as a narrowing of the blood vessels that supply blood and oxygen to the heart (Chen and Zieve 2011). The most common cause is atherosclerosis of epicardial coronary arteries, leading to reduction of myocardial blood flow. This happens through asymmetric remodeling of the artery wall, leading to stenosis and/or the formation of a thrombus on top of a ruptured atherosclerotic plaque, the latter being regarded as the key mechanism of acute coronary syndrome and sudden cardiac death (Maseri 1997).
The first step in the process of atherosclerosis, which usually takes decades, is the infiltration and retention of lipoproteins in the arterial intima. High plasma levels of low-density lipoproteins (LDL) promote the trapping of these particles in the extracellular matrix of lesion-prone sites. In this environment, the lipoproteins undergo oxidative modification (Hansson 2005). This happens either spontaneously or by enzymatic reactions through resident macrophages. Subsequently, endothelial cells are activated and increase the expression of adhesion molecules (e.g., vascular cell adhesion molecule, E-selectin, macrophage chemotactic protein 1). Leucocytes enter through adherence and diapedesis into the subendothelial space. Monocytes differentiate into tissue macrophages and express scavenger receptors. Those receptors are capable of internalizing a broad range of molecules, like bacterial endotoxins, cell fragments, and oxidized LDL particles. Especially lipids (i.e., esterified cholesterol) accumulate in the cytoplasm of macrophages, which are then referred to as foam cells. This activation of macrophages, which is now a chronic inflammatory process, is enhanced by cytokines like interleukin-1, tumor necrosis factor alpha, macrophage chemotactic protein 1, macrophage colony-stimulating factor, and platelet-derived growth factor. These macrophages interact with T cells, enhancing the cytokine and growth factor production even more (i.e., fibroblast growth factor, transforming growth factor beta, platelet-derived growth factor), which promotes the migration and proliferation of smooth muscle cells (Rosenfeld 2000). The formation of a fibrous cap is the crucial step that turns a fatty streak into an atheroma. In this transition, smooth muscle cells migrate from the media to the intima and produce large amounts of extracellular matrix in order to stabilize the lesion and prevent more lipoprotein particles from entering the vessel wall. The thickness and integrity of the fibrous cap is a predictor of the vulnerability of the lesion. With progression of the disease, a lipid-rich core, with necrotic and apoptotic cellular debris, forms the center of the atheroma. Lipid-laden foam cells perish or experience programmed cell death through mediators like tumor necrosis factor alpha, Fas ligand, and oxidized lipids (Glass and Witztum 2001). The lipid-rich necrotic core contains extracellular lipids, calcifications, and cell fragments, and its enlargement causes destabilization of the fibrous cap. Another factor that compromises the fibrous cap is the degradation of the extracellular matrix by matrix metalloproteinases secreted by macrophages (Glass and Witztum 2001). This process occurs predominantly in the shoulder region of the plaque. If the destabilization continues, the fibrous cap is more likely to rupture. A rupture exposes highly thrombogenic subendothelial tissue, which triggers platelets and clotting factors of the blood to form a thrombus. Infarction occurs when this occlusion critically reduces the blood flow in the subsequent tissue.
Many atherosclerotic lesions, especially more advanced ones, contain calcification. The expression of bone-related proteins as well as histologically visible calcification is detectable in atheromas with a lipid-rich necrotic core. Enchondral ossification via formation of cartilage followed by osteoblast induction has been shown to be the mechanism of calcification in atherosclerosis (Johnson et al. 2006). Whether calcification in general is a factor in vulnerable lesions is controversial. It seems that the amount of calcium and its localization are important criteria in that matter. Superficial calcified nodules are associated with an increased risk of plaque rupture (Virmani et al. 1998; Naghavi et al. 2003). Deep, concentric medial calcification on the other hand has been reported to be a feature of more stable plaques (Ge et al. 1999). However, it has been shown that the amount of calcification correlates with the overall burden of disease. Thus, patients who have calcified plaques are also more likely to have noncalcified or “soft” plaques that are prone to rupture and acute coronary thrombosis (Greenland et al. 2007).
The cause of atherosclerotic lesions varies and several factors determine their vulnerability. Common concepts of vulnerability, like degree of stenosis, might not suffice and need to be extended. Furthermore, there are significant differences in the temporal development and progression of lesions in different patients. Some lesions are more stable than others. We have already discussed how some lesions turn into highly fibrosed and/or calcified plaques that are not associated with a significant increase in cardiovascular events (e.g., myocardial infarction). The next chapter describes risk factors of atherosclerosis in general and features of atherosclerotic lesions that are associated with increased risk of cardiovascular events.
10.2.3 Concepts of Risk Stratification
Several large epidemiological studies (e.g., the Framingham study Kagan et al. 1962) have revealed risk factors that are associated with cardiovascular disease (CVD) (Kannel et al. 1964; Kannel et al. 1968; Dawber and Kannel 1972). Today many genetic and environmental factors that promote atherosclerosis are known and research in the field is ongoing. Table 10.2 shows some of the most common risk factors for CAD (Lusis 2000; Expert Panel on Detection, Evaluation, and Treatment of High Blood Cholesterol in Adults 2001). The identification of these risk factors has helped in the prevention of CVD in the general population (i.e., antismoking campaigns, treatment of hypertension or hyperlipidemia) and has led to declining death rates from CAD (Roger et al. 2011). However, the high prevalence of traditional risk factors (e.g., LDL cholesterol) in persons without atherosclerosis makes the risk factors alone only poor predictors for individual CAD risk (Castelli 1996). Furthermore, having multiple risk factors increases the risk for acute myocardial infarction significantly (Fig. 10.2). Studies showed that typical CAD risk factors are capable of explaining more than 90 % of the overall risk for acute myocardial infarction (Yusuf et al. 2004). Therefore, multivariate scores (the Framingham risk score and SCORE, for systematic coronary risk evaluation) have been developed to attribute an individual short-term risk (10 years) for CAD events (i.e., angina pectoris, coronary insufficiency, myocardial infarction, and coronary death). The Framingham risk score defines three risk categories (low-, intermediate-, and high-risk patients), each with different implications for treatment. These scoring systems do improve the individual risk evaluation (e.g., different values for men and women) but are far from a universal tool for CAD risk assessment. Studies showed that they are suboptimal for young patients and non-Caucasians and they focus only on short-term events and not on lifetime events (Akosah et al. 2003; Liu et al. 2004). Furthermore, many of the risk factors are CAD markers that have been known for more than 60 years. In other words, current scoring concepts neglect newer CAD markers and tools that can identify asymptomatic atherosclerosis.
Table 10.2
Risk factors for coronary artery disease (CAD)
Risk factors for CAD |
Gender |
Below age 60, men develop CAD at more than twice the rate of women |
Age |
Men ≥45 years; women ≥55 years |
Cigarette smoking |
Hypertension |
BP ≥140/90 mmHg or on antihypertensive medication |
Low HDL cholesterol |
<40 mg/dL |
High LDL/VLDL cholesterol |
>100 mg/dL |
Lipoprotein a |
Homocysteine |
Diabetes mellitus |
Family history for CAD |
CAD in male first-degree relative ≤55 years |
CAD in female first-degree relative ≤65 years |
Obesity |
BMI ≥30 kg/m2 or waist circumference |
Men >102 cm (40 in) |
Women >88 cm (35 in) |
Lack of exercise |
High fat diet |
Fig. 10.2
Risk of acute myocardial infarction associated with exposure to multiple risk factors. Smk smoking, DM diabetes mellitus, HTN hypertension, Obes abdominal obesity, PS psychosocial, RF risk factors. Note the doubling scale on the y axis. The odds ratios are based on current never smoking, top lowest tertile for abdominal obesity, and top lowest quintile for apolipoproteins (ApoB/ApoA1) (Reprinted with permission from Yusuf et al. 2004)
The above-mentioned risk assessment is population-based and a good tool to predict the presence of CVD in individuals. However, absence of risk factors does not necessarily translate into absence of disease and predictions about the individual prognosis of the disease can hardly be made. It has been shown that the sensitivity of the scores for patients with asymptomatic CVD is low. “Low risk” does not mean “no risk,” and according to recent National Health and Nutrition Examination Survey data, among healthy adults aged 20–79 years, 85 % had low-risk Framingham scores, while only 2 % had high-risk scores. Low-risk individuals were responsible for approximately two-thirds of the overall population risk (Lauer 2007). This emphasizes the importance of improving the conventional risk scores, so that the risk of each individual could be determined.
Diagnostic imaging techniques have been most promising in the assessment of atherosclerosis and show a high potential for individual risk evaluation. They can be used to look at morphological, functional, and molecular characteristics of atherosclerotic lesions. One generally accepted approach is the concept of the vulnerable plaque (Naghavi et al. 2003). The crucial mechanism for acute myocardial infarction and sudden cardiac death is the rupture of an atherosclerotic plaque. Most patients with acute myocardial infarction do not have severely stenosed arteries prior to the infarction. Figure 10.3 is from a review by Falk et al. (1995) where 68 % of patients with acute myocardial infarction had a stenosis diameter in the affected artery of less than 50 % before the plaque rupture occurred. A recent study by Stone et al. (2011) showed that previously untreated coronary segments that lead to cardiovascular events had a mean stenosis diameter of approximately 32 %, as detected by intravascular ultrasound. The fact that degree of stenosis alone is only a poor predictor for cardiovascular events shows that an integrated model of morphology and disease activity is needed. Table 10.3 shows the criteria that define an atherosclerotic lesion as vulnerable (Naghavi et al. 2003). All the listed criteria are associated with increased risk of plaque rupture and cardiovascular events and reflect morphologic aspects as well as molecular pathophysiology. Most of these criteria were derived from autopsy studies of patients with CAD. Invasive and noninvasive imaging techniques are capable of investigating features of vulnerable lesions in vivo. It is important to note that no imaging modality is ideal for looking at CAD; each has its advantages and limitations.
Fig. 10.3
Bar graphs showing stenosis severity and associated risk of coronary occlusion and myocardial infarction as evaluated by serial angiographic examination. Myocardial infarction evolves most frequently from plaques that are only mildly to moderately obstructive months to years before infarction. The bar graphs are constructed from data published by Ambrose et al., Little et al., Nobuyoshi et al., and Giroud et al. (Reprinted with permission from Falk et al. 1995)
Table 10.3
Criteria for defining vulnerable plaque, based on the study of culprit plaques
Major criteria |
Active inflammation (monocyte/macrophage and sometimes T-cell infiltration) |
Thin cap with large lipid core |
Endothelial denudation with superficial platelet aggregation |
Fissured plaque |
Stenosis >90% |
Minor criteria |
Superficial calcified nodule |
Glistening yellow |
Intraplaque hemorrhage |
Endothelial dysfunction |
Outward (positive) remodeling |
10.3 Diagnostic Imaging of the Coronary Arteries
10.3.1 Invasive Techniques
10.3.1.1 Conventional Coronary Angiography
Conventional coronary angiography (CCA) can be diagnostic as well as therapeutic. This short review focuses on CCA as a diagnostic tool and will not address interventional features like balloon dilatation or stent implantation. CCA is an invasive imaging method in use for over 50 years (Sones and Shirey 1962) and is still standard in the management of patients with acute coronary syndrome, medical refractory stable angina, high-risk CVD patients, and unexplained heart failure. CCA uses an iodine contrast agent that is infused over a catheter from a large artery (i.e., femoral artery, brachial artery) into the left and right coronary ostium at the aortic root to create a 2D image of the vessel system. With a resolution of 0.2 mm, it is the “gold standard” for evaluation of the coronary artery lumen. Figure 10.4 shows CCA images of a normal left and right coronary artery tree (Fayad et al. 2002). It is most sensitive for the detection of advanced stenosis. Coronary artery lesions can be described by location, by severity (e.g., stenosis in % or according to the thrombolysis in myocardial infarction study (TIMI) classification), and by morphology (e.g., Ambrose’s classification (Ambrose et al. 1985)). To determine the degree of stenosis, the lumen narrowing at the site of a lesion is compared to an adjacent normal artery diameter. It is essential to view the coronary vessels in at least two different planes (e.g., right anterior oblique view, LAO = left anterior oblique view) as eccentric stenosis might be missed in only one 2D projection (Scanlon et al. 1999). If the analysis is performed by computer software, the term quantitative coronary angiography is used (Fig. 10.5) (Budoff et al. 2008). Hemodynamically relevant stenosis is defined as >50 %. Patients with chest pain often show more than one vessel with significant CAD changes on CCA (Fig. 10.6) (Mohlenkamp et al. 2007). An increased cardiovascular risk profile of patients with chest pain correlates with the likelihood of a 3-vessel CAD (Sandhu et al. 2007; Rubinshtein et al. 2007). The positive findings in CCA have a high predictive value for CAD. However, a normal coronary angiogram does not rule out CAD (Roberts and Jones 1979; Vlodaver et al. 1973).
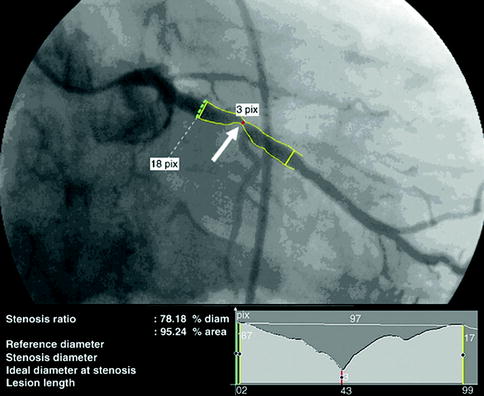
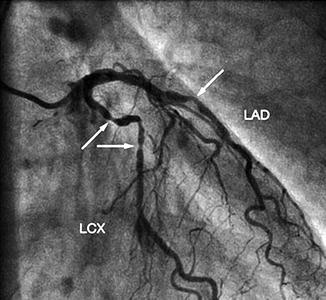
Fig. 10.4
X-ray angiography of the coronary arteries. (a) RAO right anterior oblique view of the left coronary artery. (b) LAO left anterior oblique view of the left coronary artery. (c) RAO right anterior oblique view of the right coronary artery. DB diagonal branch, LCx left circumflex, OM obtuse marginal, RCA right coronary artery, RVD right ventricular diagonal, PDA posterior descending artery (Reprinted with permission from Fayad et al. 2002)
Fig. 10.5
CT angiogram demonstrating obstructive disease of the left circumflex artery with quantitative angiography correlation: right anterior oblique orientation of the left circumflex artery with quantitative coronary angiography (Reprinted with permission from Budoff et al. 2008)
Fig. 10.6
Conventional coronary angiogram demonstrating significant lumen reduction in the mid-left anterior descending and mid-left circumflex (arrows) (Reprinted with permission from Möhlenkamp et al. 2007)
It has been shown that CCA is capable of identifying plaque rupture, which is an essential feature of culprit lesions. A study comparing CCA with angioscopy showed that especially complex lesions (eccentric, irregular contour, thrombus/ulcer present) indicate plaque rupture (Waxman et al. 2003). Another study in 65 patients with acute coronary syndrome (ACS) used IVUS as gold standard for detection of plaque rupture and showed that CCA has good specificity (97 %) but low sensitivity (40 %) for plaque rupture. The positive and negative predictive values for correct angiographic diagnosis of plaque rupture were 96 and 61 %, respectively (Gilard et al. 2008). Current guidelines recommend IVUS for lesions of uncertain severity (Scanlon et al. 1999).
One advantage of cardiac catheterization is that dynamic pressure and flow measurements can be obtained (e.g., coronary flow reserve, fractional flow reserve). The additional parameters provide information about vasoreactivity and severity of perfusion impairment (Kern et al. 2006). Relative contraindications for CCA include symptomatic heart failure, uncontrolled hypertension, refractory arrhythmia, severe contrast medium allergy, pregnancy, severe renal failure, or coagulopathy. It is an invasive procedure and bears the risk of vascular complication, myocardial infarction, arrhythmia, or perforation of the heart chamber. The overall mortality is 0.11 % (Scanlon et al. 1999).
10.3.1.2 Intravascular Ultrasound
Another invasive imaging technique for the evaluation of coronary atherosclerosis is intravascular ultrasound (IVUS). Similar to conventional coronary angiography, a catheter is inserted through arterial access. The IVUS probe on the tip of the catheter works with piezoelectric crystals, which emit frequencies between 30 and 45 MHz. The ultrasound wave is reflected by the tissue and detected by up to 64 transducer elements in an annular array on the probe (Garcia-Garcia et al. 2010). A circular greyscale IVUS image with a resolution of 200 μm is reconstructed and areas of high and low echogenicity are displayed. Figure 10.7 shows greyscale IVUS images in comparison to conventional coronary angiography (Garcia-Garcia et al. 2010). This figure shows the difference in how the plaque appears in the two modalities. Like conventional ultrasound, this technique uses the amplitude of the backscattered radiofrequency and is limited in its capability to differentiate between plaque components. Virtual Histology™ IVUS (VH-IVUS, Volcano, Rancho Cordova, CA, USA) improves the interpretation of different tissue types by using autoregressive spectral analysis of the ultrasound signal. This algorithm generates tissue color maps that suggest that VH-IVUS might be useful for differentiating fibrous, fibrofatty, necrotic core, and calcified lesions (Nair et al. 2007; Puri et al. 2011). Figure 10.8 shows different plaque types classified by VH-IVUS. The diagnostic strength of IVUS lies in its ability to obtain very detailed information about vessel lumen and vessel wall. Outward remodeling and plaque burden especially, which are missed in conventional coronary angiography, can be detected. In addition, morphology and high-risk features of atherosclerotic plaque (e.g., thin fibrous cap, ulcer) can be visualized (Hong et al. 2008; Fujii et al. 2005). The diagnostic information obtained by IVUS can be pushed even further, when looking at wall elasticity. The mechanical strain can be measured and quantified. IVUS elastography (of plaque area)/palpography (of wall surface area) showed that highly strained regions within a plaque are a feature of vulnerability (Schaar et al. 2004). Figure 10.9 shows ex vivo images of IVUS in combination with palpography (Schaar et al. 2005).
Fig. 10.7
This figure illustrates the heterogenous nature of atherosclerosis and the lack of correlation to intravascular ultrasound findings (a–d) and appearance on angiography (e). Patient presented with stable angina due to a significant lesion in the right coronary artery which was stented (not shown). A greyscale IVUS pullback in the left anterior descending was performed to better characterize the mild lesion in the mid-segment. (a) Large eccentric plaque in the ostium of the left anterior descending that has minimal lumen compromise angiographically. (b) Depicts a soft concentric plaque. (c) Shows a mixed plaque. (d) Depicts an eccentric, soft lesion (Reprinted with permission from Garcia-Garcia et al. 2010)
Fig. 10.8
Virtual histology plaque types. FF fibrofatty, FT fibrous tissue, NC necrotic core, and DC dense calcium (Reprinted with permission from Garcia-Garcia et al. 2010)
Fig. 10.9
Longitudinal IVUS image with superimposed palpogram (a) and 3D palpogram (b) of a tissue-mimicking phantom. The longitudinal view shows the soft plaque that is covered by a harder cap. The superimposed palpogram shows high-strain values in the thinnest part of the cap. The 3D palpogram shows low strain values in the phantom with a high-strain region corresponding to the area with the thin cap. The dotted line indicates the cross-sectional imaging plane of the longitudinal echogram (Reprinted with permission from Schaar et al. 2005)
A rather new concept is the combination of IVUS with photonic spectroscopy (e.g., using near-infrared spectroscopy). A light source at the tip of the catheter emits light (wavelength 780–2,500 nm), and after tissue-dependent absorption and scattering, the spectral data is analyzed. It has been shown that this technique is able to assess the lipid content of plaques in vitro (Puri et al. 2011; Jaross et al. 1999). However, more studies, especially in real patients, are needed to confirm these promising initial results.
The risks and complications of IVUS are similar to those of conventional coronary angiography. Despite the many diagnostic features of IVUS, there are limitations. Some features of the vulnerable plaque, like intraplaque hemorrhage or thrombus, are hard to detect by IVUS. Calcifications appear highly echogenic and block the signal behind them. The algorithms for IVUS tissue analysis have problems identifying calcified plaques properly (e.g., a superficial calcification may mimic a thin fibrous cap) (Nair et al. 2007). Due to the dynamic acquisition during heartbeats, quantitative measurements of plaque components lack accuracy (Puri et al. 2011). Furthermore, no information about the inflammatory component, one of the key features of the vulnerable plaque, can be obtained.
10.3.1.3 Optical Coherence Tomography
Optical coherence tomography (OCT) is an invasive method that uses backscattered infrared light to compose 2D axial, tomographic images of the superficial luminal vessel wall. The reflected light is analyzed by low-coherence interferometry, a technique that is known from OCT imaging of the retina. With a resolution of 10–20 μm, it is perfectly suited to evaluate the endothelium and the fibrous cap of atheromas. Its penetration beyond the lumen–intima or intima–plaque interface is poor. Deeper arterial structures cannot be seen (i.e., lipid-rich necrotic core, deep calcification); thus, plaque characterization is hardly possible. The blood flow causes imaging artifacts; hence, blood needs to be displaced. Currently OCT is mainly used for the visualization of the endothelium after stent implantation (Puri et al. 2011). Figure 10.10 shows OCT images of a coronary artery with intima thickening and a coronary artery after stent implantation. Other areas of application of OCT include the evaluation of culprit lesions with signs of plaque rupture and thrombus formation (Kubo et al. 2007). OCT might be the best modality to measure the thickness of the fibrous cap. The measurement of the fibrous cap thickness is so exact, that a cutoff value (less than 65 μm) has been defined which is associated with increased CAD events. The main disadvantage of OCT remains the poor penetration with insufficient imaging of the deeper segments of the arterial wall.
Fig. 10.10
Images obtained using optical coherence tomography (OCT) coronary imaging. (a) OCT coronary imaging highlighting diffuse intimal thickening. A guidewire artifact can be seen at the base of the artery. (b) OCT image in a bare-metal-stented coronary segment highlighting complete apposition of the stent struts to the intima. A guidewire artifact can be seen at the base of the artery (Reprinted with permission from Puri et al. 2011)
10.3.1.4 Coronary Angioscopy
Coronary angioscopy is performed under angiographic guidance and uses a catheter with a fiber-optic tip, which directly visualizes the luminal vessel wall. A xenon lamp illuminates the endothelium and a color camera transfers the images to an acquisition system (Ishibashi et al. 2006). During this process, the blood has to be displaced by a balloon. The normal vessel wall surface is white. Depending on color and shape, different features of the vulnerable plaque can be distinguished. Lipid-laden lesions appear yellow. If the fibrous cap is thin, the yellow gets more intense, leading to the term “glistering yellow,” which is one of the minor criteria of the vulnerable plaque (see Table 10.3). Those yellow lesions have been shown to be associated with CAD events (MacNeill et al. 2003). Different tones of yellow can be distinguished (see Fig. 10.11). Yellow plaques, as determined by angioscopy, correlate very well with the thickness of the fibrous cap, as seen by OCT (see Fig. 10.12) (Kubo et al. 2008). Furthermore, angioscopy is a good tool to directly visualize thrombi and ulcers. The limitations of coronary angioscopy include that only the surface of larger vessels of the coronary tree can be visualized and the short blockage of blood flow might cause ischemia. To date, angioscopy remains a research tool, with most of the studies conducted in Japan.
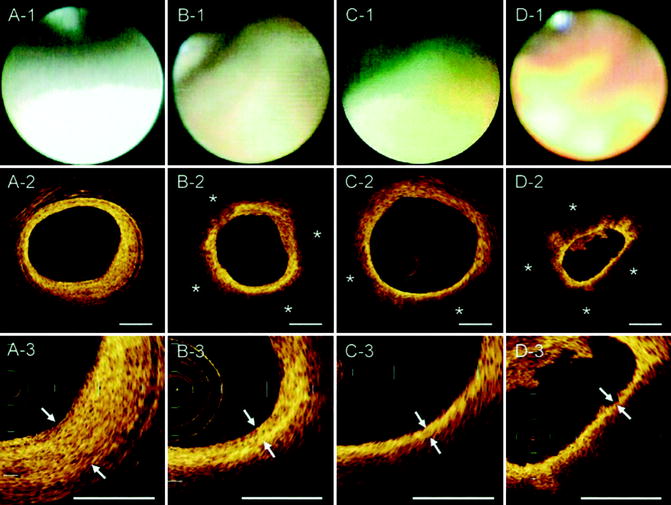
Fig. 10.11
Corresponding images of OCT and coronary angioscopy. In the angioscopic images, plaque color was graded white (A-1), light yellow (B-1), yellow (C-1), or intense yellow (D-1). A lipid pool (*) was characterized by a signal-poor region and was semiquantified as the number of involved quadrants on the cross-sectional OCT image (A-2, B-2, C-2, D-2). The fibrous cap was identified as a signal-rich region between the coronary artery lumen and the inner border of the lipid pool in the OCT image, and its thickness was measured at the thinnest part (A-3, B-3, C-3, D-3; arrows) (Reprinted with permission from Kubo et al. 2008)
Fig. 10.12
Plaque color and fibrous cap thickness. The plaque color was graded white, light yellow, yellow, or intense yellow by coronary angioscopy. The fibrous cap thickness was estimated by OCT. There was a significant negative correlation between yellow intensity and fibrous cap thickness in Spearman’s rank-order correlation analysis (p < 0.0001) (Reprinted with permission from Kubo et al. 2008)
10.3.2 Noninvasive Imaging Techniques
10.3.2.1
Related posts:
Stay updated, free articles. Join our Telegram channel

Full access? Get Clinical Tree


