mm and  mm for the posterior leaflet, respectively.
Electronic supplementary material
The online version of this chapter (doi:10.1007/978-3-319-20309-6_16) contains supplementary material, which is available to authorized users. Videos can also be accessed at http://www.springerimages.com/videos/978-3-319-20308-9.
S. Engelhardt and N. Lichtenberg—These authors contributed equally to this work.
1 Introduction
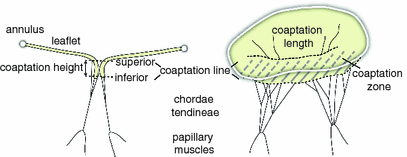
The mitral valve (MV) prevents the backflow of blood into the left atrium during systole. MV insufficiency refers to valve leakage, which impairs the pumping function of the heart. 4D transesophageal echocardiography (TEE), a method based on ultrasound where the probe is inserted through the esophagus, is used for the diagnosis of the severity of MV insufficiency as well as for surgical treatment planning, e.g. it provides valuable information for deciding whether the MV needs to be replaced or whether it can be reconstructed. Reconstruction is preferable, because it mainly uses native tissue of the MV’s components, which are the annulus, the anterior and posterior leaflets and the subvalvular apparatus. During such an intervention, the reestablishment of a sufficiently large coaptation zone is a major goal. During valve closure, the leaflet coaptation zone is formed by the colliding parts of the leaflets (cf. Fig. 1). The upper bound of the coaptation zone is the gently curved coaptation line evident from an atrial view. The height and length of the coaptation zone is viewed as an important assessment of MV function [4]. For instance, poor leaflet coaptation resulting from chordal retrains after MV reconstruction predicts disease recurrence [7].


Fig. 1.
Description of coaptation parameters.
So far, only a handful of works [3, 4, 10] have addressed the computation of the coaptation zone from TEE images. The presented approaches rely on more or less labor-intensive manual measurements. A method described by Gogoladze et al. [4] is based on the analysis of leaflet coaptation heights at three distinct locations along the coaptation line. However, 2D echocardiographic approaches are fundamentally limited due to the single planar view provided, and are prone to errors given the usually irregular 3D topography of the coaptation zone. Saito et al. measured the difference between mid- and end-systolic 3D MV leaflet surface areas in patients with dilated cardiomyopathy [10]. However, it has been demonstrated that the MV leaflet stretches during systole [2], possibly introducing errors in the calculation. The recent work of Cobey et al. [3] describes a manual approach for measuring the MV coaptation zone on an end-systolic frame. The method is based on time-consuming manual annotations of coaptation points (about 100 per time step) on rotational cross-sectional slices as well as subsequent summation of neighboring subareas. The main contribution of this work is to show that the coaptation zone, when indexed to the MV area is closely associated with severity of functional mitral regurgitation. Beside this, the authors state that they “expect that with continued technologic improvements in […] quantitative software, future work on the MV coaptation zone will be more streamlined, if not largely automated” [3]. A general approach for automatic coaptation zone assessment is to create a model of the mitral valve from TEE. Existing (semi-)automatic segmentation methods, to name a few [6, 9, 11, 13], are able to detect the coaptation line, but often fail to comprise the whole coaption zone, especially its height, in the final segmented model. In [13], the author states that the final model includes a detailed coaptation zone, but a visual presentation of the coaptation and its quantitative parameters is not provided.
A segmentation should ideally capture patient-specific detail over the whole cardiac cycle and should be able to establish correspondences on valves of different subjects and over all time steps. A major challenge is to separate anterior from posterior leaflets upon coaptation, since there is no intensity-based demarcation and according to [11], “making this distinction […] is extremely difficult even for a human observer.” In this paper, we present a mitral valve segmentation method that integrates a leaflet separation step into the overall model initialization and specifically treats the free edges of the leaflets when they coapt in order to obtain a reliable coaptation height. The method is automatic in terms of leaflet delineation, given a semantically annotated annulus model.


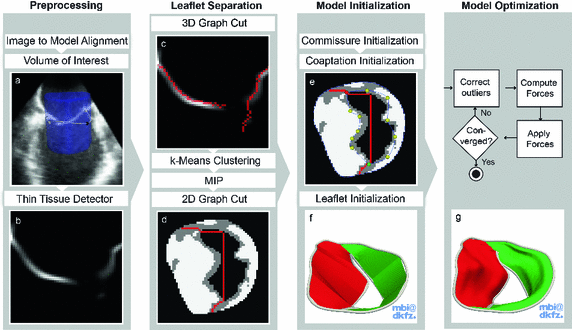
Fig. 2.
Steps of our automatic segmentation pipeline (Color figure online).
2 Materials and Methods
The method requires the location of the mitral annulus, which we generate with minimal user input using our semi-automatic method [5]. The model contains semantic information about the location of the anterolateral and posteromedial annular commissure points and the saddle horn. On a volume of interest of the TEE (blue cylinder in Fig. 2a), the Thin Tissue Detector (TTD) [12] (cf. Fig. 2b) is applied using the same parameter configuration as in [12]. Higher TTD values describe the voxel’s tendency to be located within a thin tissue region such as the MV leaflets. We construct a search space on the TTD that is comprised of an arc system centered on the annulus, as proposed in [11]. The Kolmogorov’s min-cut/max-flow 3D graph cut method [1] is used to find a first estimation of the leaflet surfaces (cf. Fig. 2c), where the source and sink are connected to the arcs [11]. The resulting surface S from the graph cut includes the leaflets, but also extends into the ventricle and needs to be trimmed. For this, the surface is voxelized and dilated with a structuring element with a diameter greater than the expected leaflet thickness. A k-means clustering with  is then applied on the grey values of the TTD masked with the dilated S, resulting in a classified image
  that contains the classes leaflet tissue
  , uncertain
  and background
  . A Maximum Intensity Projection (MIP) in the direction of the annulus plane normal is applied on
  . Using the known annuluar commissure points from the annulus segmentation as separation points, a min-cut on the MIP result is calculated. The resulting cut line roughly delineates a leaflet separation line (cf. Fig. 2d). Using the MIP of the clustered image
  as input can better ensure that the graph cut runs through the background, as the intensity difference between two labelled regions is higher than for the smooth grey value transitions in the original TTD image.

 is then applied on the grey values of the TTD masked with the dilated S, resulting in a classified image
  that contains the classes leaflet tissue
  , uncertain
  and background
  . A Maximum Intensity Projection (MIP) in the direction of the annulus plane normal is applied on
  . Using the known annuluar commissure points from the annulus segmentation as separation points, a min-cut on the MIP result is calculated. The resulting cut line roughly delineates a leaflet separation line (cf. Fig. 2d). Using the MIP of the clustered image
  as input can better ensure that the graph cut runs through the background, as the intensity difference between two labelled regions is higher than for the smooth grey value transitions in the original TTD image.
Fig. 3.
(a+b) Commissure, leaflet initialization on  (white),
  (grey),
  (black) image regions. (c) Push forces shift points away from the preceding neighbour. (d) Smoothing forces equalize point distances. (e) Tips coapt, driven by push and gravity forces (Color figure online).
 (white),
  (grey),
  (black) image regions. (c) Push forces shift points away from the preceding neighbour. (d) Smoothing forces equalize point distances. (e) Tips coapt, driven by push and gravity forces (Color figure online).
The goal of the subsequent initialization of the 3D model is to put the important landmarks into reasonable locations (cf. Fig. 2f) so that the following model optimization (cf. Fig. 2g) can work reliably. First, leaflet commissure landmarks are searched along the leaflet separation line on the MIP image of  (cf. Fig. 3a), beginning the traversal at the annular commissures. We are looking for transitions between two classes 1.
  , 2.
, 2.  , 3.
, 3.  , 4.
, 4.  with descending priority. The leaflet commissure points are set to the location of the transition with the highest priority (cf. Fig. 2e green and red point). For initialization of the leaflet tip points, the area between the two leaflet commissural points is uniformly sampled with 5 rotational slices in a fan-shaped manner, centered on the saddle horn (cf. Fig. 3a). Two leaflet tip points per slice are initialized on the anterior and posterior portion of the leaflet separation line. Then, the tip points move on their respective slices towards their leaflet root on the annulus (cf. Fig. 2e yellow points). Again, the location of the transition with the highest priority between the classes (1.
  , 2.
, 2.  , 3.
, 3.  , 4.
, 4.  ) decides where the movement stops. Finally, the points are backprojected to their original location in the 3D volume
  (inverse MIP). After initializing the free leaflet edges, the remaining points of the leaflet body need to be defined on each fan slice. Starting with a uniformly subdivided straight connection from each 3D leaflet tip point to its annular root (cf. Fig. 3b), the position of each leaflet body point is then refined. Each voxel on the arc in the 3D clustered TTD image
  is checked for its class value C as well as the presence of the actual graph cut surface S, and are sorted into the following categories: 1.
  &S, 2.
  &S, 3.
  , 4.
, 4.  . For each arc, the averaged location of the voxels in the highest priority group for the respective leaflet body point is taken. Outliers are replaced by interpolating neighboring leaflet body points.
 (cf. Fig. 3a), beginning the traversal at the annular commissures. We are looking for transitions between two classes 1.
  , 2.
, 2.  , 3.
, 3.  , 4.
, 4.  with descending priority. The leaflet commissure points are set to the location of the transition with the highest priority (cf. Fig. 2e green and red point). For initialization of the leaflet tip points, the area between the two leaflet commissural points is uniformly sampled with 5 rotational slices in a fan-shaped manner, centered on the saddle horn (cf. Fig. 3a). Two leaflet tip points per slice are initialized on the anterior and posterior portion of the leaflet separation line. Then, the tip points move on their respective slices towards their leaflet root on the annulus (cf. Fig. 2e yellow points). Again, the location of the transition with the highest priority between the classes (1.
  , 2.
, 2.  , 3.
, 3.  , 4.
, 4.  ) decides where the movement stops. Finally, the points are backprojected to their original location in the 3D volume
  (inverse MIP). After initializing the free leaflet edges, the remaining points of the leaflet body need to be defined on each fan slice. Starting with a uniformly subdivided straight connection from each 3D leaflet tip point to its annular root (cf. Fig. 3b), the position of each leaflet body point is then refined. Each voxel on the arc in the 3D clustered TTD image
  is checked for its class value C as well as the presence of the actual graph cut surface S, and are sorted into the following categories: 1.
  &S, 2.
  &S, 3.
  , 4.
, 4.  . For each arc, the averaged location of the voxels in the highest priority group for the respective leaflet body point is taken. Outliers are replaced by interpolating neighboring leaflet body points.
Stay updated, free articles. Join our Telegram channel

Full access? Get Clinical Tree


