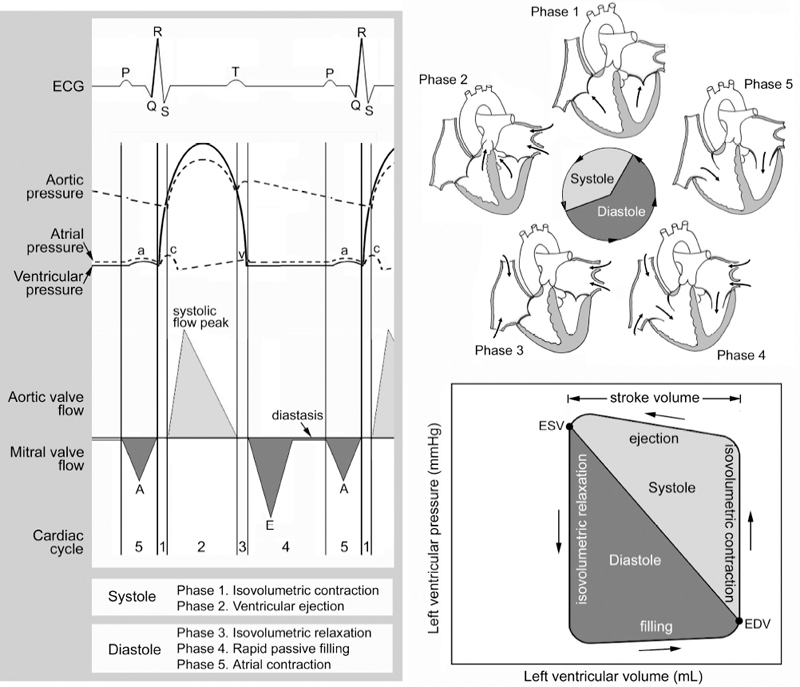
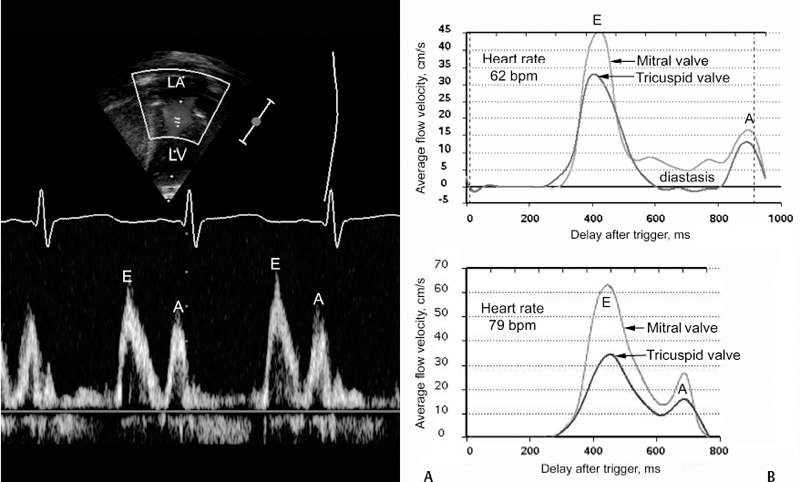
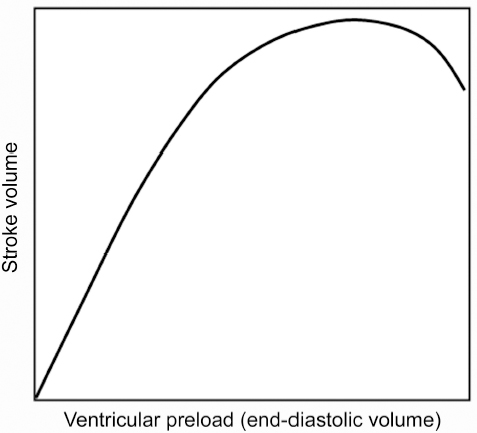
3 Basic Cardiac Function and Hemodynamics Correct anatomic diagnosis of specific congenital heart lesions is only the beginning of patient management. As important, if not more important, is the assessment of the patient’s hemodynamic state and the status of their heart function. Such assessments are ongoing as these states can change with time, sometimes rapidly. A basic understanding of cardiac function and its applicability to various specific heart lesions is beyond the scope of this book. However, a basic understanding of cardiac function and the various modalities used in its assessment, their advantages, disadvantages and limitations, is vital toward communication with other health care professionals involved in the management of such complex patients. Traditionally, and for the purposes of this chapter, the cardiac cycle has been described for the function of the left ventricle, but similar events also occur within the right ventricle. The cardiac cycle typically is divided arbitrarily into two discrete phases — systole (the period during which there is ventricular contraction) and diastole (the period during which the ventricle is relaxing). The beginning of the cardiac cycle has been described from the onset of electrical activation of the ventricle, or ventricular depolarization (Fig. 3.1). Systole itself is divided further into two stages. During early systole, the ventricle has begun the process of contraction. The pressure within the ventricle rises and increases beyond the pressure within the atrium, which causes the mitral valve to close. However, the pressure within the ventricle has not exceeded the aortic pressure and the aortic valve remains closed. As the ventricle continues to contract the pressure within the ventricle rises without any net movement of blood into or out of the ventricle. Therefore, the volume of the ventricle remains the same and this period of systole is referred to as isovolumetric contraction. With further contraction, the pressure within the ventricle exceeds the aortic pressure and the aortic valve opens. The ventricular volume falls as the ventricle ejects blood into the aorta and this period of systole is referred to as ventricular ejection. The onset of diastole is traditionally marked by the closure of the aortic valve and subsequent decrease in ventricular pressure. Diastole is also further divided into two stages. During early diastole, the pressure in the ventricle is less than the aortic pressure, but greater than the atrial pressure. Therefore, both the aortic and mitral valves remain closed as the ventricle relaxes and there is no net flow of blood into or out of the ventricle. This period of diastole is known as isovolumetric relaxation. The next stage of diastole results in the filling of the ventricle with blood. As the ventricular pressure decreases below atrial pressure, the mitral valve opens. Filling of the ventricle occurs in two discrete phases. During the first phase, there is passive filling of the ventricle due to the pressure difference between the atrium and the ventricle. Blood flows into the ventricle, until the pressure difference across the mitral valve is eliminated. Following passive filling, there is atrial contraction, which raises the pressure in the atrium and allows for further filling of the ventricle. The blood flow waves through the mitral valve during passive filling and atrial systole are called E wave and A wave, respectively. Typically, two thirds of the ventricular stroke volume is filled during the passive filling stage, and one third with atrial contraction. When the heart rate is low, the mitral inflow ceases after the E wave until the atrium contracts to produce an A wave. This period is called diastasis. When the heart rate is high, the A wave starts before the E wave reaches the baseline and therefore a period of diastasis is not present. With a very high heart rate, the E and A waves may merge to produce a single peak. It is worthwhile to know that the cardiac cycle is shortened mostly at the expense of the diastolic filling period (Fig. 3.2). After the atria contract, a new cardiac cycle is started with ventricular depolarization and initiation of ventricular contraction. Ventricular depolarization causes an influx of calcium ions into the myocyte from the sarcoplasmic reticulum. Calcium influx results in shortening of the actin-myosin cross-bridges and leads to myocardial contraction. During diastole, calcium is removed from the intracellular cytosol through an energy-dependent calcium pump and the decrease in intracellular calcium causes ventricular relaxation. Therefore, it should be noted that ventricular contraction and relaxation are both energy-dependent processes and that relaxation is not a passive process. Fig. 3.1 Composite diagrams showing cardiac phases in pressure tracing, spectral Doppler flow curves, and a pressure-volume loop. In the atrial pressure wave, the a wave is due to atrial contraction, the c wave is associated with onset of ventricular systole, and the v wave is associated with atrial filling during systole. The blood flow through the atrioventricular valve consists of two peaks, E and A waves. The E wave is associated with early passive filling during ventricular relaxation, and the A wave is due to atrial contraction. When the heart rate is slow, the E and A waves are interposed by a period of cessation of blood flow, which is termed diastasis. The pressure-volume relationship shown in the diagram is a simplified representation of the normal left ventricular pressure-volume curve. Normal right ventricular pressure-volume relationship differs from that of the normal left ventricle. ECG, electrocardiogram, EDV, end-diastolic volume; ESV, end-systolic volume. The cardiac output is the product of the heart rate and the stroke volume. Stroke volume (i.e., how much blood is ejected with each heart beat) is affected by three variables: preload, afterload, and contractility. Fig. 3.2 Blood flow through the mitral valve. Ultrasound Doppler technique in the left panel traces the velocity spectrum, whereas phase-contrast velocity mapping at magnetic resonance in the right panel traces average velocity. E and A wave peaks are associated with early rapid filling during ventricular relaxation and atrial contraction, respectively. MR flow tracings at two different heart rates show that the shortening of the cardiac phase with increased heart rate is mainly due to shortening of the diastolic phase. With a slower heart rate, the two peaks are interposed by a period of diastasis (right upper panel). LA, left atrium; LV, left ventricle. For the sake of discussion, we will consider each individually, but it should be known that these factors work in concert, and there is a certain degree of interaction between these variables. There is a direct relationship, known as the Frank—Starling relationship, between the stroke volume and the amount of preload in the ventricle (Fig. 3.3). According to this relationship, as the end-diastolic volume (i.e., the volume of the ventricle just prior to contraction) increases, the stroke volume of the ventricle also increases. In part, this is related to the fact that the amount of tension generated by individual myocardial fibers is proportional to the length to which the muscle is stretched. Microscopically, this is due to the degree of overlap between the actin and myosin filaments within the myofibrils of the cardiac myocyte. However, as the preload increases, the ventricle eventually becomes overdistended to a point that its ability to increase stroke volume becomes impaired. As a result, the increase in stroke volume per amount of preload plateaus and eventually, stroke volume begins to decrease. Fig. 3.3 Frank—Starling relationship between stroke volume and preload. The stroke volume increases proportional to increase in end-diastolic volume of the ventricle to the point where the ventricle fails. The force with which the ventricle contracts is dependent on several factors — the degree of activity of the contractile proteins, the amount and sensitivity to intracellular calcium (calcium mediates myocardial contraction), the compliance of the ventricle, and the degree of actin-myosin cross-bridging. The afterload of the heart is also dependent on several other factors — the pressure against which the ventricle pumps, the inertia of the blood, and the tension in the myocardial wall (also known as wall stress). There is an inverse relationship between the amount of afterload and the stroke volume. Practically, it is very difficult to quantify the total amount of afterload that a ventricle sees. Usually systemic vascular resistance is used as a surrogate for afterload. Heart rate is another determinant of cardiac output. Younger infants are predominantly dependent on heart rate to maintain their cardiac output. If the stroke volume of the heart is held constant, increases in heart rate will result in proportionate increases in cardiac output, up to a point. As the heart rate increases, the diastolic period is shortened (Fig. 3.2). As a result, the amount of time allowed for filling decreases and cardiac output will subsequently decrease because of inadequate preload. Heart rate also affects the inherent contractility of the myocardium, through mechanisms that are still being determined. This relationship is known as the force-frequency relationship. As the heart rate increases, the force with which the myocardium contracts increases proportionately up to a point. It is felt that this response is related to calcium cycling within the myocyte as well as calcium sensitivity of the contractile elements of the myocyte. However, despite describing these determinants separately, again, it must be kept in mind that there are interactions between these factors to help regulate cardiac output. The heart rate can influence the degree of contractility of the myocardium. The amount of preload can influence the degree of contractility. Within clinical situations, all of these forces are at work, and depending on the different situations, some factors may predominate over others.
 The Cardiac Cycle
 Determinants of Cardiac Output
 Preload: ventricular wall tension at end of diastole. In clinical terms, it is the stretch on the ventricular fibers just prior to contraction, often approximated by the end-diastolic volume or end-diastolic pressure.
 Afterload: ventricular wall tension during contraction. It is the systemic or pulmonary vascular resistance that must be overcome in order for the ventricle to eject its contents. It is often approximated by the systolic ventricular or arterial pressure.
 Contractility: Property of heart muscle that accounts for force of contraction, independent of the preload or afterload.
 Systolic Parameters of Ventricular Function
Related posts:
Stay updated, free articles. Join our Telegram channel

Full access? Get Clinical Tree


