Introduction
This introduction to the basic principles of cardiovascular magnetic resonance (CMR) describes the concepts of magnetization, T1, T2, T2*, and image formation, and describes some common CMR pulse sequences and parameters. These basic ideas will require some time and rereading to fully appreciate, but each new concept will add to the understanding of CMR.
The human body is composed of mostly water, and a lot of fat. The water (H 2 O) and fat contain many hydrogen atoms. Hydrogen atoms in turn are made up of a proton ( 1 H, the hydrogen nucleus) and an electron. Hydrogen protons are in very high concentration in the body, roughly ~100 molar. a
a The molarity of 1 H can be estimated as ~(2 moles hydrogen/mole H 2 O) × (1 mole H 2 O/18 g of tissue) × 1000 g/L (density of the body) ~ 100 mole/L.
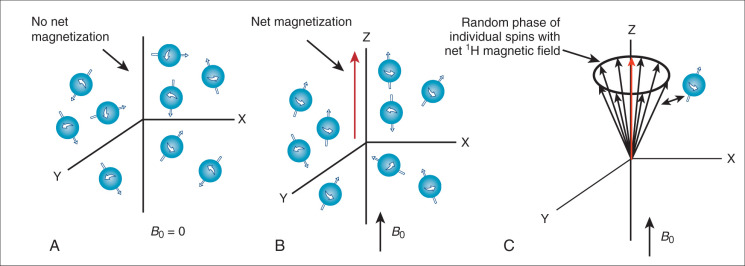
These hydrogen protons within the body can be imaged through magnetic resonance imaging (MRI). MRI is possible because hydrogen protons have “spin” and all nuclei with spin interact with magnetic fields. Spin is called the “intrinsic angular momentum,” and it is a fundamental property of protons. MRI physics is often called “spin physics” because it describes how the proton spins are used to image the body. In this chapter we will use the term spin to indicate the hydrogen proton’s spin. MRI images these spins, and in this way it images the tissues in which they are embedded.In the absence of a magnetic field, the spins are randomly oriented ( Fig. 1.1A ). But if placed in a large magnetic field (called B 0 ; i.e., the CMR scanner), the water spins partly align in the same orientation of this applied magnetic field much like iron filings ( Fig. 1.1B ), with larger magnetic fields causing greater alignment of the spins. In fact, the bulk magnetization, M z , is proportional to the strength of the applied field. Unlike iron filings, however, the interaction of the spins with the B 0 field results in the spins rotating around the axis of the magnetic field ( Fig. 1.1C ). This is why the hydrogen nuclei in MRI are also referred to as spins: they spin (precess) around the B 0 field. The frequency of precession (v) is a very important property of the spins in a magnetic field and is defined by the Larmor equation:
ν=γ2πB
The Larmor equation (see Eq. 1.1 ) looks simple, but it is the basis of CMR imaging. To determine the location of different magnetic spins, the magnetic field (B) is made to vary (linearly) with position using specialized coils of wire (called “gradient coils”) inside the magnet. This results in a precessional frequency (v) that depends on a spin’s location in the scanner. By measuring the number of spins precessing at each location (i.e., frequency), a magnetic resonance (MR) image is created as will be discussed below.
Detection of the MRI Signal
Alignment With the Main Magnetic Field
How can the MRI signal from water spins be detected in order to image the sample? Remember, when a sample (i.e., a patient) is placed in the main magnetic field (i.e., inside the bore of the magnet), the hydrogen spins align with that field (see Fig. 1.1B ) and begin to precess at the Larmor frequency. We call the direction of the main magnetic field, B 0 , the Z-axis direction or the longitudinal direction. Since the spins partially align with the B 0 field, they create a net magnetic field along the Z axis (oriented parallel with B 0 ). However, the spins precess or rotate around the Z axis in a random, incoherent fashion, resulting in no net magnetization in the X-Y plane (also called the transverse plane) (see Fig. 1.1C ). Magnetization by the B 0 field (i.e., M z ) is not enough to generate an MR signal. The MR signal is measured as the magnetization on the X-Y plane (called M xy ). The MR signal is detected by placing a receiver coil (loops of wire tuned to receive signals oscillating at the Larmor frequency) near the subject to detect any spin precession in the X-Y plane. A receiver coil, placed to detect the precession of spins in the X-Y plane, will not detect any signal if M xy is zero (see Fig. 1.1C ).
Radiofrequency Excitation
To create an MR signal, the water spins must be precessing in a coherent manner in the X-Y plane. To accomplish this task, another (less powerful) magnetic field, with a strength that oscillates at the Larmor frequency is applied perpendicular to the main magnetic field ( Fig. 1.2A ). This process is called radiofrequency (RF) excitation, and the field is called an RF pulse or a B 1 field, since it uses a magnetic ( B 1 ) field rotating at a high (radio wave) frequency. The frequency of this perpendicular B 1 field has to precisely match the Larmor frequency of the water to excite the spins in the presence of the stronger B 0 field. (This concept is analogous to exciting a piano string with a tuning fork. Only the string with the same resonant frequency as the tuning fork will efficiently absorb the energy from the fork and resonate. In fact, magnetic resonance imaging gets its name from the resonant frequency used for RF excitation.) The excitation field ( B 1 ) has a strength of only a few gauss, compared to the B 0 field, which has a strength of 15,000 gauss at 1.5 T (1 T = 10,000 gauss). In addition, the B 1 field is only applied transiently (for milliseconds), long enough to temporarily deflect the spins into a plane perpendicular to B 0 . This effect on the net magnetic field is illustrated in Fig. 1.2A , which shows a B 1 pulse that drives the magnetization completely into the transverse plane (X-Y plane). This is called a 90-degree pulse (or saturation pulse), referring to the angle through which the initial magnetization (M z ) moves relative to the Z axis. However, in practice, the B 1 pulse can be used to flip the magnetization by any angle from 0 to 180 degrees. A small B 1 pulse (<90 degrees) is called an alpha pulse, while a 180-degree pulse is called an inversion pulse. A 180-degree flip is achieved by applying the B 1 field for twice as long or with twice the strength as the 90-degree pulse. The RF pulse is usually directed along the X or Y axis and oscillates at the Larmor frequency, with an amplitude and shape that determine the true flip angle. Once the B 1 field is turned off, the only field affecting the magnetization is the B 0 field. Now the net magnetization of the water proton spin is in the transverse plane and can be detected as an oscillating signal in the receiver coil ( Fig. 1.2B ), precessing at the Larmor frequency. This is the signal measured in MRI.
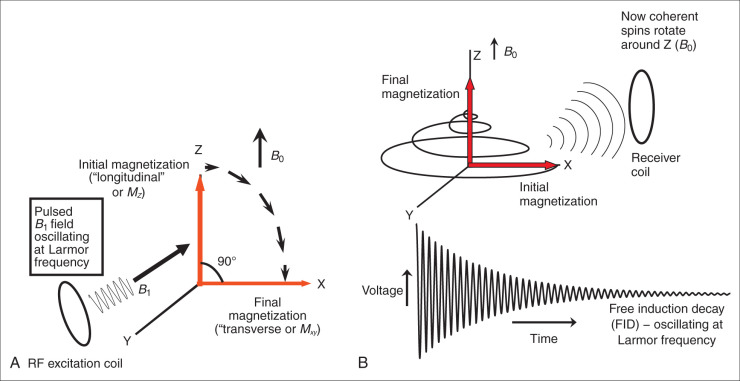
After the RF excitation, the water spins will rotate around the B 0 field on the X-Y plane. Fig. 1.2B shows the signal detected by the receiver coil as the spins precess in the X-Y plane. The signal oscillates at the Larmor frequency and decays in amplitude with time; it is called a free induction decay (FID). The decay in net magnitude in the transverse plane is known as magnetic relaxation. The decay occurs because the spins, having absorbed energy from the transient B 1 field, which is now turned off, return to their original state in equilibrium with the B 0 field, with spins partially aligned along the Z axis (see Fig. 1.1C ). This occurs via two extremely important processes called T1 and T2 relaxation. Nature abhors order and seeks to minimize the energy in the system by returning to equilibrium with the main magnetic field, B 0 , through T1 and T2 relaxation. T1 and T2 relaxation are the foundations of MRI because they are responsible for MRI’s excellent contrast.
T1 Relaxation
T1 relaxation, also known as spin-lattice relaxation, is the release of energy to the environment, or lattice, that results in the reestablishment of the magnetization along the Z axis. Thus T1 is the time constant by which the longitudinal (or Z) magnetization relaxes to its equilibrium value, M 0 . After a 90-degree RF pulse, the Z magnetization, M z (t) , is initially 0 but regrows with a relaxation time T1 to its equilibrium value ( M 0 ).
Mz(t)=M0(1−e−t/T1)
| Field Strength | 1.5 T | 3 T | ||
|---|---|---|---|---|
| Tissue | T1 (ms) | T2 (ms) | T1 (ms) | T2 (ms) |
| Myocardium | 950 | 55 | 1150 | 40 |
| Arterial blood | 1550 | 250 | 1650 | 200 |
| Fat | 260 | 110 | 320 | 70 |
| Skeletal muscle | 1000 | 45 | 1400 | 50 |
T2* and T2 Relaxation: The Effects of Spin Phase
The other form of relaxation, T2* (T2 star) relaxation, is that of the randomization of the phase of the spins. After RF excitation, all of the spins precess about the Z axis, with slight differences in the precessional rate, and this eventually results in “T2* decay.” T2* decay comes from differences in the phase of each spin, so that the net X-Y magnetization, M xy , decays to 0. The phase indicates the direction of the spin in the transverse plane. The phase (ϕ) of a spin in the transverse plane depends on its initial phase, ϕ 0 , the precessional frequency of that spin, and the time, t , that it has spent in the transverse plane (assuming a constant frequency).
ϕ=ϕ0+2πνt

In Fig. 1.3B a phase diagram is used to show the changing phase relationships for three spins in a sample that are precessing at different frequencies. The magnetic field always varies because of imperfections in the main magnetic field and changes in the molecular environment. In this schematic, the three spins experience slightly different magnetic fields, one higher than B 0 , one exactly B 0 , and one lower. Therefore, after some time on the X-Y plane, each spin experiences phase accrual, until the net magnetization (the sum of all of the spins magnetization) decreases to 0.
Within a single pixel in a CMR image, there are a quintillion water spins, each with a slightly different frequency. Therefore, while all of the spins are precessing at about the Larmor frequency, at any time one spin might be precessing a little faster and another might be precessing a little slower.
T2* relaxation can be understood as the characteristic time in which the spins in the (X-Y) plane become so out of phase that the signal decays (dies out). The signal decays because the relative phase of the spins in a single voxel are different. After the initial excitation using a B 1 pulse, all of the spins on the transverse plane have identical phase but then begin to dephase quickly. This dephasing is described by a time constant T2*. The dephasing causes the bulk transverse magnetization, M xy , to decay and approach 0, due to incoherent phase.
Mxy(t)=Mxy0e−t/T2*
Thus the CMR signal (M xy ) decays in a simple exponential way, with a time constant of T2*.
T2 Versus T2*
We need to further understand T2* and how it differs from T2. Both are related to dephasing due to variability in the main magnetic field. In general, two distinct processes contribute to the dephasing of spins in a voxel. The first mechanism is the true T2 decay that is unavoidable, irreversible, and dependent on the molecular interactions within the sample. T2 relaxation is also called spin-spin relaxation. It is called this because the mechanism of the relaxation process is through the interaction of spins in the sample with each other at or below the Larmor frequency, making this process dependent on the microscopic motions within the sample. The second process is T2* decay and includes T2 relaxation and also relaxation due to static inhomogeneity of the main magnetic field ( B 0 ) within the sample. These B 0 field imperfections result from hardware imperfections and susceptibility-induced B 0 variations due to the influence of the body itself. In the heart, both the lung cavity and the deoxygenated blood in the right heart contribute to B 0 inhomogeneity. B 0 field imperfections also arise from any metallic objects (sternal wires, devices, etc.) near the heart. As illustrated in Fig. 1.3B , if the B 0 field is not homogeneous throughout the sample then the frequency of the spins in different regions will vary (see Eq. 1.1 ). These spins are called “off-resonance” spins. Both T2 and T2* processes result in a randomization of the spin phases as they precess at different frequencies, and a decrease in the net transverse magnetization. However, while T2 relaxation is irreversible, T2* relaxation can be partly reversed since some of it is due to static off-resonance: T2* includes the irreversible molecular spin-spin interactions (T2) and static off-resonance. Myocardial T2 relaxation rate is ~55 ms at 1.5 T (see Table 1.1 ), while myocardial T2* is ~30 ms at 1.5 T. T2* is always less than T2 for all tissues , because it includes effects of T2 relaxation, as well as off-resonance effects. Later we will describe how to obtain T2 contrast instead of T2* contrast.
These basic relaxation processes, T1, T2, and T2* are key in the generation of image contrast as well as determining the optimal image sequence for gathering information on cardiovascular anatomy, function, and physiology. What is important is that T1, T2, and T2* vary for different tissues, and in disease, thereby providing “contrast” in the CMR image (see Table 1.1 ). For example, the T1 and T2 values are prolonged with increasing water content, as with edema, which is present in different disease states. Overall, myocardial remodeling, or myocyte replacement with connective tissue, also changes the water relaxation properties since the nature of the macromolecules in contact with water are critical for these relaxation processes. Finally, most exogenous, intravenously injected CMR contrast agents act by shortening T1 and T2/T2* of the water spins. By appropriately modifying the imaging sequences, these changes in relaxation properties due to pathology or exogenous contrast agent can be highlighted or even mapped (measured on a pixel-by-pixel basis) in the heart. First, the process of imaging—localizing the T1- or T2-weighted signal to a region—will be explained.
Spatial Localization
To create a CMR image, the MR signal intensity from the sample (e.g., patient) must be determined in three dimensions (X, Y, and Z). Thus, for a single image, it is necessary to collect information on X, Y, and Z positions and signal amplitude. This signal amplitude can be T1, T2, or T2* weighted, as desired. This localization is performed using multiple measurements or repetition times (TRs). To localize signal to Nx × Ny voxels (e.g., a 128 × 128 matrix), approximately Nx • Ny signals (and Ny TRs) are needed. This is actually a limitation of CMR, resulting in a relatively slow image acquisition rate compared to many other modalities.
The simplest imaging experiment can be divided into four stages as shown in the block diagram in Fig. 1.4 : (1) RF excitation with slice selection (localization in Z); (2) phase encoding (localization in Y); (3) gradient and RF rephasing/refocusing; and (4) frequency encoding (localization in X). Each stage is used to encode the MR data with information on the position and the amplitude of the water proton signal. By convention, the Z-position information is encoded with the slice-selection step, the X position is determined in the frequency-encoding/readout step, and the Y position is obtained with the phase-encoding step. In practice the frequency-encoding (X), phase-encoding (Y), and slice-selection (Z) directions can be rotated in any appropriate direction. MR is tomographic and can create an image of the body along any plane. Indeed, oblique imaging, slicing through a tissue at 45 degrees, or any other angle, is possible and common. In this way CMR differs from other modalities (e.g., computed tomography [CT] or two-dimensional [2D] echocardiography), because CMR can acquire images in any plane.

Magnetic Gradients
Spatial encoding in CMR is performed using magnetic field gradients applied to the main magnetic field: slice-select gradients, phase-encoding gradients, and frequency-encoding gradients. Gradient coils are special coils within the magnet that modify the main magnetic field (B) , causing its strength (but not direction) to change slightly in space.
B(x,y,z)=B0+Gx⋅x+Gy⋅y+Gz⋅z
where G x , G y , and G z are called “gradient strengths,” and x , y , and z are the spatial coordinates with x = 0, y = 0, z = 0 at the center of the magnet bore. Eq. (1.5) describes how the main magnetic field strength—which always is directed along the Z axis—varies spatially with x , y , and z . Fig. 1.5 demonstrates the variation of the B field in the presence of an x gradient. In the same way, gradients on the Y or Z axis vary the B field in y or z . Using gradients, the main magnetic field, with which the spins align, and around which they precess, varies with spatial position inside the scanner. Remember, this magnetic field points in the Z direction . The gradients do not change this direction but slightly increase or decrease its strength spatially. These spatially varying magnetic fields are called gradients because they create a spatially varying magnetic field (a magnetic field gradient). Of course, since the magnetic field varies with position, the precessional frequency ν( x , y , z ) and the phase ϕ( x , y , z , t ) of the spins also varies with position (see Eqs. 1.1 and 1.3 , and Fig. 1.5 ).
v=γ2πB(x,y,z)=γ2π(B0+Gx⋅x+Gy⋅y+Gz⋅z)
Stay updated, free articles. Join our Telegram channel

Full access? Get Clinical Tree


