chapter 4 Biological Target Volume
INTRODUCTION
A radiation target that is inadequate will result in a systematic geograph miss and correspondingly, a reduced probability of local control, and ultimately survival. If a radiation target is larger than necessary, the volume of normal tissue included may be excessive and can limit the radiation dose that can be delivered to the target. Only an accurate and precise target will improve the probability of local control with modern radiation therapy techniques. Only an accurate target will provide the confidence to truly test the potential of dose escalation: increasing dose to maximize the probability of local control, without increasing the risk of normal tissue toxicity. Target definition remains the limiting factor in the process of radiation therapy.
Current radiation therapy delivery technologies, such as multi-leaf collimators (MLCs), intensity-modulated radiation therapy (IMRT), and tomotherapy, are able to deliver curative levels of radiation with spatial accuracies on the order of 1 to 2 mm to virtually any anatomic location. Present-day dosimetry protocols, instrumentation, and dose calculation software can predict the delivered radiation dose to within a few percent. A whole new generation of imaging technologies integrated with linear accelerators allow image-guided radiation therapy (IGRT) with the promise of a daily “see and treat” approach. Electronic portal imagers (EPIDs), 2D and 3D ultrasound systems, real-time fluoroscopy, and kilovoltage CT (kVCT) and megavoltage cone-beam CT (MVCT) are imaging modalities that are or soon will be commercially available with state-of-the-art treatment units. Their primary role is to try to minimize geometric uncertainties associated with patient motion related to anatomy and daily setup. These systems are useful for guidance only, allowing for the daily realigning of radiation beams to the planned target previously defined by the radiation oncologist, and based on the same or alternate imaging modality used at the time of planning. They do not provide information on what is the “true” target and where precisely are its boundaries. In the treatment of many solid tumors, the uncertainties in the knowledge of the target and its boundaries greatly exceed the precision by which one can plan and treat.1,2
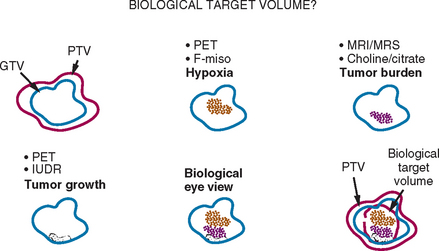
IMRT delivery systems are also capable of “dose painting,” allowing differential dosing to different geometric regions with-in a tumor or target region. Ling and colleagues proposed the concept of dose painting with biological conformality, in which different doses of radiation could be delivered to regions exhibiting different biological properties.3 The concept of a biological target volume is shown schematically in Figure 4-1. If regions of hypoxia, angiogenesis, or cell proliferation within a tumor could be identified through imaging, one could deliver different doses to each region to optimize cell death. It is well established from tumor radiobiology that hypoxic cells require higher levels of radiation to neutralize compared to normoxic cells. Clinically, tumor hypoxia in several solid cancers, including lung, head and neck, and uterine cervix, has been recognized to be important in determining response to radiation therapy.4,5 Similarly, cells undergoing proliferation require different dose and fractionation schema. Unfortunately, biological processes cannot be imaged with anatomic imaging modalities such as CT or with conventional magnetic resonance imaging (MRI). To date, the feasibility of biological conformality has not been realized, largely because of the lack of biological or molecular imaging techniques for clinical applications.
In this chapter, the role, implementation, and potential of combined PET-CT data in radiation oncology target definition will be addressed. Although many in the radiation oncology community have embraced this technology over the past decade, it is recognized that the role of PET-CT in target definition is only now being assessed. Relatively few reports, many with limited patient numbers, currently exist and, the benefits and optimal utilization of PET-CT in radiation targeting is a question that remains unanswered. Research in this field is expected to evolve rapidly, with innovative developments in image segmentation, quantitative analysis, imaging technology, and novel radiotracers as well as an increase in clinical experience. PET with the radiotracer, 2-[18F] fluoro-2-deoxy-D-glucose (FDG), an analog of glucose, is the most useful tracer in oncology to date. Clinical experience with PET for oncology to date has involved FDG and as such, this chapter will focus primarily on PET-CT with FDG as the radiolabeled biomolecule. The exception will be the section, “Future Radiotracers for Targeting” in which a brief review of current and future developments in novel radiotracers for cancer biology imaging will be presented.
VOLUMES FOR RADIATION TARGETING
In radiation planning, radiation oncologists define one or more tumor or target volumes and identify surrounding normal tissues that may be dose-limiting. As previously stated, the radiation oncologist must select pertinent information from simulation and diagnostic images, clinical examinations and reports, then coalesce this information with his/her experience and knowledge of disease behavior to determine the most appropriate target. This target must then be drawn onto simulation images. In some clinical scenarios, multiple targets can be defined, each requiring different dose prescriptions. One example of this practice is in definitive radiation therapy of head and neck cancers where a prescribed dose of approximately 45 Gy is delivered to regions of subclinical disease, but a minimum dose of 60 Gy is given to regions of gross tumor and macroscopically involved lymphadenopathy. In 3D-conformal radiation therapy (3DCRT) and IMRT, these volumes are localized in 3D, usually on CT-simulation images. It is important for recording and reporting purposes that the volumes and terms used are clear, well defined, unambiguous, and universally accepted. Standardization of the terminology used for volume definitions can ensure a common understanding and meaningful exchange of information among the radiation oncology community. To standardize the terminology used for various volumes, the International Commission of Radiation Units (ICRU) published ICRU Report 50, “Prescribing, Recording, and Reporting Photon Beam Therapy,” followed 6 years later with its supplement, ICRU Report 62.6,7
The gross tumor volume (GTV) is defined as the gross palpable or visible/demonstrable extent and location of malignant growth. Regions of macroscopic lymphadenopathy and metastases are included as the GTV.6 The GTV is the volume that is most commonly defined by the radiation oncologist and is based on imaging, clinical examination, and clinical reports. In clinical prac-tice today, the localization of the GTV is performed manually on CT images by the radiation oncologist.
The clinical target volume (CTV) is the tissue volume that contains a demonstrable GTV and/or subclinical microscopic malignant disease, which has to be eliminated. This volume has to be treated adequately in order to achieve the aim of therapy, cure, or palliation.6 The margin required to account for microscopic spread in individual patients is unknown. In practice, margins, typically in the order of 0.5 to 1.0 cm may be used, depending on the primary tumor type and staging. Such estimates have been based on a limited number of reports in which histopathologic analysis of surgical specimens has been conducted. In non-small cell lung cancers (NSCLC), two reports comparing CT-based GTVs with histopathology suggest that a margin between 0 and 12 mm be added to the CT-based GTV to generate the CTV.8,9 In the head and neck region, a 1-cm margin around nodal GTV has been recommended for N1 high-risk nodes, based on dissection of cervical nodes that demonstrated extracapsular microscopic extension ranging from 0.4 to 9.0 mm.10
The internal margin (IM) is used to account for expected physiologic movements and variations in size, shape, and position of the CTV during therapy. These movements and changes may be a result of respiration, variations in organ filling, and cardiac motions.7 The internal target volume (ITV) is defined as the volume encompassing the CTV and the IM. Since conventional therapeutic radiation is delivered over many minutes per fraction and over many days, the ITV represents the volume through which the CTV may move internally over the course of therapy. It should account for all anatomic and physiologic sources of intra- and interfraction motion.
The planning target volume (PTV) is a geometric concept and “it is defined to select appropriate beam sizes and arrangements, to ensure that the prescribed dose is actually delivered to the CTV.”6 This is the volume that should receive the high radiation dose or prescribed dose. It encompasses the ITV plus an additional margin to account for setup uncertainties in treatment delivery. Setup uncertainties may include daily variations in beam placement relative to anatomy, systematic geometric errors in transfer of plan data to the delivery system, and uncertainties in overall patient anatomy. All these factors contribute to random and/or systematic setup errors. The application of daily image verification or IGRT through the technologies such as EPIDs, ultrasound, kVCT, and MVCT in the treatment room is a strategy that attempts to minimize these uncertainties and allow the reduction of the setup margin required for the PTV.11
In contrast to the PTV, both the GTV and CTV are purely oncologic volume concepts. Of these two, only the GTV is demonstrable through the aid of imaging, clinical examination, and/or other medical procedures. Yet evidence of, location of, and extent of the GTV cannot always be determined accurately from these sources and often information from these various sources can be conflicting or equivocal. The accuracy required for individual targets is not precisely known. The ICRU 24 report recommends that radiation planning and delivery should strive for an overall dose and spatial accuracy of 5% and 5 mm, respectively.12 The experience from radiobiology and radiation therapy has provided evidence to support the importance of delivering the full prescription dose to the entire target volume. Based on controlled animal experiments, the steepness of dose-response curves for tumor control suggests that up to 8% change in tumor control can be measured per 100 cGy change in delivered dose near the 50% control level.13 This implies that if a significant portion of the GTV receives less dose, local control might not be achieved. Clinically, Stewart and Jackson reported significant changes in recurrence rate as well as normal tissue toxicity of stage 3 laryngeal tumors when the dose was changed by 5.14 This older report was based on large field, non-conformal techniques, where the tolerances for spatial inaccuracies were relatively large. If an overall treatment delivery goal of 5-mm spatial accuracy is to be obtained, accuracy in the single step of target localization must be less than 5 mm. In view of today’s decreasing margins for tighter conformality, this objective of better than 5-mm spatial accuracy in target definition and the rational for it must always be considered.
LIMITATIONS OF CT-SIMULATION ALONE
With the invention of the CT scanner by Sir Godfrey Hounsfield in 1972, it was recognized early on that CT imaging would have a major impact on radiation therapy planning.15,16 When scanned with the patient in radiation treatment position, CT provides the anatomy, geometry, spatial information, and electron-density information required for all aspects of radiation therapy planning. The process of scanning patients for the purposes of radiation therapy planning is referred to as CT-simulation and much has been published on this technology.17–19 For localization of tumor and normal tissues, CT provides 3D anatomic information with excellent spatial and good low-contrast resolution. CT also provides the geometry and spatial accuracy required for precision conformal planning and dose calculations. Furthermore, the linear relationship between CT numbers or Hounsfield units (HUs) and relative electron densities provides tissue heterogeneity information necessary for accurate therapeutic dose calculations.
With the advent of CT-simulation in the early 1990s, target localization evolved from simple 2D portal designs relative to bony landmarks on radiographic simulation films to direct defining of soft tissue targets on 3D CT datasets. CT-simulation and the ability to define a target directly in three dimensions was a major technologic advancement that launched the era of 3DCRT and IMRT. CT provides anatomic data with diagnosis based on morphology and physical abnormalities. Unfortunately, the sensitivity and specificity of CT for distinguishing between normal and neoplastic tissues is limited in certain clinical structures.20 MRI is another anatomic imaging modality and is based on the measurement of proton densities. In many clinical sites, MRI is superior to CT in terms of its ability to draw distinctions between various soft tissues (i.e., better low-contrast resolution). MRI, when co-registered with CT-simulation images, has been shown to be useful in targeting prostate, brain tumors, sarcomas, and head and neck cancers (HNC).21,22 However, as with any anatomic imaging modality, MRI measures a physical property (e.g., proton density) and diagnosis with MRI is based primarily on abnormal morphology and size. It, too, is limited in sensitivity and specificity for numerous solid tumors.
Many solid tumors, for which dose escalation techniques with 3DCRT and IMRT can be theoretically effective, develop within soft tissues and are often surrounded by normal soft tissues of similar density. The densities of many tumors are similar to those of soft tissues, both residing within a limited range of approximately — 150 to 100 HU for CT as illustrated in Figure 4-2. This similarity makes the distinction between the boundaries of a tumor from the surrounding normal tissue difficult. This is a major source of uncertainty in the localization of the GTV when using CT images. Without pathologic confirmation, it is unclear with any imaging modality that the image-based volumes defined by radiation oncologists correspond to the true GTV. This similarity in density also leads to significant intra- and interobserver variability. Unfortunately, there is no explicit allowance for physician uncertainty in the ICRU definition of the GTV, CTV, or PTV. The current process of 3DCRT and IMRT assumes that the GTV or CTV is correct without questions and no margin is added to explicitly account for its uncertainty. Some have recommended the incorporation of interobserver variation and physician uncertainty in a separate margin while others have proposed standardization in methods of target outlining.23,24 There is currently no consensus on this issue, and as such, this uncertainty is generally ignored in clinical practice. For certain clinical scenarios, the uncertainty in the size, shape, and location of the GTV based on CT may be the largest contributor to geometric uncertainty in the entire process of radiation planning and delivery. Interobserver variability alone in GTV definition has been shown to exceed the margins used to generate the PTV for a number of tumor sites.2,25–27 There have been numerous reports in the literature on the magnitude of this problem. Variation as much as 1.5 cm in the craniocaudal direction in the definition of the prostate among various observers has been reported.28,29 In defining GTV for head and neck cancers, Rasch and colleagues measured agreement (using concordance index) among four observers and six patients. They found that when using CT, the agreement was 0.1 to 0.5, while the agreement with MRI was slightly better ranging between 0.4 and 0.6.30 A concordance index of 1 would represent perfect agreement. In a prospective study of 30 patients with stage II and III NSCLC, Caldwell and colleagues reported a mean ratio of largest to smallest GTV volume of 2.5 with a range between 1.06 and 7.66, based on CT among three expert observers.2 Reviewing the available literature, Weiss and Hess concluded that interobserver variability on GTV and CTV definition “is a major—for some tumor locations probably the largest—factor contributing to the global uncertainty in radiation treatment planning.”1 The variability was attributed to the choice of imaging modality as well as the observers themselves. Observer variability will be discussed in more detail later in this chapter.

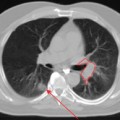
The inclusion of macroscopic lymphadenopathic regions into the GTV is essential in the pursuit of local control. With anatomic imaging, the diagnosis of involved nodes is based on size and known patterns of spread. For example, in staging of NSCLC, the primary criterion for determining whether a node is suspicious or not, is a diameter > 1 cm on CT. However, size should not be the only criterion by which lymphadenopathy is diagnosed, since nodes < 1 cm can be involved. Gupta and colleagues demonstrated that of 53 small nodes, being those < 1 cm in diameter, surgically removed from 54 patients, 17 (32%) were positive by histology.31 It was demonstrated that while CT would label these small nodes as negative, PET imaging captured all 17 small nodes.
Physiologic motion presents another limitation of CT for precision radiation therapy. For most clinical sites, quiet respiration is the preferred respiratory condition for radiation therapy scanning as this scenario best mimics the respiratory status and geometry of the patient during the minutes required to deliver therapeutic radiation. In clinical practice, it is assumed that the CT images under quiet respiration represent the time-averaged position of a tumor. However, for tumors with extensive motion due to respiration, or cardiovascular activity, such as those in the lung and upper abdomen, helical CT scanning under quiet respiration may not capture a time-averaged position, nor does it capture the stationary shape of the tumor.32,33 Moving objects can appear severely distorted in 3D image reconstruction since helical CT is essentially a 2D imaging modality with data acquired for different slices at different times. This inability of helical CT to either capture the extent of motion or freeze all motion, leads to uncertainty in size, shape, and location of moving tumors as well as uncertainty in the appropriateness of symmetrical or population-based margins to account for motion. Helical CT simulation provides no information on the motion extent or the position in the respiratory cycle of individual tumors.
Recently, respiratory-gated or 4DCT has been developed to address the issue of tumor motion. For radiation therapy planning, the addition of respiratory-gated CT allows one to produce four-dimensional (4D) CT images with accurate and precise temporal resolution. A 4DCT dataset essentially contains sets of CT images with each set reconstructed from the same phase of the breathing cycle. Together all the sets form a complete dataset over all phases of the breathing cycle. When viewed in cine mode over all phases, the result is a planar CT-based fluoroscopy showing anatomy and the tumor moving throughout the breathing phases. It must be noted, however, that 4DCT works best for “welldefined” tumors. If a tumor is embedded in normal tissue or an area of collapsed lung, 4DCT is unlikely to be of help. Commercial 4DCT applications are currently available with the major vendors of multislice CT scanners, although the clinical application of this technology is not widely implemented in clinical practice to date. The principles of 4DCT are beyond the scope of this chapter; the reader is referred to the literature for details.34,35
POTENTIAL OF PET FOR BIOLOGICAL TARGET VOLUME
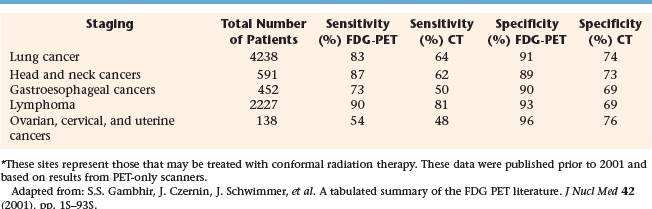
Unlike CT, PET provides biochemical or functional information in vivo, and in the case of FDG-PET, metabolic information. FDG-PET has been shown to have greater sensitivity and specificity compared to CT or MRI for many solid tumors. Table 4-1 extracts some of the findings from a tabulated summary of the literature up to the year 2000 on PET sensitivity and specificity for staging of cancers that can be imaged with FDG and those that are generally treated with conformal radiation therapy.36 For staging of lung, HNC, gastrointestinal (esophageal, in particular), and gynecologic cancers as well as lymphomas, PET demonstrated greater sensitivity and specificity compared to CT in an analysis based on total patient studies. These earlier reports based on PET-only scanners suggest that, for HNC staging, PET did not represent a significant improvement over CT. However, as combined PET-CT scanners become more available, imaging with combined modality scanners may further improve sensitivity and specificity as demonstrated for HNC staging.37 In an editorial, Gregoire discussed the impact of sensitivity and specificity of an imaging modality on radiation targeting.38 If the objective for a particular plan is to avoid by any means the geographic miss of tumor cells, then the use of a highly sensitive modality for targeting is preferred. This associated risk is the inclusion of some non-neoplastic tissue for those regions that may be false-positive. Conversely, if the objective is to minimize the inclusion of any normal tissue within the target, then the use of a highly specific modality is preferred at the risk of excluding false-negative regions.38 Therefore for conformal radiation therapy of tumors within the lung, head and neck region, gynecologic organs, as well as possibly esophagus, and lymphomas, the greater sensitivity of PET over CT suggests that PET for targeting may aid in reducing the risk of geographic miss of the primary tumor as well as regions of lymphadenopathy. Simultaneously with better specificity, targeting with the aid of PET can potentially minimize the volume of normal tissue that must be included in the PTV.
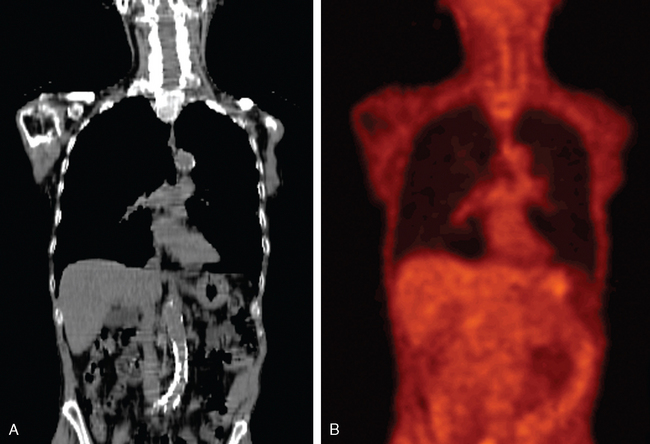
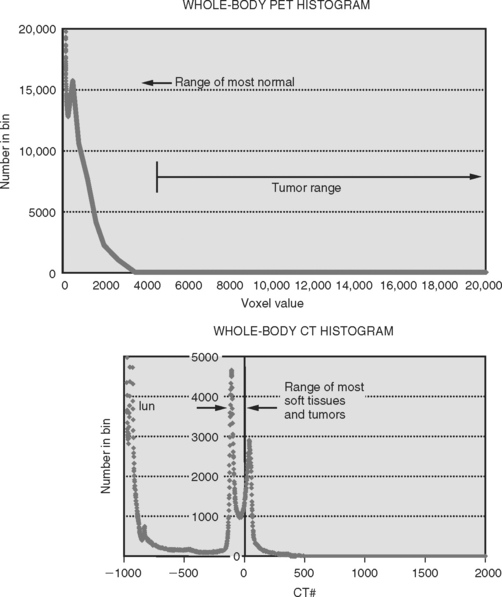
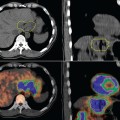
PET images are high contrast images with low background signals. As such, FDG-avid regions are readily visualized, not obscured by the background. The high contrast property of PET images may aid in distinguishing tumor boundaries from normal tissues. As a general rule of thumb, PET abnormal regions will have uptake levels that are at least twice that of background. The activity-related values measured in primary tumors can be one to two orders of magnitude greater than those measured in surrounding normal tissues. Present-day PET technology can detect a difference in activity of 3600 Bq/mL, which corresponds to a difference in molar concentration of fluorine-18 of approximately 5.6 × 10218.39 This high sensitivity for small differences in FDG uptake allows observers to quickly visualize the extent of disease in whole body scans. Figures 4-3A and B illustrate the difference in whole body CT and PET images, respectively. Figures 4-3C and D compare the distribution of voxel or intensity values for all tissues measured in a whole body CT with those from a whole body FDG-PET scan. With the exception of normal lung tissue and cortical bone, CT values for all tissues as well as the tumor are interspersed over a narrow range of values, approximately —150 to 100 HU. Conversely in PET images, with the exception of the bladder, the normal tissues are associated with values of < 3000 while the neoplastic tissues have higher values. Note that these values are pertinent to this example only. The quantitative value recorded in the image files will depend on various factors including the injection process, the PET scanner, the reconstruction algorithm, and various patient-related factors. With a distinct separation of activity values for non-neoplastic compared to neoplastic tissues, PET images can help distinguish tumor boundaries from the surrounding normal tissues that are generally not FDG-avid.
Unlike the seconds to sub-second acquisition times of CT, PET images are acquired over minutes. Furthermore PET images can be acquired in true 3D volumetric mode, rather than 2D at a time as in single-slice CT. Physiologic motions such as those associated with lung tumors therefore present a different challenge for PET imaging. There have been two approaches reported in the literature to quantifying motion with PET. Both methods are currently investigational. Caldwell and colleagues proposed a relatively simple idea of measuring motion by taking advantage of the longer acquisition times. Depending on the PET scanner, coin cident photons are measured over a range of 1 to 5 minutes per table position. Hence, PET images are not only high contrast but are time-averaged over numerous respiratory and cardiac cycles. They have investigated the use of an appropriate threshold to define the motion extent of a moving object.32 Using phantoms with moving spheres containing a positron emitter, these authors determined that a threshold of 15% relative to the maximum intensity could predict the motion volume through which the sphere moved. Although validated only in phantoms to date, it was a proof of principle that still requires clinical validation. If successful, the volume defined could be used to represent a volume similar in concept to the ITV.
An alternative approach, similar to the concept of 4DCT, has been described. By the addition of respiratory gating during image acquisition, Nehmeh and colleagues developed a reconstruction technique that sorts the measured coincident signal according to respiratory phase.40 Reconstruction of data from a single phase results in a “snapshot” of the respiratory cycle and the compilation of image sets from each phase results in a 4DPET dataset. A 4DPET dataset will provide information on the spatial movement of the biochemically active regions with physiologic motions.
FDG-PET also has great potential in monitoring tumor response to therapies. Studies have shown that FDG-PET, with its high sensitivity, can differentiate between viable residual disease and therapy-induced fibrosis. In some cases, the response can be seen as early as a few weeks into treatment. Quantitative assessment of therapy-induced changes may allow for early predication of tumor response and ultimately outcome, potentially allowing oncologists to adjust a course of therapy depending on individual response. The re-evaluation of the target size and response during a course of treatment could lead to adjustments in radiation portals or may serve as a “new” target for boosting the radiation dose. A review of the current literature suggests that residual FDG uptake post-chemotherapy and/or post-chemoradiotherapy may have prognostic relevance in lung, lymphoma, cervix, and possibly in esophagus and head and neck cancers.41
Not only does PET have the potential to improve the efficacy of existing therapies through more accurate targeting and staging, it can aid in the quantitative analysis of outcome as well as play a major role in the development of novel cancer therapies. Clinically to date, PET images are generally used purely in a qualitative fashion, as yet another image to look at. However with its unrivaled sensitivity and ability to monitor pharmacokinetics, the great potential of PET may lie in its ability to quantify biochemical processes in vivo. As such, much research effort has now focused on PET for quantifying molecular mechanisms in oncology and it will likely be one of the most important molecular imaging modalities of the future. The inherent sensitivity is unrivaled and consequently, it can image molecular interactions and pathways, providing quantitative kinetic information down to the sub-picomolar level.42
In the future, the ability of PET to provide information on tumor biology may contribute to the development of a biological target volume, a new opportunity to define radiation target volumes beyond an “all or none” concept.3 With new radiotracers, PET imaging has the potential to identify sub-populations of cells within distinct regions of atumor, allowing radiation oncologists to differentially and optimally dose to these sub-targets in an effort to improve local control. With advances in detector technology and radiochemistry, the future should see exciting new radiotracers that will target specific biological processes with better resolution than currently available. A number of new radiotracers that may prove useful for radiation targeting will be discussed later in the chapter.
PET-CT SCANNING FOR TARGETING
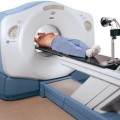
One of the most important process changes is the essential collaboration between radiation oncology, nuclear medicine, and radiology professionals. In the past, direct interactions between professionals within these fields were limited. However, the full benefit of PET in radiation oncology cannot be realized without the joint expertise of these disciplines during all phases of the process; patient preparation, scanning, and image interpretation. The PET scanner, whether it be a PET-only or a combined PET-CT unit may be physically located in the nuclear medicine, medical imaging, or radiation oncology departments. The CT-simulator, though generally located in the radiation oncology department, may also reside in the medical imaging department. Irrespective of the location of these scanners, it is essential that patients be scanned in the identical treatment position. This requires that radiation therapists work closely with nuclear medicine and other imaging technologists to ensure correct and reproducible patient position.
Patient Preparation and Positioning
In preparation for PET scanning, most patients are asked to fast for a minimum of 6 hours prior to FDG injection to reduce competition for glucose transporters. Special considerations and instructions may be given to those patients who are diabetic. At Sunnybrook Health Sciences Centre, patients are also asked to follow a high-protein, low-carbohydrate diet in the 24 hours prior to injection in an attempt to minimize FDG uptake by the myocardium. Although some suggest longer fasting periods, it has been shown that FDG uptake can still occur even after 8 hours of fasting.43 All patients are asked to refrain from strenuous exercise in the 24 to 48 hours prior to injection, to avoid physiologic uptake in recovering muscles. On the day of scanning, patients may be asked to wear warm clothing, particularly around the neck and shoulders, to prevent FDG uptake in brown adipose tissue in the neck and upper torso, as well as to prevent shivering and subsequent intercostals muscle uptake. Some sites recommend wrapping the patient in pre-warmed blankets prior to FDG administration. The amount of FDG injected can range from 185 MBq to 740 MBq depending on patient weight and PET scanner crystal detection type. Post-injection, the patient reclines or rests between 30 minutes to 2 hours prior to imaging and may be discouraged from speaking or moving about during this period. Immediately before scanning, all patients are asked to urinate. In some cases, particularly when disease in suspected in the pelvic region, catheterization may be performed to completely empty the bladder. In keeping with the ALARA (as low as reasonably achievable) principle of radiation protection, it is prudent to ensure that the facility where the patient rests has limited public access. Local regulations must be considered when designing any PET facility.44
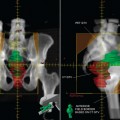
Most other aspects of patient preparations for “PET-simulation” differ to those for diagnostic imaging. The use of these images for accurate target localization requires that the patient be scanned in treatment position with all immobilization devices in place. As such, radiation therapists, or more ideally the same radiation therapist(s), should position and set up the patient for all imaging sessions to be used for targeting. PET images acquired for diagnosis or staging purposes with the patient in non-therapy position should not be used for direct target localization as current commercial fusion algorithms cannot perform image warping and/or contorting, software tools will be necessary should the shape, size, and location of the patient differ between modalities. The reader is referred to Chapter 3 for details and limitations of fusion techniques. Prior to any radiation therapy “simulation” imaging, PET or CT, immobilization devi-ces should be manufactured and patient reference marks (e.g., tattoos) should be established. In most scenarios and particularly if separate CT and PET scanners are to be used, the process of CT-simulation should be performed first so that patient position, immobilization, and treatment reference marks are established on the CT-simulator prior to PET imaging. It is important to ensure that the immobilization devices do not contain any metallic components as these will produce CT artifacts and potentially impact the accuracy of the CT-based attenuation correction procedure used with combined PET-CT units.45
Stay updated, free articles. Join our Telegram channel

Full access? Get Clinical Tree


