and Laurence Loeuillet2
(1)
Centre d’échographie Ambroise Paré, Les Mureaux, France
(2)
Hôpital Cochin, Paris, France
Table 8.1
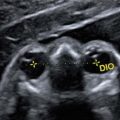
Measurements of biparietal diameter
(SA ± 3J) | BIP p3 | BIP p10 | BIP p50 | BIP p90 | BIP p97 |
|---|---|---|---|---|---|
11 | 12.08 | 13.12 | 15.36 | 17.60 | 18.63 |
12 | 15.81 | 16.96 | 19.40 | 21.81 | 22.92 |
13 | 19.47 | 20.71 | 23.30 | 25.92 | 27.12 |
14 | 23.05 | 24.36 | 27.14 | 29.92 | 31.23 |
15 | 26.56 | 27.93 | 30.89 | 33.82 | 35.23 |
16 | 29.97 | 31.41 | 34.53 | 37.62 | 39.08 |
17 | 33.32 | 34.85 | 38.12 | 41.35 | 42.87 |
18 | 36.55 | 38.15 | 41.58 | 44.97 | 46.56 |
19 | 39.76 | 41.46 | 45.00 | 48.52 | 50.18 |
20 | 42.85 | 44.56 | 48.22 | 51.90 | 53.64 |
21 | 45.86 | 47.66 | 51.43 | 55.23 | 57.00 |
22 | 48.79 | 50.61 | 54.53 | 58.44 | 60.30 |
23 | 51.63 | 53.48 | 57.51 | 61.54 | 63.45 |
24 | 54.38 | 56.31 | 60.42 | 64.57 | 66.50 |
25 | 57.04 | 59.00 | 63.25 | 67.48 | 69.42 |
26 | 59.62 | 61.64 | 65.94 | 70.24 | 72.27 |
27 | 62.12 | 64.15 | 68.35 | 72.92 | 75.00 |
28 | 64.50 | 66.61 | 71.03 | 75.52 | 77.60 |
29 | 66.84 | 68.98 | 73.50 | 77.97 | 80.09 |
30 | 69.07 | 71.21 | 75.80 | 80.37 | 82.52 |
31 | 71.22 | 73.39 | 78.00 | 82.63 | 84.80 |
32 | 73.30 | 75.49 | 80.16 | 84.80 | 87.00 |
33 | 75.24 | 77.46 | 82.14 | 86.84 | 89.04 |
34 | 77.14 | 79.36 | 84.07 | 88.80 | 91.00 |
35 | 78.94 | 81.14 | 85.90 | 90.61 | 92.83 |
36 | 80.64 | 82.88 | 87.61 | 92.35 | 94.56 |
37 | 82.27 | 84.50 | 89.24 | 93.97 | 96.19 |
38 | 83.78 | 86.00 | 90.70 | 95.42 | 97.66 |
39 | 85.22 | 87.43 | 92.10 | 96.86 | 99.05 |
40 | 86.57 | 88.78 | 93.45 | 98.13 | 100.31 |
41 | 87.00 | 89.00 | 94.00 | 99.00 | 101.00 |
Biparietal Diameter (Snidjers)
Table 8.2
Normal range for biparietal diameter (mm)
Gestational age range (weeks + days) | Biparietal diameter (mm) | ||
|---|---|---|---|
5th centile | Median | 95th centile | |
14 + 0–14 + 6 | 28 | 31 | 34 |
15 + 0–15 + 6 | 31 | 34 | 37 |
16 + 0–16 + 6 | 34 | 37 | 40 |
17 + 0–17 + 6 | 36 | 40 | 43 |
18 + 0–18 + 6 | 39 | 43 | 47 |
19 + 0–19 + 6 | 42 | 46 | 50 |
20 + 0–20 + 6 | 45 | 49 | 54 |
21 + 0–21 + 6 | 48 | 52 | 57 |
22 + 0–22 + 6 | 51 | 56 | 61 |
23 + 0–23 + 6 | 54 | 59 | 64 |
24 + 0–24 + 6 | 57 | 62 | 68 |
25 + 0–25 + 6 | 60 | 66 | 71 |
26 + 0–26 + 6 | 63 | 69 | 75 |
27 + 0–27 + 6 | 66 | 72 | 78 |
28 + 0–28 + 6 | 69 | 75 | 81 |
29 + 0–29 + 6 | 72 | 78 | 85 |
30 + 0–30 + 6 | 74 | 81 | 88 |
31 + 0−31 + 6 | 77 | 83 | 90 |
32 + 0–32 + 6 | 79 | 86 | 93 |
33 + 0–33 + 6 | 81 | 88 | 96 |
34 + 0–34 + 6 | 83 | 90 | 98 |
35 + 0–35 + 6 | 85 | 92 | 100 |
36 + 0–36 + 6 | 86 | 94 | 102 |
37 + 0–37 + 6 | 87 | 95 | 103 |
38 + 0–38 + 6 | 88 | 96 | 104 |
39 + 0–39 + 6 | 89 | 97 | 105 |
Table 8.3
Measurements of cephalic perimeter
(SA±3J) | PC p3 | PC p10 | PC p50 | PC p90 | PC p97 |
|---|---|---|---|---|---|
11 | |||||
12 | |||||
13 | |||||
14 | |||||
15 | |||||
16 | 105.80 | 110.58 | 120.86 | 131.25 | 136.11 |
17 | 118.67 | 123.78 | 134.49 | 145.38 | 150.39 |
18 | 131.08 | 136.36 | 147.55 | 158.92 | 164.11 |
19 | 143.00 | 148.53 | 160.29 | 172.14 | 177.48 |
20 | 154.53 | 160.21 | 172.47 | 184.86 | 190.54 |
21 | 165.41 | 171.49 | 184.21 | 197.12 | 203.09 |
22 | 176.12 | 182.35 | 195.74 | 208.91 | 215.15 |
23 | 186.32 | 192.31 | 206.64 | 220.26 | 226.76 |
24 | 196.19 | 203.00 | 217.18 | 231.39 | 238.00 |
25 | 205.50 | 212.40 | 227.32 | 241.91 | 248.81 |
26 | 214.44 | 221.57 | 236.72 | 252.00 | 259.23 |
27 | 222.87 | 230,33 | 246.00 | 261.75 | 269.13 |
28 | 231.00 | 238.56 | 254.77 | 271.00 | 278.57 |
29 | 238.40 | 246.35 | 263.00 | 279.71 | 287.56 |
30 | 245.86 | 253.74 | 270.84 | 288.13 | 296.00 |
31 | 252.54 | 260.81 | 278.33 | 296.00 | 304.27 |
32 | 258.86 | 267.22 | 285.29 | 303.54 | 312.00 |
33 | 264.62 | 273.38 | 292.00 | 310.40 | 319.10 |
34 | 270.14 | 279.00 | 298.10 | 317.00 | 325.91 |
35 | 275.33 | 284.23 | 303.62 | 323.00 | 332.16 |
36 | 279.79 | 289.00 | 308.81 | 328.75 | 338.00 |
37 | 283.90 | 293.32 | 313.52 | 334.00 | 343.34 |
38 | 287.63 | 297.29 | 317.88 | 338.64 | 348.29 |
39 | 290.88 | 300.76 | 321.86 | 343.00 | 352.67 |
40 | 293.00 | 303.00 | 324.00 | 346.00 | 356.00 |
41 |
Table 8.4
Normal range for head circumference (mm)
Gestational age range (weeks + days) | Head circumference (mm) | ||
|---|---|---|---|
5th centile | Median | 95th centile | |
14 + 0–14 + 6 | 102 | 110 | 118 |
15 + 0–15 + 6 | 111 | 120 | 129 |
16 + 0−16 + 6 | 120 | 130 | 140 |
17 + 0–17 + 6 | 130 | 141 | 152 |
18 + 0–18 + 6 | 141 | 152 | 164 |
19 + 0–19 + 6 | 151 | 163 | 176 |
20 + 0–20 + 6 | 162 | 175 | 189 |
21 + 0–21 + 6 | 173 | 187 | 201 |
22 + 0–22 + 6 | 184 | 198 | 214 |
23 + 0–23 + 6 | 195 | 210 | 227 |
24 + 0–24 + 6 | 206 | 222 | 240 |
25 + 0–25 + 6 | 217 | 234 | 252 |
26 + 0–26 + 6 | 227 | 245 | 264 |
27 + 0–27 + 6 | 238 | 256 | 277 |
28 + 0–28 + 6 | 248 | 267 | 288 |
29 + 0–29 + 6 | 257 | 277 | 299 |
30 + 0–30 + 6 | 266 | 287 | 309 |
31 + 0–31 + 6 | 274 | 296 | 319 |
32 + 0–32 + 6 | 282 | 304 | 328 |
33 + 0–33 + 6 | 288 | 311 | 336 |
34 + 0–34 + 6 | 294 | 317 | 342 |
35 + 0–35 + 6 | 299 | 323 | 348 |
36 + 0–36 + 6 | 303 | 327 | 353 |
37 + 0–37 + 6 | 306 | 330 | 356 |
38 + 0–38 + 6 | 308 | 332 | 358 |
39 + 0–39 + 6 | 309 | 333 | 359 |

Table 8.5
Normal range for transverse cerebellar diameter (mm)
Gestational age range (weeks + days) | Transverse cerebellar diameter (mm) | ||
|---|---|---|---|
5th centile | Median | 95th centile | |
14 + 0–14 + 6 | 12 | 14 | 15 |
15 + 0–15 + 6
Related posts:Stay updated, free articles. Join our Telegram channel
Full access? Get Clinical Tree
 Get Clinical Tree app for offline access

| |||