BMI is widely used in clinical trials because it is effectively free and proportional to whole-body percent fat by other methods. Flegal and colleagues [2] found that BMI, waste circumference, and waist–stature ratio were all highly correlated to percent body fat measured by dual-energy X-ray absorptiometry (DXA). The following are more complex models created by further subdividing body mass into compartments.
Two-Compartment Model
One of the simplest model used for body composition assessment is one that assumes that the body is divided in two compartments: fat mass (FM) and fat-free mass (FFM). Assuming that each of these compartments has a constant and uniform density (i.e., ~0.9 g/cm3 for FM and 1.1 g/cm3 for FFM), hydrodensitometry (underwater weighing) can be used to measure the whole-body density of an individual, and from this information the relative contribution of FM and FFM to total body weight can be calculated [3]. For example, the equation by Brozek and colleagues [4] has been widely used to convert body density into percent body fat:
![$$ \%\kern0.24em Body\kern0.24em fat=\left[\frac{4.57}{ Total\kern0.24em body\kern0.24em density}-4.142\right]\times 100 $$](/wp-content/uploads/2016/08/A160853_1_En_12_Chapter_Equb.gif)
![$$ \%\kern0.24em Body\kern0.24em fat=\left[\frac{4.57}{ Total\kern0.24em body\kern0.24em density}-4.142\right]\times 100 $$](/wp-content/uploads/2016/08/A160853_1_En_12_Chapter_Equb.gif)
For the most part underwater weighing has been replaced by a technique called air displacement plethysmography (ADP) using a device called the BOD POD (Life Measurement Inc., Concord, CA, USA). Hydrodensitometry uses water displacement to measure body volume; the BOD POD uses air displacement within a sealed chamber. BOD POD is a broadly used clinical technique and is in use at research, clinical, and physical fitness facilities. Both BOD POD and hydrodensitometry assume a hydration constant of 0.723 to convert body density to % body fat. However, hydration can vary from person to person and by disease state. The compartment models including a direct measure of water were developed to control for hydration status.
Three Compartment, Model 1
Initially, three compartment models were developed as extensions to the two-compartment models described previously. Body weight was divided into fat, water, and water-free lean (i.e., mineral and protein) [3]. The total body water measure is added to body density for this model. The advantages are that hydration status can change over time due to exercise, age, and disease state. The current gold standard method to measure total body water is the stable isotope dilution technique. A tracer, in these cases either deuterium (2H) or oxygen-18 (18O), is dissolved in the body by taking a drink of water that contains one of these stable isotopes. The tracer then distributes and reaches an equilibrium state throughout the body. A sample can then be taken of body water from saliva, urine, or blood, and by measuring the ratio of water containing the tracer to water, the total water volume can be determined. The limitations of this technique are that equilibrium typically takes 3–4 h and that protein is lumped with bone mineral. Thus, it is difficult to extract changes in protein from changes in bone and these changes are often coupled.
Three Compartment, Model 2 Using DXA
An alternative to the first three-compartment model described earlier is the use of DXA to measure three independent compartments. DXA defines the composition of the body as three materials having specific X-ray attenuation properties: bone mineral, lipid (triglycerides, phospholipid membranes, etc.), and lipid-free soft tissue. The term fat is commonly used to refer to adipose tissue. However, adipose tissue contains lipid-free mass such as water and proteins as well. Fat is best described chemically as the lipids in our body that are soluble in organic solvents and not in water, the largest category of body fat being triglycerides found in adipocytes. In this model, the non-lipid soft tissue mass is the sum of body water, protein, and soft tissue mineral mass. For each pixel in a DXA image, lipid, bone mineral, and soft tissue lean masses are being quantified. However, the distribution of the lipid, bone mineral, and non-lipid soft tissue within the volume projected onto the image pixel is not known. This model forces all tissue types into these three components. For example, the distinction between subcutaneous and visceral adipose tissue is lost for trunk measurements when both are projected in the same pixels. The same is true for skin, visceral non-adipose tissue, and muscle when all are projected in the same pixels. This limitation is true for most composition models that cannot represent the body as a true 3-dimensional volume. DXA systems are described in more detail in the later section.
Four-Compartment Model
The four-compartment model divides the body into the major molecular compartments of bone mineral, water, lipid, and protein:


All but approximately 1 % of total body mass can be put into one of these molecular categories. The measures needed are body density using hydrodensitometry or air plethysmography, bone mineral content by DXA, and total body water. This model is considered by many to be the gold standard measure of total body composition, but it is rarely used in clinical trials because of the need for three measurement techniques and the length of time needed to acquire the water measure. In many studies, percent body fat using the three-compartment DXA model has been shown to be highly correlated to the full four-compartment model percent fat. Van Der Ploeg and colleagues [5] found the correlation to be r 2 = 0.95.
Tissue and Organ Compartment Models
If the composition or volume of an organ is needed independently of the surrounding tissue, a 3-dimensional imaging method, such as computed tomography (CT) or magnetic resonance imaging (MRI), is required. Three-dimensional (3D) imaging allows for organs to be isolated, slice by slice, through the volume from surrounding tissues. CT and MRI are the only methods that can isolate visceral fat from subcutaneous fat, muscle cross-sectional area from intramuscular adipose, and liver volume from other viscera as examples. The limitations to MRI and CT are that the access is limited, the scans are expensive in comparison to other methods, and, in the case of CT, significant dose is received by the participant.
Adipose Tissue
Adipose tissue is made up of lipid (85 %), proteins, minerals (3 %), and water (12 %) [6, 7] resulting in a physical density of approximately 0.92 kg/l. It is important to note that DXA, by definition, specifically measures the mass of total lipid, not adipose tissue. However, most researchers are interested in metabolic function. Adipose can be segregated anatomically to study its metabolic function. Adipose tissue is, in many cases, studied in terms of sub-compartments since many diseases are related to particular sub-compartments and not others. For example, visceral adipose is more strongly related to diabetes and cardiovascular disease than subcutaneous adipose. Table 12.1 is a summary of the subdivisions of adipose. Total AT can be measured by DXA, while the subdivisions of adipose can only be measured using CT or MRI. An example of a CT image showing superficial and deep subcutaneous adipose tissue is shown in Fig. 12.1a, b.
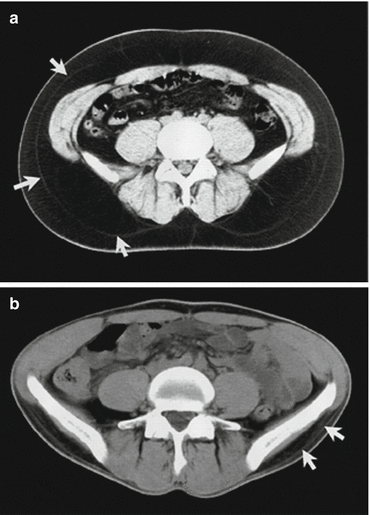
Table 12.1
Proposed classification of total body adipose tissue
AT component | Definition |
|---|---|
Total AT | Sum of adipose tissue, usually excluding bone marrow and adipose tissue in the head, hands, and feet |
Subcutaneous AT (SAT) | The layer found between the dermis and the aponeuroses and fasciae of the muscles. Includes mammary adipose tissue |
Superficial subcutaneous AT | The layer found between the skin and a fascial plane in the lower trunk and gluteal–thigh area |
Deep subcutaneous AT | The layer found between the muscle fascia and the fascial plane in the lower trunk and gluteal–thigh areas |
Internal AT | Total adipose tissue minus subcutaneous adipose tissue |
1. Visceral AT (VAT) | Adipose tissue within the chest, abdomen, and pelvis |
2. Nonvisceral internal AT | Internal adipose tissue minus visceral adipose tissue |
(a) Intramuscular AT | Adipose tissue within a muscle (between fascicles) |
(b) Perimuscular AT | Adipose tissue inside the muscle fascia (deep fascia), excluding intramuscular adipose tissue |
(i) Intermuscular AT | Adipose tissue between muscles |
(ii) Paraosseal AT | Adipose tissue in the interface between muscle and bone (e.g., paravertebral) |
(c) Other nonvisceral AT | Orbital adipose tissue; aberrant adipose tissue associated with pathological conditions (e.g., lipoma) |

Fig. 12.1
(a, b). Abdominal axial CT scans of an obese (a) and a thin subject (b). Subcutaneous adipose tissue is divided into superficial and deep subcutaneous adipose tissue by a fascial plane, as indicated by the white arrows. It is unlikely that DXA could be used to discern superficial from deep SAT (Used with permission from Shen et al. [8])
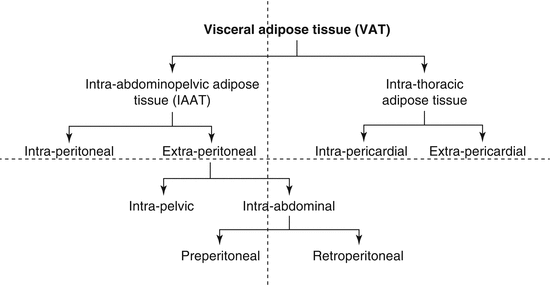
Visceral adipose fat can be further subdivided. Visceral or organ adipose tissue (VAT) is found in all three body cavities: intrathoracic (ITAT), intra-abdominal (IAAT), and intrapelvic (IPAT). However, most investigators report VAT as IAAT or the sum of IAAT and IPAT. The tree in Fig. 12.2 is a breakdown of the terminology proposed by Shen and colleagues for visceral adipose tissue components [8].
Subcutaneous Adipose Tissue (SAT)
SAT in the lower trunk and gluteal–thigh region can be subdivided into superficial and deep subcutaneous adipose tissue separated by a fascial plane (Table 12.1). Deep SAT is located primarily in the posterior half of the abdomen, while superficial SAT is more evenly distributed around the abdominal circumference [8, 9]. Differences have been reported between these two adipose tissue layers [8, 10–12]. Deep SAT has shown robust correlations to insulin resistance in both men and women, while superficial SAT showed little or no association [9]. Thus, the measure of SAT without distinction to these subcomponents dilutes the relationship. Furthermore, since whole-body DXA scans cannot discern the separating facial plane and the fact that the superficial and deep SAT overlap each other in DXA images, the ability of DXA to discern either component uniquely is unlikely.
SAT in the abdomen was examined in the Hill study outlined previously. The correlations of total abdominal SAT-defined CT area versus DXA were found to be r = 0.788, while simple hip circumference [13] was r = 0.826. Thus, there was no benefit by measuring SAT with DXA compared with the relatively simple hip circumference measure.
Body Composition Compartments and Measures
There are common terms used by many techniques to describe body composition. The truly independent values reported are relatively few. They are listed here.
Adipose Cross-Sectional Area (CSA)
The measure of adipose tissue is delineated within a CT or MRI slice using image segmentation. Subcutaneous and visceral adipose CSA are examples and are usually represented in cm2.
Adipose or Organ Volume
Adjacent CT or MRI slices can be summed to create a volume of similar tissue. The volume of each slice is determined by the organ CSA and the thickness of the slice. Slice thicknesses typically range from 1 to 10 mm. Subcutaneous adipose or visceral can be summed in the abdomen region to create a total abdominal visceral and subcutaneous volume. The units of measure are typically cm3.
Bone Mineral Content (BMC)
The mineral mass component of bone is called BMC. It is typically represented as hydroxyapatite, Ca10(PO4)6(OH)2. The units for BMC are typically grams. BMC is equivalent to the ashed weight of a bone sample and does not contain any mass of from the organic components of the bone (marrow, collagen, etc.). BMC can be defined using either DXA or CT but not MRI.
Fat Mass (FM)
Fat mass is generally defined as the mass that can be extracted using ether or other solvents from soft tissue. However, the definition can be confusing when looking between techniques. For example, DXA and CT (attenuation mode) cannot distinguish between the ether-extracted triglycerides and lipid membranes and connective tissue. Thus, DXA and CT will be influenced by the total lipid mass. FM is measured in either grams (g) or kilograms (kg).
Lean Soft Tissue Mass (LSTM)
Bone-free, fat-free soft tissue mass is the sum of all soft tissue lean, essentially water, protein, soft tissue mineral, and glycogen. It is measured in units of g or kg. This term is usually used for DXA whole-body scans.
Fat-Free Mass (FFM)
Fat-free mass is the sum of all the non-body lipid, such that


Soft Tissue Mass (STM)
Soft tissue mass is the sum of lean soft tissue and fat masses:


Total Body Mass (TBM)
Total body mass is the equivalent measure to scale weight, typically represented in units of kg or gm. In terms of the above,


TBM accuracy can be assessed against a calibrated scale. Studies that have investigated the agreement between scale mass and DXA total mass have found excellent agreement.
Percent Fat Mass (PCTFM)
Percent fat mass is a region’s fat mass divided by the region’s total mass times 100:


Dual-Energy X-Ray Absorptiometry
For body composition, a DXA instrument scans the entire body using a dual-energy scanning protocol. The scan takes approximately 5 min and is considered lose dose. The test–retest precision is very high, 1.0 % or better standard deviation for repeat scans on the same individual for percent fat mass. In addition, DXA can report fat, lean soft tissue, and bone mineral mass compartments for anatomical subregions such as the arms, legs, and torso. For these reasons, DXA has been used in many clinical trials. The limitation to the DXA three-compartment model is that water is not explicitly solved for and changes in hydration can be interpreted as a change in the function lean tissue, such as protein. In addition, water is found in both adipose and parenchymal tissues. Monitoring change in muscle mass is confounded if adiposity also changes. DXA is a special imaging modality that is not typically available on general use X-ray systems because of the need for special beam filtering and near-perfect spatial registration of the two attenuations. Dedicated commercial DXA systems were first available in the late 1980s [14]. See Chap. 1.
The primary commercial application for DXA has been used to measure bone mineral density as an assessment of fracture risk and to diagnose osteoporosis, and the X-ray energies used are optimized for bone density assessment. For osteoporosis diagnosis, the lumbar spine, proximal hip, and sometimes the distal forearm are scanned. The regions of interest (ROIs) used and the diagnostic criteria are well defined. The whole body can also be scanned to measure whole-body bone mass and soft tissue body composition [15, 16]. For image areas that contain only soft tissue, lipid and lean tissue can be assessed [17], from which percent lipid mass can be calculated, while areas that contain bone use an estimated percent lipid from the surrounding tissue [18]. Reference populations have been scanned and defined by sex, ethnicity, and age. Diagnosis of disease is typically undertaken by comparing individuals to their peer group or to a young healthy population. Currently there are estimated to be over 50,000 whole-body DXA systems in use worldwide.
Why Use DXA for Clinical Trials Instead of Other Body Composition Methods?
The only imaging methods that can accurately estimate regional bone, fat, and lean soft tissue mass distributions are DXA, CT, and MRI. DXA is low dose in comparison to whole-body CT scanning and inexpensive compared to MRI. In addition, DXA %fat measures are more precise than is typical with CT and MRI. Lastly, DXA is easily tied to physical standards that are verifiable in the field, such as stearic acid and water, such that cross-calibration and pooling of data across clinical centers are possible. However, there are important limitations. First, DXA systems measure bone density in units of grams per unit area since it does not have the ability to measure tissue thickness. Thus, DXA systems cannot tell the difference between thick low-density bone and thin high-density bone. Secondly, DXA can only solve for two materials simultaneously. This is a fundamental theorem of X-ray absorptiometry since the attenuation characteristics of any one material can be represented by combining two other materials together in the appropriate way [19]. Thus, soft tissue composition can only be solved in areas exclusive of bone, and bone mass can only be determined with an assumption of the soft tissue composition overlaying the bone. Since bone is contained in typically 40 % or more of the body image pixels, the soft tissue composition has to be estimated from surrounding tissue. In some cases, accurate estimates cannot be made, such as the head, hands, feet, and upper torso because there is no adequate soft tissue outside the bone projection and manufacturers turn to proprietary methods to reference the soft tissue. Third, there is a lack of standardization in the measured values. For example, the differences in BMC between the two largest manufacturers, Hologic (Hologic, Inc., Bedford, MA, USA) and GE Lunar (GE Healthcare, Madison, WI, USA) systems, are approximately 20 %. Equations have recently been published that provide a means of converting Hologic to GE measures and vice versa [20].
The cross-calibration relationships were derived in over 200 individuals ranging in age from 6 to 81 years. Care must be exercised though when using the equations in Table 12.2 since these equations were derived for specific software versions.
Table 12.2
Cross-calibration relationships for bone and soft tissue whole-body values. GE = “GE Healthcare Lunar”
Variables | Cross calibration equation (≤40 kg) | Cross calibration equation (>40 kg) | r 2 (pooleddata) |
|---|---|---|---|
BMD | GE = 0.052 + 0.975 × BMDHologic − (1.169E-6) × LSTMHologic − (1.651E-6) × TOT_FATHologic | GE = −0.148 + 0.986 × BMDHologic + (2.462E-06) × LSTM Hologic + (2.906E-06) × TOT_FATHologic | 0.96 |
Hologic = 0.024 + 0.826 × BMDGE + (3.47E-6) × LSTMGE + (1.17E-6) × TOT_FATGE | Hologic = 0.204 + 0.907 × BMDGE − (1.33E-6) × LSTMGE − (2.62E-6) × TOT_FATGE | ||
BMC | GE = −123.517 + 0.891 × BMCHologic + 0.013 × LSTMHologic + 0.007 × TOT_FATHologic | GE = 5.9797 + 0.843 × BMCHologic + 0.012 × LSTMHologic − 0.001 × TOT_FATHologic | 0.99 |
Hologic = 134.166 + 1.035 × BMCGE − 0.010 × LSTMGE − 0.009 × TOT_FATGE | Hologic = 3.741 + 1.085 × BMCGE − 0.009 × LSTMGE + 0.001 × TOT_FATGE | ||
SubBMD | GE = −0.034 + 1.183 × SubBMDHologic − (4.395E-06) × LSTMHologic − (7.820E-07) × TOT_FATHologic | GE = −0.218 + 1.133 × SubBMDHologic + 8.276E-07 × LSTMHologic + 3.209E-06 × TOT_FATHologic | 0.97 |
Hologic = 0.054 + 0.748 × SubBMDGE + (5.32E-06) × LSTMGE + (6.118E-07) × TOT_FATGE | Hologic = 0.219 + 0.810 SubBMDGE + (9.334E-08) × LSTMGE − (2.71E-06) × TOT_FATGE | ||
SubBMC | GE = −164.957 + 0.893 × SubBMCHologic + 0.012 × LSTMHolohic + 0.007 × TOT_FATHologic | GE = −21.31 + 0.883 × SubBMCHologic + 0.009 × LSTMHologic − 0.001 × TOT_FATHologic | 0.99 |
Hologic = 164.144 + 1.038 × SubBMCGE − 0.009 × LSTMGE − 0.008 × TOT_FATGE | Hologic = 13.428 + 1.016 × SubBMCGE − 0.006 × LSTMGE + 0.001 × TOT_FATGE | ||
PFAT | GE = −2.173 + 1.119 × PFATHologic | 0.97 | |
Hologic = 1.943 + 0.894 × PFATGE | |||
TM
Stay updated, free articles. Join our Telegram channel
Full access? Get Clinical Tree
 Get Clinical Tree app for offline access

| |||
