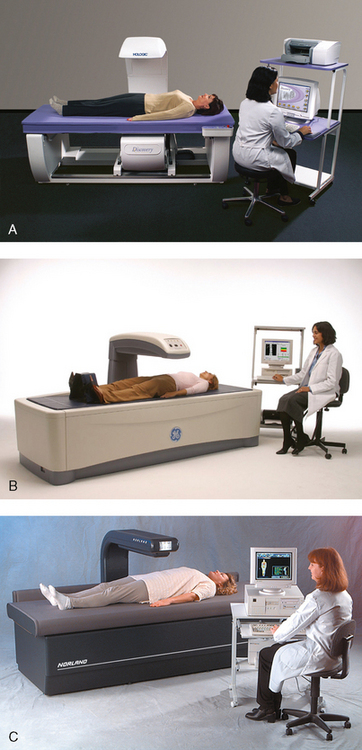
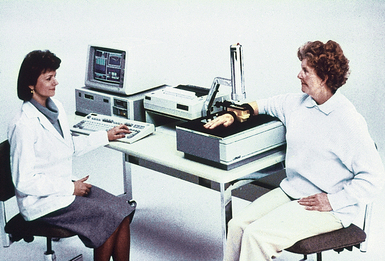
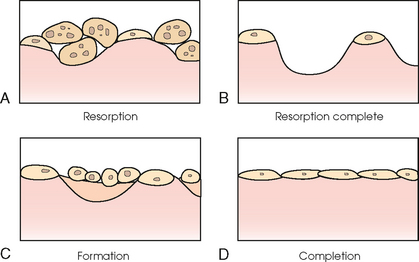
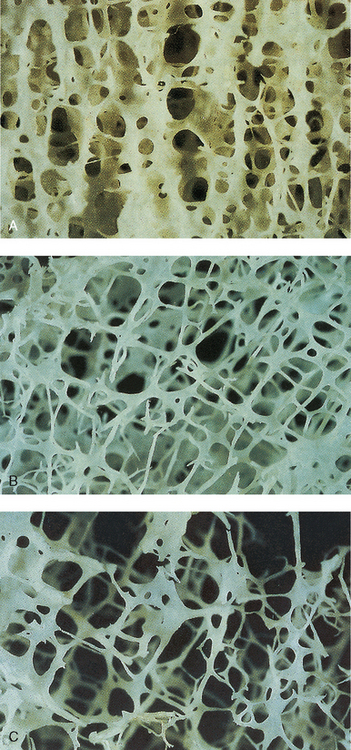
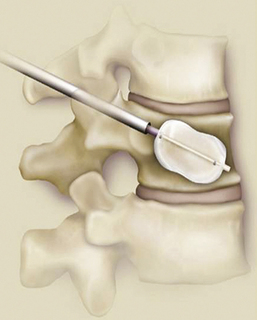
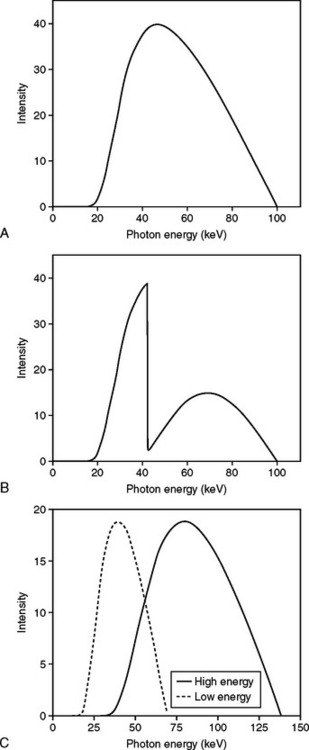
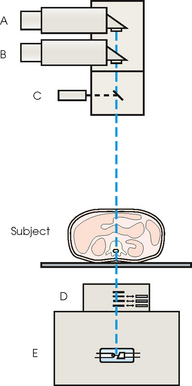
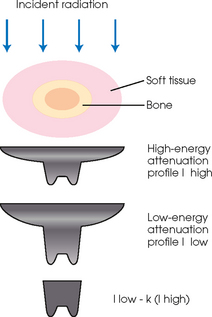
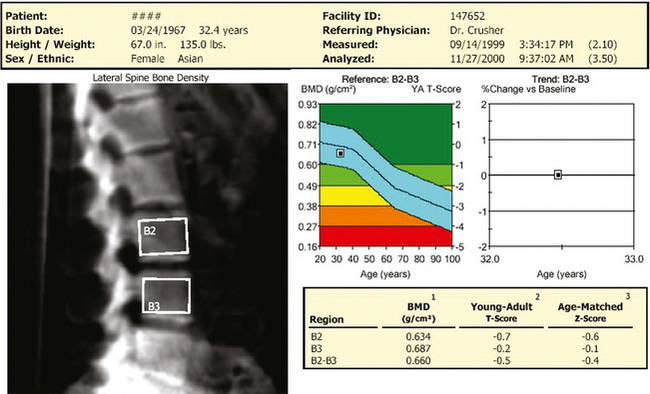
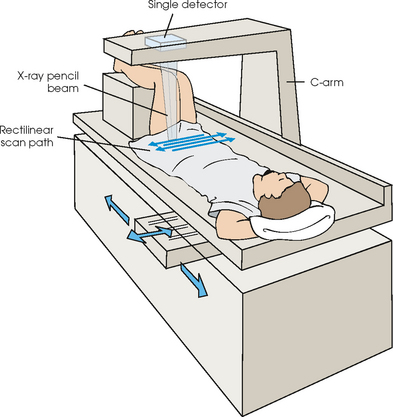
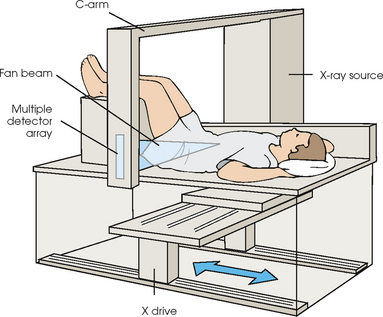
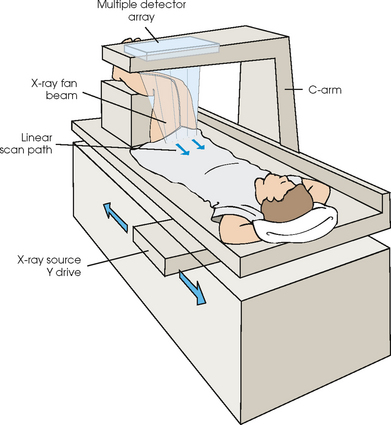
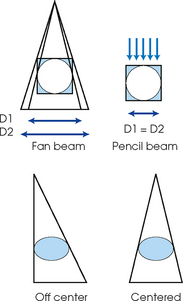
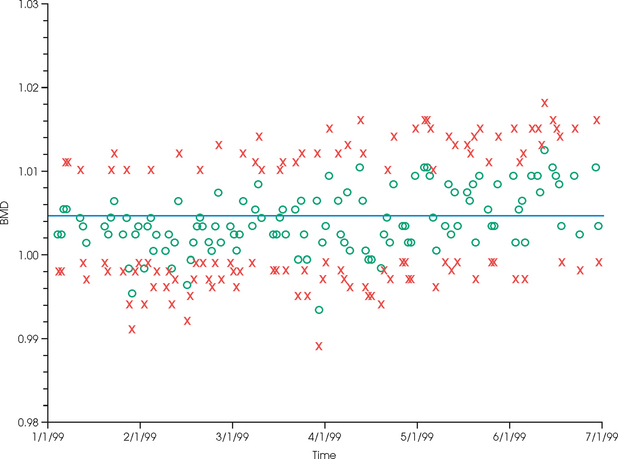
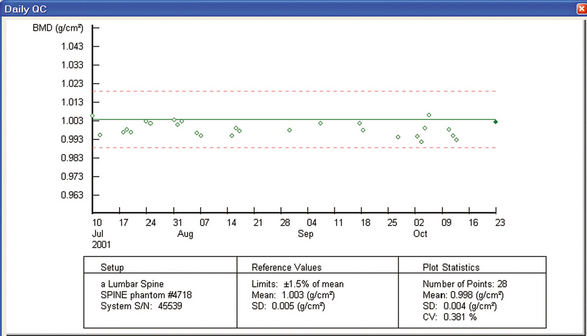
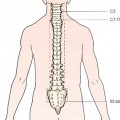
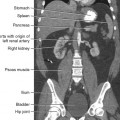
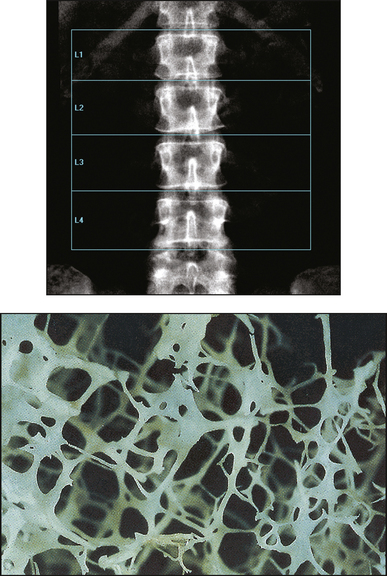
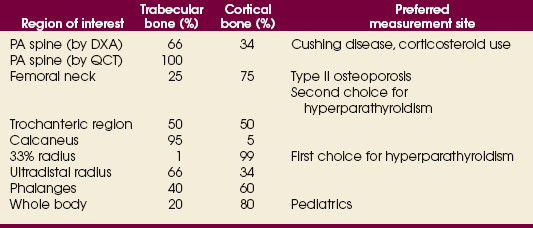
35 Bone densitometry* is a general term encompassing the art and science of measuring the bone mineral content (BMC) and bone mineral density (BMD) of specific skeletal sites or the whole body. The bone measurement values are used to assess bone strength, assist with diagnosis of diseases associated with low bone density (especially osteoporosis), monitor the effects of therapy for such diseases, and predict risk of future fractures. Several techniques are available to perform bone densitometry using ionizing radiation or ultrasound. The most versatile and widely used is dual energy x-ray absorptiometry (DXA) (Fig. 35-1).1 This procedure has the advantages of low radiation dose, wide availability, ease of use, short scan time, high-resolution images, good precision, and stable calibration. DXA is the focus of this chapter, but summaries of other procedures are also presented. The differences between DXA and conventional radiography are as follows: 1. DXA can be conceptualized as a subtraction technique. To quantitate BMD, it is necessary to eliminate the contributions of soft tissue and measure the x-ray attenuation of bone alone. This is accomplished by scanning at two different x-ray photon energies (hence the term dual energy x-ray) and mathematically manipulating the recorded signal to take advantage of the differing attenuation properties of soft tissue and bone at the two energies. The density of the isolated bone is calculated on the basis of the principle that denser, more mineralized bone attenuates (absorbs) more x-ray. Having adequate amounts of artifact-free soft tissue is essential to help ensure the reliability of the bone density results. 2. The bone density results are computed by proprietary software from the x-ray attenuation pattern striking the detector, not from the scan image. Scan images are only for the purpose of confirming correct positioning of the patient and correct placement of the regions of interest (ROI). The images may not be used for diagnosis, and any medical conditions apparent on the image must be followed up by appropriate diagnostic tests. The referring and interpreting physicians must be skilled in interpreting the clinical and statistical aspects of the numeric density results and relating them to the specific patient. 3. In conventional radiography, x-ray machines from different manufacturers are operated in essentially the same manner and produce identical images. This is not the case with DXA. Three major DXA manufacturers are in the United States (see Fig. 39-1), and technologists must be educated about the specific scanner model in their facility. The numeric bone density results cannot be compared between manufacturers without proper standardization. This chapter presents general scan positioning and analysis information, but the manufacturers’ specific procedures must be used when actual scans are performed. 4. The effective radiation dose for DXA is considerably lower than the radiation dose for conventional radiography. The specific personnel requirements vary among states and countries. All bone density technologists should be instructed in core competencies, including radiation protection, patient care, history taking, basic computer operation, knowledge of scanner quality control, patient positioning, scan acquisition and analysis, and proper record keeping and documentation. In the late 1970s, the emerging technique of computed tomography (CT) (see Chapter 31) was adapted, through the use of specialized software and reference phantoms, enabling quantitative measurement of the central area of the vertebral body, where early bone loss occurs. This technique, called quantitative computed tomography (QCT), is still used. The first scanners dedicated to bone densitometry appeared in the 1970s and early 1980s. Single photon absorptiometry (SPA) (Fig. 35-2) and dual photon absorptiometry (DPA) are based on physical principles similar to those for DXA. The SPA approach was not a subtraction technique but relied on a water bath or other medium to eliminate the effects of soft tissue. SPA found application only in the peripheral skeleton. DPA used photons of two energies and was used to assess sites in the central skeleton (lumbar spine and proximal femur). The radiation source was a highly collimated beam from a radioisotope (125I [iodine-125] for SPA and 153Gd [gadolinium-153] for DPA). The intensity of the attenuated beam was measured by a collimated scintillation counter, and the bone mineral was quantified. The skeleton serves the following purposes: • Supports the body and protects vital organs so that movement, communication, and life processes can be carried on • Manufactures red blood cells • Stores the minerals that are necessary for life, including calcium and phosphate The two basic types of bone are cortical (or compact) and trabecular (or cancellous). Cortical bone forms the dense, compact outer shell of all bones and the shafts of the long bones. It supports weight, resists bending and twisting, and accounts for about 80% of the skeletal mass. Trabecular bone is the delicate, latticework structure within bones that adds strength without excessive weight. It supports compressive loading in the spine, hip, and calcaneus, and it is also found at the ends of long bones, such as the distal radius. The relative amounts of trabecular and cortical bone differ by bone densitometry technique used and anatomic site measured (Table 35-1). TABLE 35-1 Data from Bonnick SL: Bone densitometry in clinical practice: application and interpretation, Totowa, NJ, 1998, Humana Press. Humana Press Bone is constantly going through a remodeling process in which old bone is replaced with new bone. With this bone remodeling process (Fig. 35-3), the equivalent of a new skeleton is formed about every 7 years. Bone-destroying cells called osteoclasts break down and remove old bone, leaving pits. This part of the process is called resorption. Bone-building cells called osteoblasts fill the pits with new bone. This process is called formation. The comparative rates of resorption and formation determine whether bone mass increases (more formation than resorption), remains stable (equal resorption and formation), or decreases (more resorption than formation). When the cycle becomes uncoupled, the result is a net loss of bone mass. Some reasons for uncoupling are enhanced osteoclastic recruitment; impaired osteoblastic activity; and increased number of cycles, which results in shorter time for each cycle. The increased number of cycles favors the shorter resorption phase over the longer formation phase. Bone mass increases in youth until peak bone mass is reached at approximately 20 to 30 years of age. This is followed by a stable period in middle age. A period of decreasing bone mass starts at approximately age 50 in women and approximately age 65 in men. The decrease in bone mass becomes pronounced in women at menopause because of the loss of bone-preserving estrogen. If the peak bone mass is low or the resorption rate is excessive, or both, at menopause, osteoporosis may result (Fig. 35-4). • Low body weight (<127 lb [>58 kg]) or low body mass index (BMI) (weight in kg divided by height in meters squared), or both • Family history of osteoporosis or fracture • History of prior fracture as an adult Two points are important to note about osteoporosis. First, an older person with a normal rate of bone loss may still develop osteoporosis if his or her peak bone mass was low. Second, it is a common misconception that proper exercise and diet at menopause prevent bone loss associated with the decrease in estrogen. This is not true. Persons concerned about their risk of osteoporosis should consult their physician. Osteoporosis can be classified as primary or secondary. A DXA scan result should not automatically lead to a diagnosis of primary osteoporosis. Secondary causes of systemic or localized disturbances in bone mass must be ruled out before a final diagnosis can be made. Proper choice of treatment should be based on the type of osteoporosis and the underlying cause, if secondary osteoporosis is present. The choice of skeletal site to measure depends on the disease process, whether it has a predilection for certain types of bone, and the composition of various skeletal sites (see Table 35-1). Several prescription medications arrest bone loss and may increase bone mass, including traditional estrogen or hormone replacement therapies, bisphosphonates, selective estrogen receptor modulators, parathyroid hormone, and calcitonin. Other therapies are in clinical trials and may be available in the future (Table 35-2). The availability of therapies beyond the traditional estrogens has led to the widespread use of DXA to diagnose osteoporosis. • The overall 1-year mortality rate after hip fracture is one in five.1 • Two to three times as many women as men sustain hip fractures, but the 1-year mortality rate for men is twice as high. • Two thirds of patients with hip fracture never regain their preoperative activity status. One fourth require long-term care. • A woman’s risk of hip fracture is equal to her combined risk of breast, uterine, and ovarian cancer. • Protective undergarments with side padding, called hip pads, have proven effective in preventing hip fracture from a fall in elderly adults. Resistance to wearing the garment is the only limitation. Vertebral fractures are the most common osteoporotic fracture, but only approximately one third are clinically diagnosed. The effects of vertebral fractures have traditionally been underestimated but are beginning to be recognized and quantified. These fractures cause pain, disfigurement, and dysfunction and decrease the quality of life. More recent studies link them to an increased risk of mortality. Vertebroplasty is a minimally invasive procedure for managing acute painful vertebral fractures. This procedure involves injecting bone cement into the fractured vertebra under fluoroscopic guidance (see Fig. 24-27). Balloon kyphoplasty is a minimally invasive procedure that can reduce back pain and restore vertebral body height and spinal alignment. This procedure involves reducing the vertebral compression and injecting the cement into this space created within the vertebral body (Fig. 35-5). Fluoroscopic guidance is also used for this procedure. The National Osteoporosis Foundation’s Bone Health and Prevention Recommendations are as follows: • Obtain daily recommended amounts of calcium and vitamin D. • Engage in regular weight-bearing and resistance exercise. • Avoid smoking and excessive alcohol. • Talk to a health care provider about bone health. • Have a bone density test and take medication when appropriate. • Getting adequate levels of calcium and vitamin D • Engaging in physical activity • Reducing hazards in the home that can lead to fractures and falls • Talking with a physician about preventive strategies to promote bone health • Maintaining a healthy weight Many Americans fail to meet currently recommended guidelines for optimal calcium intake. The National Institute of Health Consensus Conference recommends the following calcium intake: 1000 mg/day for women 25 to 50 years old, postmenopausal women on estrogen therapy, and men 25 to 65 years old; 1500 mg/day for postmenopausal women not on estrogen therapy and men older than 65 years. Dietary calcium is the best source including yogurt, milk, and some cheeses. Dietary shortfall should be met with calcium supplements with the USP designation that supply the appropriate amount of elemental calcium. The individual needs to check the number of pills to meet the serving size and whether or not to take with food (Table 35-3). TABLE 35-3 Daily recommended needs for calcium intake *A cup of milk or fortified orange juice has about 300 mg of calcium. From the Office of the Surgeon General’s Report, 2004. GE Lunar and Norland use a rare-earth, filtered x-ray source. The primary x-ray beam is passed through selected rare-earth filters to produce a spectrum with peaks near 40 kiloelectron volts (keV) and 70 keV compared with the usual continuous spectrum with one peak near 50 keV (Fig. 35-6, A and B). Sophisticated pulse-counting detectors are used to separate and measure the low-energy and high-energy photons (Fig. 35-7). Calibration must be performed externally by scanning a calibration phantom on a regular basis. Hologic scanners use an energy-switching system that synchronously switches the x-ray potential between 100 kVp and 140 kVp. This system produces a primary beam with two photon energies with peaks near 40 keV and 80 keV (see Fig. 35-6, C). The energy-switching system continuously calibrates the beam by passing it through a calibration wheel or drum (Fig. 35-8) containing three sectors for an open-air gap, a soft tissue equivalent, and a bone equivalent. Each sector is divided so that it can differentiate and measure the low-energy and high-energy photons. This permits the use of a relatively simple current-integrating detector that does not have to separate the photons. Common physics problems of DXA are as follows: • Beam hardening in energy-switching systems. With increasing body thickness, a higher proportion of low-energy photons are absorbed within the body, shifting the spectral distribution toward high-energy photons. • Scintillating detector pileup in K-edge filtration systems. A detector can process only one photon at a time and assign it to the high-energy or low-energy channel. An incoming photon may be missed if the preceding photon has not yet been processed. Digital detectors do not have this problem. • Crossover in K-edge filtration systems. Some high-energy photons lose energy passing through the body and are counted as low-energy photons by the detector. This problem is solved by subtracting a fraction of the highenergy counts from the low-energy channel, depending on body thickness. The low-energy and high-energy x-rays are attenuated differently within each patient; this produces a unique attenuation pattern at the detector, which is transmitted electronically to the scanner software. Mathematic computations that subtract the soft tissue signals, producing a profile of the bone, are then performed (Fig. 35-9). Proprietary bone edge detection algorithms are next applied, and a two-dimensional area is calculated. The average BMD is calculated for all areas, and finally the BMD is calculated as BMD = BMC II area. The three bone densitometry parameters reported on the DXA printouts are area in centimeters squared (cm2), BMC in grams (g), and BMD in g/cm2. BMD is the most widely used parameter because it reduces the effect of body size. BMD can be calculated if BMC and area are known by the equation BMD × BMC II area. This equation can be used to determine if a change in BMD is due to a change in BMC, area, or both. A decrease in BMC results in a decrease in BMD; conversely, a decrease in area results in an increase in BMD. If BMC and area move proportionally in the same direction, BMD remains unchanged. Generally, a change in a patient’s BMD over time should be from a change in BMC, not area. A change in area could be from the technologist not reproducing the baseline positioning or from a change in the software’s bone edge detection. Changes in area over time should be investigated and corrected, if possible. BMD is based on a two-dimensional area, not a three-dimensional volume, making DXA a projectional, or areal, technique. Techniques to estimate volumetric density from DXA scans have been developed but have not been shown to have any improved diagnostic sensitivity over traditional areal density. Fig. 35-10 shows the lateral spine areal and estimated volumetric BMDs. BMD values from scanners made by different manufacturers cannot be directly compared. Mathematic formulas have been developed, however, for converting BMD from any manufacturer to standardized BMD (sBMD) values that can be compared.1,1 sBMD values are best used for large populations, such as standardizing a reference population database. They must be used with caution for individuals because the sBMD from one manufacturer can vary by 3% to 6% from the sBMD of either of the other manufacturers. For this reason, it is not widely recommended to use sBMD to compare an individual’s scans done on scanners from different manufacturers. The original DXA scanners employed a pencil-beam system. With this system, a circular pinhole x-ray collimator produces a narrow (or pencil-beam) stream of x-ray photons that is received by a single detector. The pencil-beam of x-ray moves in a serpentine (also called rectilinear or raster) fashion across or along the length of the body (Fig. 35-11). This system has good resolution and reproducibility, but the early scanners had relatively long scan times of 5 to 7 minutes. The pencil-beam system may still be in use but is no longer manufactured (N. Fagan, personal communication, August 2009). The array-beam (also called fan-beam) system has a wide “slit” x-ray collimator and a multielement detector (Fig. 35-12). The scanning motion is reduced to only one direction, which greatly reduces scan time and permits supine lateral lumbar spine scans to be performed (Fig. 35-13). The array-beam system introduces geometric magnification and a slight geometric distortion at the outer edges. Consequently, careful centering of the object of interest is necessary to avoid parallax (Fig. 35-14). The software takes into account the known degree of magnification and produces an estimated BMC and estimated area. 1. The mean is commonly called the average. It is the sum of the data values divided by the number of values. 2. The SD is a measure of variability that measures the spread of the data values around their mean. It takes into account the average distance of the data values from the mean. The smaller the average distance or the spread, the smaller the SD. This is the goal in bone densitometry—a smaller SD is better. Fig. 35-15 plots two sets of phantom BMD data measured over 6 months. The means are the same (1.005 g/cm2), but the red data set has an SD that is twice as large as that of the green data set (0.008 g/cm2 vs. 0.004 g/cm2). It is better to have phantom BMD data that look like the green data set. 3. The %CV is a statistic that allows the comparison of variability between different data sets, whether or not they have the same mean. A smaller %CV means less variability and is preferred in bone densitometry. The %CV is calculated using the following equation: In Fig. 35-14, the green data set has a %CV of 0.35, and the red data set has a %CV of 0.81. This is the %CV that must be checked on a Hologic spine phantom plot (Fig. 35-16). The red data set would not pass the criteria that the %CV should be less than or equal to 0.6. The %CV is also used to express precision. Bone densitometry differs from diagnostic radiology in that good image quality, which can tolerate variability in technique, is not the ultimate goal. Instead, the goal is accurate and precise quantitative measurement by the scanner software, which requires stable equipment and careful, consistent work from the technologist. Two important performance measures in bone densitometry are accuracy and precision. Accuracy relates to the ability of the system to measure the true value of an object. Precision relates to the ability of the system to reproduce the same (but not necessarily accurate) results in repeat measurements of the same object. A target may be used to illustrate this point. In Fig. 35-17 A, the archer is precise but not accurate. In Fig. 35-17 B, the archer is accurate but not precise. Finally, in Fig. 35-17 C, the archer is precise and accurate. In vivo precision has two main aspects in bone densitometry:
BONE DENSITOMETRY
Principles of Bone Densitometry
DUAL ENERGY X-RAY ABSORPTIOMETRY AND CONVENTIONAL RADIOGRAPHY
History of Bone Densitometry
Bone Biology and Remodeling
Osteoporosis*
FRACTURES AND FALLS
BONE HEALTH RECOMMENDATIONS
Surgeon General’s Report on Bone Health and Osteoporosis

Physical and Mathematic Principles of Dual Energy X-Ray Absorptiometry
Pencil-Beam and Array-Beam Techniques
ACCURACY AND PRECISION
![]()
Stay updated, free articles. Join our Telegram channel

Full access? Get Clinical Tree


BONE DENSITOMETRY

