Fig. 30.1
A core biopsy specimen of bone marrow edema syndrome (stain, hematoxylin and eosin; original magnification, ×100) shows hematopoietic cells are depleted and fatty cells are necrotic in the marrow. The marrow space is filled with eosinophilic fibrinoid material and trabecular bone appears to be viable
30.4 Clinical Features, Laboratory Findings, and Natural Course
In the ischemic stage, the pain is absent or minimal. During the hyperemic stage, bone marrow pressure is elevated and patients suffer hip pain. Most patients are diagnosed in this hyperemic stage. A severe hip pain usually appears suddenly. In BMES the pressure is usually elevated to higher than 30 mmHg. The elevated bone marrow pressure is the main cause of hip pain [6, 10].
Hematological studies including erythrocyte sedimentation rate, white blood cell count, and C-reactive protein level are normal. The pain improves spontaneously within 6–12 months.
The improvement of pain parallels the normalization of findings on bone scan and MRI, which reflects the resolution of edema.
30.5 Magnetic Resonance Imaging
In the ischemic stage, the only MRI finding is the conversion of hematopoietic marrow to fatty marrow in proximal femoral metaphysis. The signal intensity of the proximal femoral metaphysis is similar to that of the greater trochanter. Otherwise, no abnormal findings are seen on MRI [15].
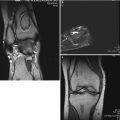
During this hyperemic stage, MRI shows findings of marrow edema in the proximal femur. T1-weighted images reveal a low-signal intensity in the femoral head, femoral neck, and the intertrochanteric region (Fig. 30.2), which changes to a high-signal intensity on the T2-weighted image (Fig. 30.3). No focal lesion suggestive of ON is seen on the MRI scans. Hip joint effusion, which appears as a high-signal lesion on T2-weighted image, is usually seen. The findings on MRI disappear gradually with the resolution of the edema [4–6].
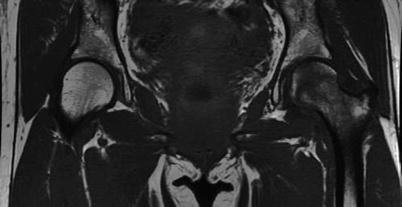
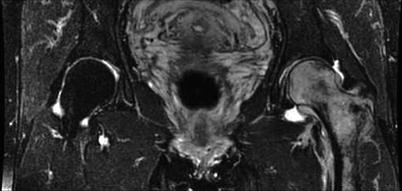
Fig. 30.2
T1-weighted spin-echo image (TR/TE: 549 ms/22 ms) reveals diffuse, low-signal intensity in the left proximal femur
Fig. 30.3
On T2-weighted spin-echo image (TR/TE: 3,337 ms/100 ms), the lesion changes to a high-signal intensity
30.6 Radiographs
In the initial ischemic stage, no abnormal findings are seen on radiographs. The radiographic findings become evident several weeks after the onset of pain. The radiographs show focal loss of radiodensity with blurring of the trabecular structure and cortical borders due to demineralization in the proximal femur. However, subchondral crescent sign (subchondral fracture), femoral head flattening (collapse), and joint space narrowing, which are seen in ON, are not observed in BMES.
The radiolucency on radiographs gradually normalizes with the resolution of the edema.
30.7 Bone Scan
In the hyperemic stage, bone scan reveals an increased uptake involving the entire femoral head and neck often extending to the trochanteric area [4–6]. The uptake is diffuse and homogenous (Fig. 30.4). The improvement of pain parallels the normalization of findings on bone scan, which reflects the resolution of edema.
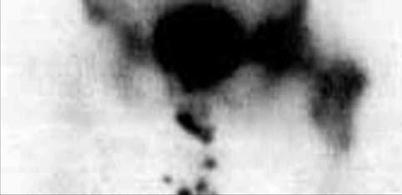
Fig. 30.4


Bone scan shows an increased uptake in the femoral head, neck, and trochanteric region (Permission from Koo et al. [10])
Related posts:
Stay updated, free articles. Join our Telegram channel
Full access? Get Clinical Tree
