Neuroradiology was a relatively unsophisticated branch of imaging prior to 1970. Plain radiographs of the skull were insensitive for predicting neurologic disorders, and obtaining more useful diagnostic imaging information about the brain and spinal cord was cumbersome, painful, and yielded images that were difficult to interpret without advanced knowledge of neuroanatomy. The early brain imaging techniques were at best minimally invasive and many involved such gruesome activities as injecting air into the spinal canal (pneumoencephalography) and rolling the patient about in a specially devised torture chair. Few patients willingly returned for another one of those examinations! The highest level of comfort that the poor patient who needed brain imaging could anticipate was a direct puncture carotid arteriogram or a spinal tap.
The invention and widespread use of the technique of computerized axial tomography (CAT), or computed tomography (CT), allowed relatively painless access to the processes inside the skull and allowed the field of neuroradiology to become a premier subspecialty within radiology. The early CT scanners were slow, lacking in detail, and hard to manage (Fig. 7.1), but they were such a marvelous advance that they were embraced as a revolution in medical imaging. Indeed, Sir Godfrey Hounsfield, the pioneer of CT imaging, won many international awards and was knighted for his work. While magnetic resonance imaging (MRI) advances have supplanted CT in many applications, CT still is the technique of choice for the majority of the diagnostic studies of the brain and spine and is still the most common neuroimaging study performed in the United States. The CT scanners of today are capable of obtaining simultaneous multiple slices documenting cerebral perfusion and with new image processing techniques can produce reconstructed anatomical images in any plane desired. CT scans are routinely performed either with or without intravenous contrast enhancement, and the enhancement produced coupled with the speed of the new scanners makes real-time vascular mapping of the brain a practical clinical tool (Fig. 7.2). Certain clinical indications are generally predictive of the need for iodinated CT contrast, although there are many variations. Table 7.1 gives the usual indications for contrast use; however, if in doubt, radiologists are always available for consultation on individual cases.
In CT scanning, images of the brain are usually acquired in axial (horizontal) planes and then viewed at different digital levels so that one can see the bones of the face and skull as well as the tissues of the brain itself. Two image acquisitions are not required to get these data, but rather, two different levels of viewing the same digital data. The sections that result from the CT scans depict the anatomy at predetermined intervals depending on the parameters of reconstruction of the slices (thickness) and timing of acquisition of the data. Generally, the thicker the slices the fewer the sections needed to get through the brain, but as the slices are thickened, anatomy is depicted in less detail. In the standard brain CT scan, there are several key landmarks to observe for proper orientation. Figure 7.3 illustrates some of the highlights for which you should look in orienting yourself to the anatomy depicted by the slices.
Let’s begin with the caudal sections and work cephalad. The fourth ventricle, a cerebrospinal fluid (CSF) space located dorsal to the brain stem and in the midline of the posterior fossa, is a good marker for identifying the level of the pons, cerebellar vermis, and the base of the anterior cranial fossa (Fig. 7.3A). On the same section lying ventral to the brain stem are the suprasellar cistern and the dorsum sellae. Note that the figures depict the anatomy of the posterior fossa less sharply than some of the more cephalad sections of brain. CT scans in the posterior fossa are often degraded owing to the absorption of x-rays by the large amount of dense surrounding bone; therefore, detail of the cerebellar hemispheres may be obscured. This technique limitation is mitigated to some degree by faster and better scanners, but bone artifact is a limitation of CT scanning.
Proceeding to sections cephalad from the fourth ventricle, one encounters the ambient cistern and cephalad portion of the suprasellar cistern (Fig. 7.3B). The former is an important landmark for the point where the cerebral peduncles (an extension of the brain stem) pass through the tentorium cerebri. Ventral to this landmark and slightly cephalad are located the third ventricle and the anterior horns of the lateral ventricles. At the lateral margins of the anterior horns of the ventricles are the basal ganglia, identifiable as masses of gray matter bordering the lateral and third ventricles (Fig. 7.3C). The caudate nuclei protrude into the anterior horns of the lateral ventricles.
Further cephalad the scans depict the brain cortex and the orderly interfaces between the gray and white matter (Fig. 7.3D). Note that each section of gray matter has an accompanying area of white matter arranged in a predictable pattern. Symmetry is everything in looking at CT scans of the brain. Provided that the patient is properly positioned, structures should match up from side to side.
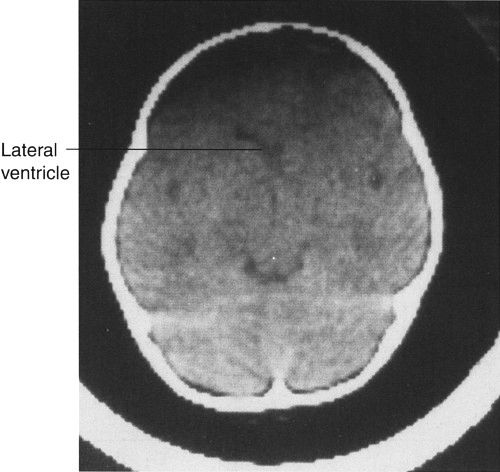
FIGURE 7.1 A scan of the brain performed in 1976 on an EMI device. This single section took about 1 minute to acquire. The coarse pixels make anything but the larger brain structures such as the ventricles difficult to appreciate. This was, however, a huge improvement over the pneumoencephalogram.
Despite its immense success, CT has limitations that inhibit its value. For example, CT is inherently limited in its ability to display high degrees of tissue contrast. If two tissues absorb roughly the same number of photons, even though the tissues may be chemically very different, CT cannot discriminate between them. Bone or other high-density items such as aneurysm clips degrade the CT image. Although the time needed to obtain a section by CT has declined substantially in recent years, there are still physical limitations to CT scanning, and motion artifacts abound in uncooperative or combative patients.

SOME COMMON INDICATIONS FOR CAT SCANNING AND USE OF INTRAVENOUS CONTRAST ENHANCEMENT
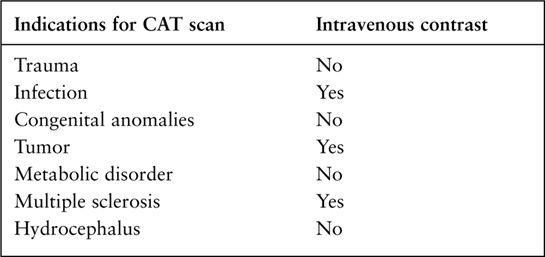
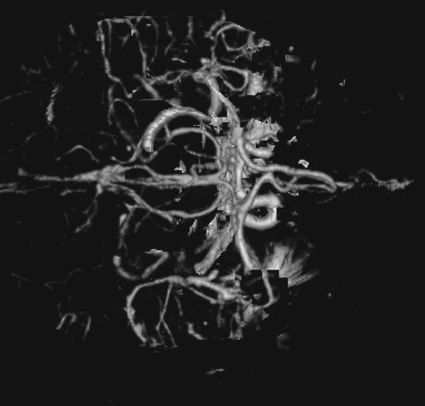
FIGURE 7.2 CT arteriogram of the brain obtained after intravenous contrast shows detail of the intracerebral vessels of the circle of Willis.
The newer major technique in the imaging of the brain and spinal cord is MRI. This technique also had humble beginnings; the first scanners were used to quantify fat in livestock coming to market. MR images are wonderfully detailed and yield unique anatomical and functional data. Generally, the MRI studies require more time and are more expensive to carry out than CT scans. MRI has much better tissue contrast than CT, although special resolution is less. The new imaging sequences and enhanced capabilities of MRI to show metabolic, vascular, and functional changes in tissues suggest that it will ultimately be the imaging modality of choice for many conditions.
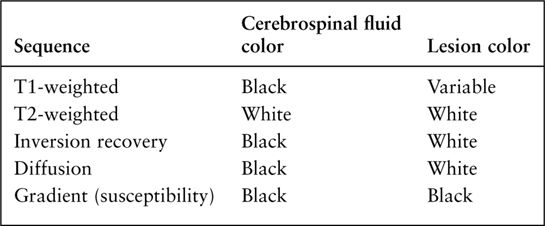
MRI imaging depends on alterations in the physical behavior of protons (hydrogen is the most abundant natural proton in our water-filled tissues) when first magnetized, then exposed to a pulse of radio frequency energy. The major variables are, therefore, the strength of the magnetic field, the ability to apply energy to disrupt magnetic equilibrium (gradient coils) the way the radio frequency waves are applied (pulse sequences). Table 7.2 is a very simplified overview of the current major pulse sequences and the color of lesions and the CSF on the currently used 1.5-tesla MRI scans. There are many exceptions to the data in Table 7.2, and new sequences are rapidly being developed; therefore, this table should be used only as a rough (90% accurate) guideline to get you in the ballpark when looking at MRI images. Despite the great potential of MRI and its progression from a research device in the early 1980s to a staple of most imaging departments in the United States, at present CT scans still provide the bulk of diagnostic brain images. Table 7.3 compares the strengths and limitations of CT and MRI. A series of images showing both sequences and typical anatomic structures are demonstrated. (Fig. 7.4A–C)
Perhaps the most common indication for brain imaging is trauma. Human heads are extremely vulnerable to injury; consequently, the trauma CT scanner rarely lacks sufficient business. In assessing a CT performed for trauma, one has a finite number of search parameters for major findings that represent conditions likely to demand immediate intervention. MRI is excellent for subacute trauma detection, but the speed and availability of CT makes it the usual primary imaging device for trauma patients.
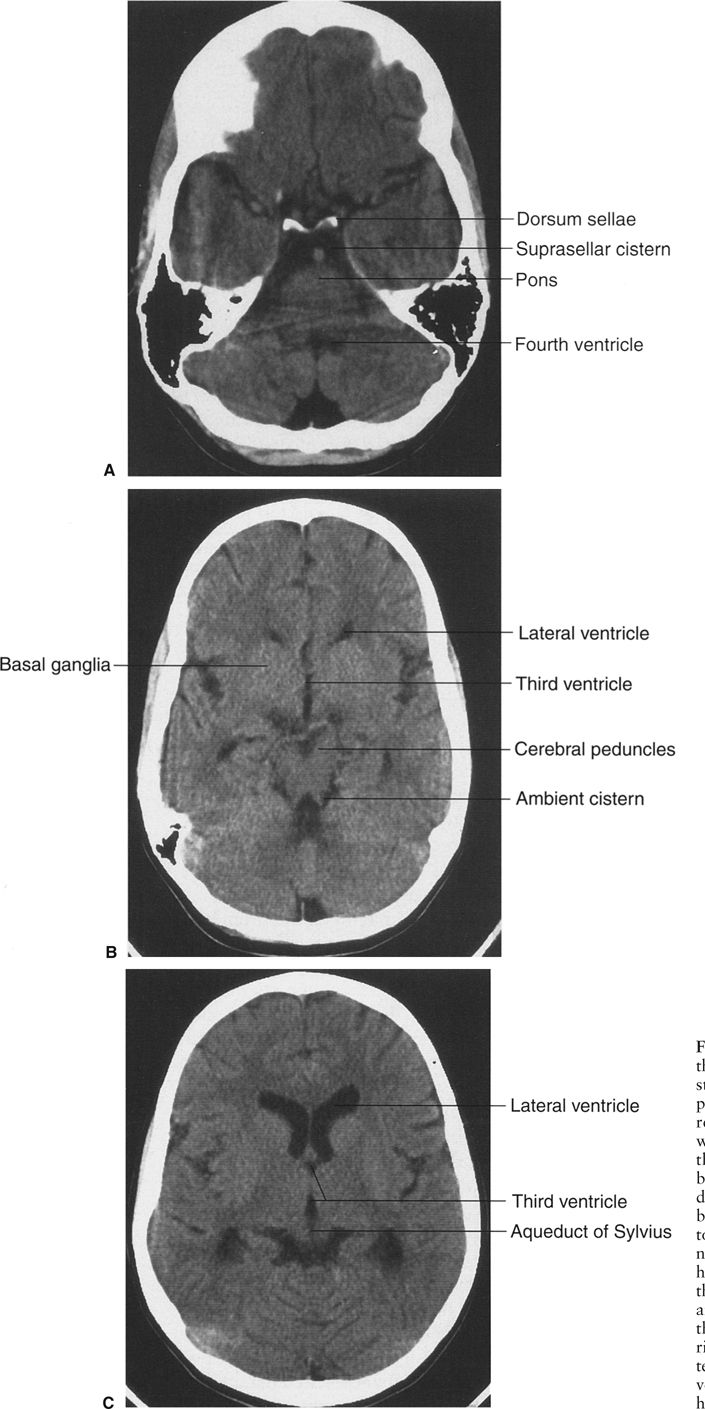

FIGURE 7.3 A: CT scan of a normal adult at the level of the fourth ventricle. The brain stem structure ventral to the fourth ventricle is the pons. Further anterior lies the five-pointed star representing the suprasellar cistern. Lying within the suprasellar cistern are the vessels of the circle of Willis and the dorsum sellae or back of the sella turcica. B: A cut cephalad to A demonstrates the ambient cisterns as curved black cerebrospinal fluid densities just posterior to the cerebral peduncles. If you use your imagination, the cistern is the mouth, the anterior horns of the lateral ventricles the eyes, and the third ventricle the nose of a smiling man! This is an important landmark as it is the point where the cerebral peduncles pass through the tentorium. C: Proceeding cephalad we leave the posterior fossa and image the lateral ventricles, third ventricles, aqueduct of Sylvius, and the cerebral hemispheres. D: A scan near the vertex of the head depicts the white matter (black on CT) and its relationship to the gray matter. Note that each area of gray matter has an associated column of white matter.
The presence of blood in the head but outside the vascular system is often a key to the correct diagnosis. Fortunately, when blood is loose in the head, it usually appears as a conspicuous white blob on the CT scan. Therefore, the first rule of looking at trauma CT scans is to look for the white collections inside the skull (Fig. 7.5). Your diagnosis often can be even more specific because the white (or blood) had characteristic absorption (Hounsfield number) and tends to align in certain predictable ways according to its anatomic location. As an overview, the locations of intracranial bleeding whether by CT or MRI are first separated into intra-axial, meaning within the brain tissues themselves, or extra-axial. The extra-axial hemorrhages occur in spaces with characteristic shapes that can assist in localizing the hemorrhage. Fluid in the epidural space, between skull and dura, usually presents as a crescentic mass, convex to the brain (Fig. 7.6). The subdural space between dura and arachnoid membranes, however, is usually concave to the brain surface, paralleling the surface of the skull; therefore, subdural hematomas are differentiated from epidural bleeding by their shape (Fig. 7.7). Subarachnoid blood diffuses over the surface of the gyri and fills the CSF cisterns around the brain (Fig. 7.8). Intra-axial bleeding is often confined to the area of the ruptured vessel and is entirely enclosed within the substance of the brain. Intraventricular hemorrhage lies within the ventricles, often pooling in the dependent portion of the ventricle to form a blood–CSF level. By first finding the “white” blood, then looking at its shape and anatomic location, one can be pretty precise about the diagnosis and the location of the blood. As the hematoma ages, the blood assumes different image characteristics. Table 7.4 provides a description of the differing appearances of blood in the head with age of the bleed.

MRI PULSE SEQUENCES
After looking for bleeding in trauma patients, the next step is to look for mass effect, a clue that there is pressure impinging on an area of the brain. For most injuries, the best way to find significant mass effects is to look for asymmetry with displacement of the midline structures, the most prominent of which are the falx cerebri, lateral ventricles, and interhemispheric fissure (Figs. 7.6 and 7.9). A midline shift away from a lesion, for example, an epidural blood collection, is usually an emergent situation, particularly in the context of trauma. However, a word of caution is advisable: Midline shift does not always signal a need to take out your pocketknife to perform emergent, kitchen table–type neurosurgery. Diffuse edema of one hemisphere of the brain (Fig. 7.9) or even atrophy of the contralateral hemisphere can cause apparent (or real) shift. The important concept is midline shift. When the brain structures are shifted away from the side of the evident abnormality, such as a hematoma, increase your level of suspicion and urgency in evaluating your patient.

A COMPARISON OF INDICATIONS AND FACTORS AFFECTING THE CHOICE OF CT OR MRI
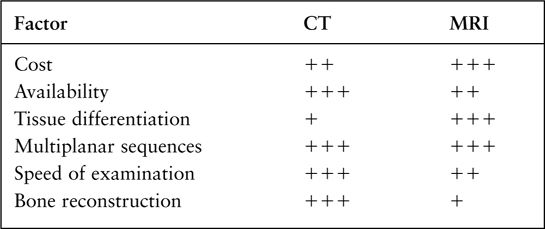
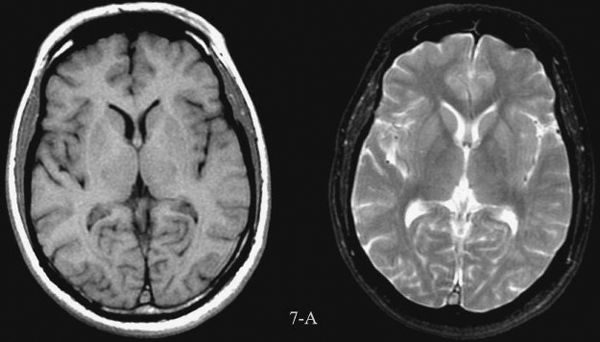
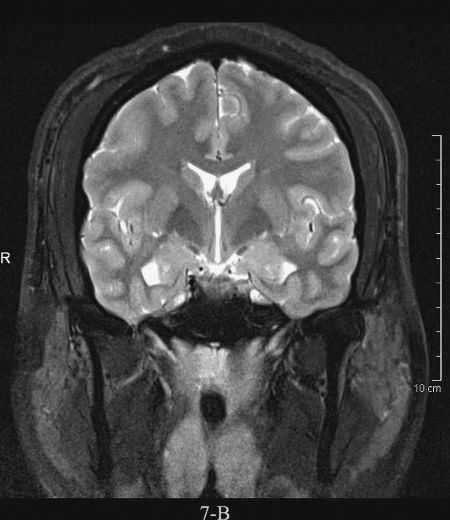
FIGURE 7.4 A: Axial T1-weighted (left) and T2-weighted MRI images at the level of the foramen of Monro. On T1-weighted images, the cerebrospinal fluid in the ventricles is black and on T2-weighted images it is white. Notice the superb anatomical detail, much better than CT. B: Coronal T2-weighted image at the level of the foramen of Monro in the same patients. The anatomical definition rivals that of a brain section in the neuroanatomy laboratory. C: Sagittal midline T1-weighted image of the same patient. The midline structures, face and foramen magnum, are seen in fine detail. Note how well you see the cerebellum and brain stem without the beam hardening artifacts of CT.
After searching for blood and mass effects on the brain CT scan or MRI, the next important step is to assess the densities of the brain tissues themselves. Earlier we described how the gray and white matter components of the brain should be visible on the CT scan (Fig. 7.3D). The lateral ventricles and CSF spaces are black and should be easily distinguished as separate from the tissues of the brain. Variations on this theme are generally bad news. The most prominent and dangerous sign is the obliteration of the distinction between the gray and white matter, which indicates profound edema in the area (get focal edema on MRI). If this is a universal pattern, there is a special name for the profound edema that occurs, obliterating all brain landmarks—the “bad black brain” (Fig. 7.10). This finding usually portends a poor outcome, representing diffuse breakdown of tissue integrity with ensuing cerebral edema. The cause of this catastrophic chain of events is almost always a limitation of the oxygen supply to the brain tissues, owing to either a compromise of the blood supply or a loss of oxygen to the brain cells. In the latter instance, as the brain swells, cerebral blood supply is compromised by loss of the arterial perfusion gradient, and ultimately there is no circulation to the brain. Owing to different tissue densities and less vulnerable perfusion, the basal ganglia and brain stem are often particularly conspicuous against the uniform density of the bad black brain, and their conspicuity results in the so-called reversal sign (Fig. 7.11).
Please note the intentional lack of a detailed discussion of skull fractures in this section on trauma. That is because, in general, skull fractures aren’t very important in the immediate outcome of a patient. It is the effect of the trauma on the brain that does your patient harm, not the crack in the bone (Fig. 7.12). A significant important exception is the depressed skull fracture, a situation in which the bone is driven directly back into the meningeal coverings and the brain itself. CT imaging and bone windows are of great importance in documenting the depth and extent of this type of injury as well as documenting any intracranial air leaks owing to tears of the dura or meninges (Fig. 7.13). In this type of trauma, surgery is usually needed and the identification of the fracture, depth of the fragment(s), surface brain injury, and pneumocephalus (air inside the skull) are the key observations.

FIGURE 7.5 A child injured in a severe auto accident shows multiple white areas in the brain as well as disruption of the skull. The white areas are intraparenchymal hemorrhage. Also note the disruption of the normal brain architecture (compare to Fig. 7.3D, which shows a section at roughly the same level), reflecting the severe cerebral edema.

FIGURE 7.6 A large mass of white (blood) density convex toward the brain is characteristic of an epidural hemorrhage. Most of these occur because of traumatic tear of an artery and are surgical emergencies. The brain is shifted by the hematoma as evidenced by the shift of midline.
MRI is not to be omitted in any discussion of trauma, but its role, although dramatically increasing, is usually secondary. Because of the limitations of patient access (ventilator limitations, difficulty in patient observation, etc.) and the longer examination times, MRI is rarely the first imaging modality used for acute trauma. After the acute, life-threatening emergencies have been handled, MRI is extremely sensitive for assessing the extent of parenchymal injury to the brain and for defining more precisely the compartment of localized extra-axial fluid. In each of these instances, the prognosis and etiology of the injury is better defined after MRI. MRI spectroscopy, a study of brain metabolism, holds great promise for predicting the outcome of some injuries. The utility of MRI for finding subarachnoid blood is debatable, but MRI is unparalleled in defining precisely which gyrus was smashed in a previous auto accident (Fig. 7.14). The instances in which MRI is critical in deciding the urgent management of a trauma patient are few, but it is an invaluable secondary tool in selected patients.
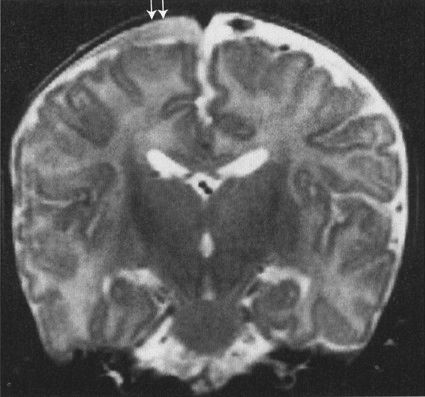
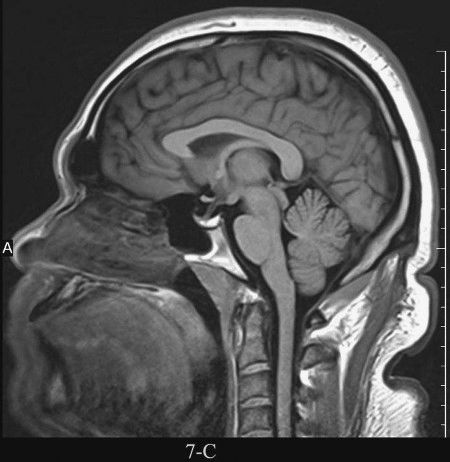
FIGURE 7.7 MRI of the brain, shown to illustrate that MRI is also effective in showing trauma. This is an abused child who has a subdural space hematoma (arrows). Note that the surface is concave, reflecting the contour of the cerebral cortex, but not extending among the gyri. This configuration is typical for a subdural hematoma. Also note that the signal densities are different on MRI. Imaging of bleeding is more complex on MRI than by CAT.
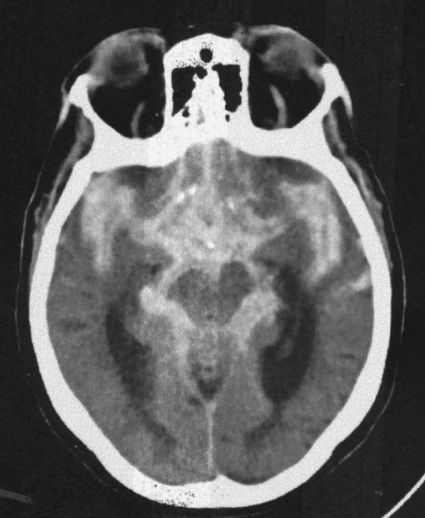
FIGURE 7.8 A CT scan at the level of the ambient cistern showing the cistern as white (blood) instead of black (cerebrospinal fluid; compare to Fig. 7.3B). Note that the white density also surrounds the brain stem. When blood mimics cerebrospinal fluid distribution, it is usually extra-axial and in the subarachnoid space flowing around and over the brain tissues.

Related posts:


Stay updated, free articles. Join our Telegram channel

Full access? Get Clinical Tree


