Fig. 10.1
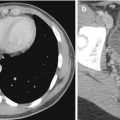
Examples of CT pitfalls: false negatives. (a) Subtle decreased density and blurring of the gray-white matter junction, especially at the lateral edge of the left lentiform nucleus, compared to the normal right lentiform nucleus edge (arrow) in a patient with early left MCA acute infarction. (b) The isodense right subdural hematoma in a different patient can be recognized due to its mass effect on the displaced white matter-cortex junction, midline, and frontal horn, despite its lack of grayscale contrast with normal brain. (c) Incidental isodense sellar region mass (arrow), in a different patient who presented after head trauma. MRI (not shown) revealed meningioma
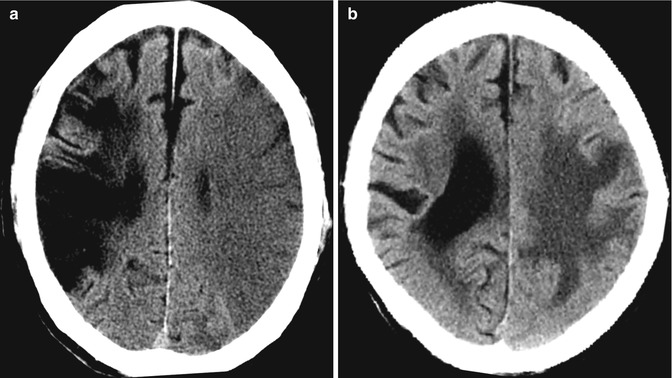
Fig. 10.2
Examples of CT pitfalls: different types of edema. (a) Decreased density in the left MCA territory involves both gray and white matter consistent with cerebral infarction in a patient with poorly documented weakness. Note the old right MCA territory hypodense infarction with volume loss. (b) Conversely, in another patient with slow-onset hemiparesis, hypodensity is confined to the subcortical white matter, sparing the cortex, consistent with vasogenic edema from metastatic cancer confirmed on MRI (not shown)
10.2.2 Avoiding CT Pitfalls
Many conditions resulting in false positives overlap with false-negative “missed” findings, highlighting the difficulty of calibrating our threshold: when is a dense MCA dense enough and when is the dense superior sagittal sinus too dense to be normal? Therefore, the preparation of residents to take call needs to be extensive and focused on perceptual manifestations of neuroradiology in order to have optimal impact (Funaki et al. 1997). One important maneuver during softcopy viewing on picture archiving and communication system (PACS) workstations would be to vary the window width and center level (for stroke, suggest 8 and 32, respectively, rather than the preset “brain” settings of 80 and 20) in order to improve contrast and detection of subtle signs (Lev et al. 1999; Turner and Holdworth 2011) (Fig. 10.3a). Direct measurements of the density in Hounsfield units may also be helpful, especially to differentiate small incidental falcine lipomas from pneumocephalus in traumatic injury. It is also necessary to assess the bones for abnormalities, not only in trauma but also destructive processes in suspected infection and neoplasm. Finally, CT suffers from attenuation artifacts caused by beam hardening in the posterior fossa (Fig. 10.3b), and, despite improvements in multi-detector CT (MDCT), ideal assessment of the brainstem and cerebellum often requires MRI: this and other anatomical blind spots are potential pitfalls to bear in mind (Bahrami and Yim 2009) (see below Sect. 10.4).
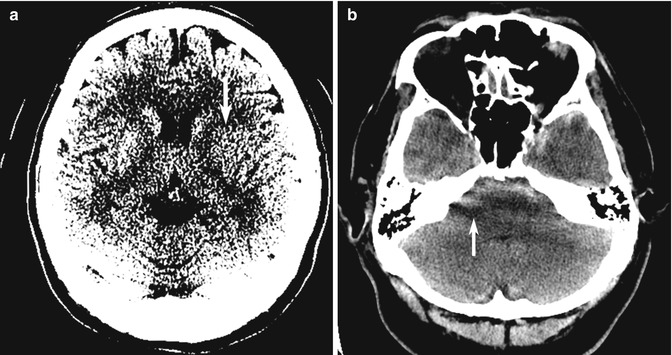
Fig. 10.3
Examples of CT pitfalls: technical/viewing factors. (a) The findings of decreased density and blurring of the gray-white matter junction (arrow), in the same patient as in Fig. 10.1a, is better appreciated with “stroke” window width and center of 8 and 32, respectively. (b) Beam-hardening artifacts (arrow) in a different patient with severe headache from SAH can make diagnosis of posterior fossa hemorrhage difficult
10.2.3 Vascular CT Pitfalls
With invention and widespread adoption of MDCT, volume three-dimensional (3D) reconstruction of exquisite bony and vascular detail becomes commonplace after post-processing using multiplanar reconstruction (MPR) and surface rendering. High-resolution intravenous CT angiography (CTA) allows immediate, noninvasive detection of aneurysms in patients with SAH, replacing invasive and logistically intensive digital subtraction angiography (DSA) in many centers, especially during on call after hours with comparable accuracy, at the same time decreasing the thick-section reconstruction pitfalls and stair-step artifacts (Villablanca et al. 2002; Takhtani 2005). In the assessment of CTA for aneurysms in patients with SAH, ideal viewing conditions would include removing overlapping vessels and a good bone-removal algorithm that eliminates potential pitfalls such as anatomical “blind spots” in the distal internal carotid artery (ICA), posterior communicating artery, ophthalmic artery, and superior hypophyseal artery (Sakamoto et al. 2006; Hochberg et al. 2011). Review of the source dataset is essential. The lack of availability of post-processing and oblique curved reformats (especially the cavernous segment of the ICA) due to inadequate technologist staffing may explain the higher (13 % discrepancy in one study) false-negative rates of on-call residents, especially to distinguish infundibular dilatation from aneurysm (Fig. 10.4) and to detect small (<3 mm) and multiple aneurysms (Villablanca et al. 2002; Li et al. 2009; Meyer et al. 2009; Hochberg et al. 2011).
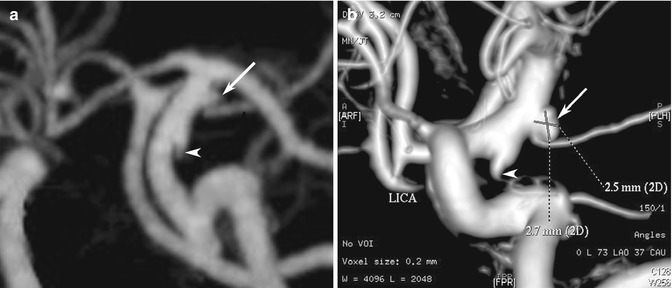
Fig. 10.4
Examples of CT angiography pitfalls. (a) CTA suggests that outpouchings at the origins of the anterior choroidal artery (arrow) and posterior communicating artery (arrowhead) might both be infundibula of their respective vessels. (b) However, the DSA clearly shows that the anterior choroidal artery outpouching is in fact an aneurysm (arrow), while the posterior communicating artery is an infundibulum (arrowhead)
Among patients with SAH, 15–35 % will harbor multiple aneurysms (Kaminogo et al. 2003): the pitfall that these may be missed should be emphasized in resident education (Hochberg et al. 2011). Peri-aneurysmal blood and intra-aneurysmal thrombosis may also reduce conspicuity. Distal branch aneurysms farther from the circle of Willis in the pericallosal and posterior inferior cerebellar arteries may also be missed (Seo et al. 2009). False-positive findings from enhancing tumors, contamination by opacified venous structures, dilated infundibula, and vascular loops are also potential pitfalls, especially in small aneurysm detection (Takhtani 2005). In large aneurysms, the “kissing vessel” partial volume artifacts, where an adjacent vessel is not well discriminated from the aneurysm, can result in the erroneous impression that there is a connection between them (Tomandl et al. 2004). Patients with clips or coils and the beam hardening obscuring nearby and parent vessels are also prone to misinterpretation.
In CTA for steno-occlusive disease in patients with ischemia, source images are also important to avoid pitfalls of diagnosis (Fig. 10.5). Maximum intensity projection (MIP) shows the calcification and stenosis better than volume-rendered surface 3D images, which may fail to show the extent of stenosis. MPR is particularly useful in dissection, plaques, and intraluminal defects (Bash et al. 2005) (Fig. 10.6). CTA is especially valuable in vertebrobasilar ischemia, where CT and perfusion CT (PCT) are hampered by beam-hardening artifacts and limited coverage (Sylaja et al. 2008). However, the false-positive rate for CTA for occlusion should be borne in mind when heavy atheromatous calcifications are present (Walker et al. 2002). Reflux of contrast material into jugular veins during CTA injection may mimic thrombus (Takhtani 2005).
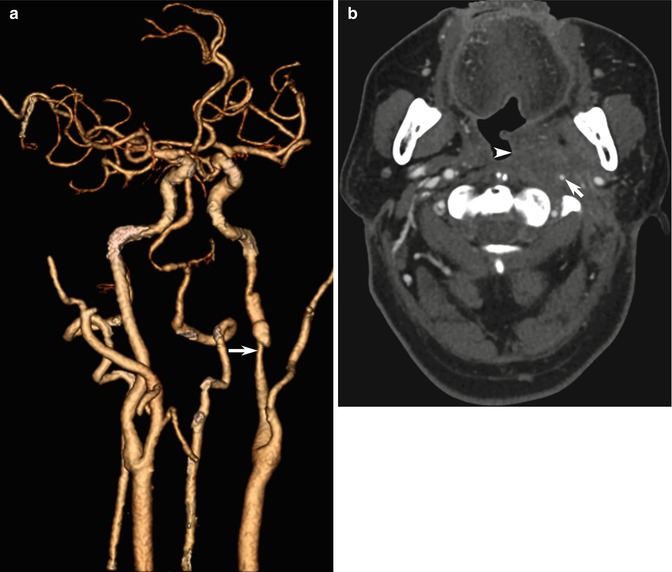
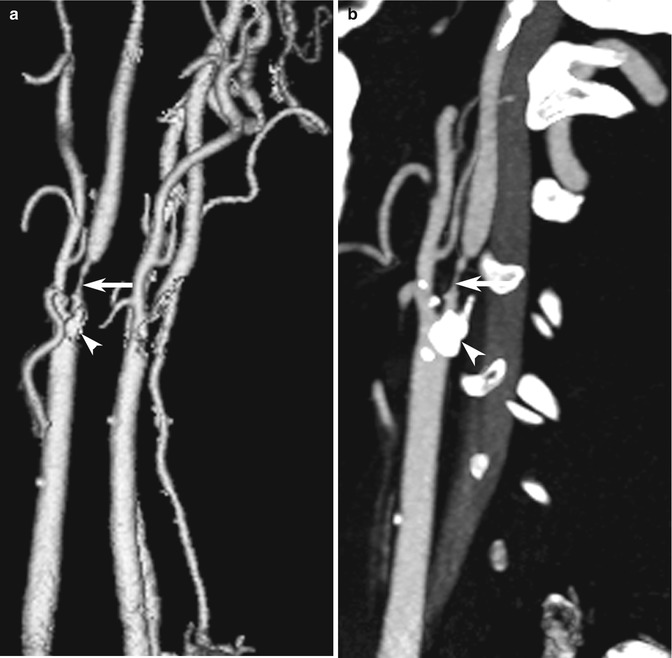
Fig. 10.5
Examples of CT angiography pitfalls: value of source images. (a) 3D shaded-surface display (SSD) CTA image shows left ICA narrowing (arrow). (b) CTA source images, however, provide information about the large soft tissue mass (arrowhead) in this patient with recurrent nasopharyngeal carcinoma and radiation damage to the ICA (arrow)
Fig. 10.6
Examples of CT angiography pitfalls: visualization techniques. (a) CTA presented as a 3D SSD image shows severe right ICA stenosis (arrow). (b) Sagittal MPR image better depicts the hyperdense calcific plaque in the vessel wall (arrowhead)
10.3 MRI Pulse Sequence Pitfalls
Multiple MRI pulse sequences provide different information about physical properties (such as the amount of free water, blood flow, water diffusion) in normal anatomy and pathology. Hence, synthesizing sometimes conflicting data from multiple sources is a challenge inherent in neurological MRI. The trend has been to develop pulse sequences with better and better lesion-to-normal contrast, with each new technique accentuating pathology, highlighting and hopefully at the same time decreasing ambiguity: for instance, T2-weighted images, fluid-attenuated inversion-recovery (FLAIR), and diffusion-weighted imaging (DWI) to improve contrast-to-noise ratio and sensitivity in stroke (Gonzalez et al. 1999). The neuroradiologist’s job also involves awareness of the limitations and pitfalls, suggesting confirmatory tests (sometimes while the patient in still in the MRI scanner, such as vascular or advanced techniques including perfusion or spectroscopy) and expanding or reducing the appropriate differential diagnosis. Each pulse sequence has slightly different pitfalls.
10.3.1 FLAIR Imaging
Developed to null the signal from normal cerebrospinal fluid (CSF), FLAIR is a heavily T2-weighted pulse sequence that can improve detection of abnormalities near the brain–CSF interfaces, especially protein (in SAH and meningitis), cellular deposits (in meningeal carcinomatosis), and slow blood flow (in ischemia) in the subarachnoid spaces (Stuckey et al. 2007) (see Sect. 10.4.1). However, although SAH is more sensitively detected on FLAIR than conventional spin-echo T1- and T2-weighted pulse sequences (Noguchi et al. 1995), conspicuity is affected by the more complex degradation of hemoglobin in the CSF when compared to the time scale of changes of intraparenchymal hemorrhage (Stuckey et al. 2007). False-positive high signal may be seen, particularly at the basal cisterns, cerebral sulci, and ventricles from artifactual CSF pulsation (Fig. 10.7a), vascular pulsation, magnetic susceptibility, and supplemental oxygen therapy (Yousem et al. 1990; Deliganis et al. 2001; Wu et al. 2002; Stuckey et al. 2007). Finally, after contrast agent injection, especially in patients with renal impairment, diffuse CSF enhancement should not be mistaken for high signal due to SAH (Bozzao et al. 2003). In fact, contrast-enhanced FLAIR can be exploited to increase lesion conspicuity.
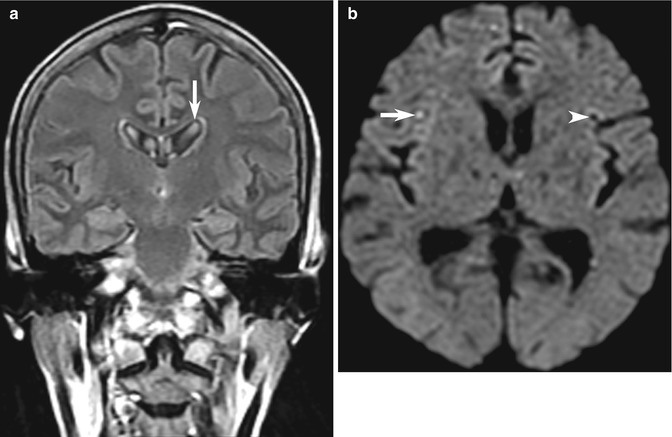
Fig. 10.7
Examples of MRI pitfalls: technical artifacts. (a) Example of CSF pulsation artifact causing hyperintense artifact in the lateral ventricles (arrow) on this FLAIR image. (b) DWI artifacts may be more deceptive and challenging, with artifactual tiny high signal intensity in the right cerebral hemisphere (arrow), with a mirror-image low signal area on the opposite side (arrowhead) caused by interference from monitoring equipment in this seriously ill patient with suspected stroke. There are other tiny mirror-image pseudo-lesions in the frontal lobes
10.3.2 Diffusion-Weighted Imaging
Exquisitely sensitive to restricted diffusion (random movement of molecular water) in cerebral infarction, DWI has been in widespread use to detect cytotoxic edema in acute stroke (Schaefer et al. 2000). However, DWI, being driven by echo-planar imaging (EPI), is prone to susceptibility artifacts (Fig. 10.7b), particularly at the air–bone interface, and hence prone to false-negative and false-positive pitfalls particularly in the temporal lobes (Fig. 10.8) and base of skull near the mastoid air cells and sphenoid sinus (see also Chap. 3). However, not all hyperintense lesions on the trace DWI are caused by infarction. The gamut of pathology with high signal and true restricted diffusion runs through epidermoid (compared to arachnoid) cyst, cerebral abscess (compared to cystic metastasis), some neoplasms (medulloblastoma, lymphoma and malignant transformation), and blood products at various stages (Krabbe et al. 1997; Bulakbasi et al. 2004). Although typical space-occupying masses may be differentiated from typical cortical infarction, sometimes hyperintense cortical lesions, such as encephalitis, Creutzfeldt–Jakob disease (CJD) or mitochondrial encephalomyopahy, lactic acidosis, and stroke-like episodes (MELAS) syndrome, may also show mimic cerebral infarction.
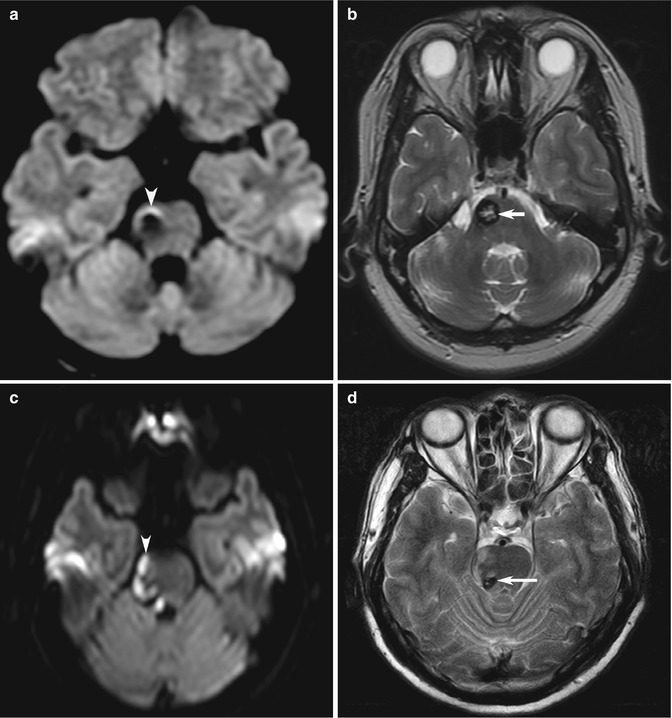
Fig. 10.8
Examples of MRI pitfalls: susceptibility effects on DWI. Stroke patient who has (a) artifactual increased signal caused by susceptibility effect of blood products (arrowhead) and also has an (b) incidental cavernous angioma (arrow). In a different patient, (c) hyperintensity from a real cerebral infarction (arrowhead) adjacent to (d) an incidental cavernous angioma (arrow) may be confirmed on T2-W or on follow-up imaging
Another pitfall of high signal on DWI is the phenomenon of “T2 shine-through” caused by T2 prolongation (rather than true restricted diffusion) contributing to hyperintensity, typically in subacute to chronic infarction, when the apparent diffusion coefficient (ADC) is pseudonormalized or increased, respectively (Fig. 10.9). Interpretation of DWI requires an understanding of the relationship between ADC, transverse (T2) relaxation time, and proton density (as well as b value, and TE), which influence DWI signal intensity (Mandell et al. 2012; Hiwatashi et al. 2003). This pitfall may be avoided by reviewing ADC maps. The opposite effects of overwhelming susceptibility from blood products causing T2 shortening (hypointensity) resulting in DWI hypointensity is typically seen in acute (deoxyhemoglobin) and early subacute (extracellular methemoglobin) stage hematomas (Hiwatashi et al. 2003; Silvera et al. 2005). However, hyperintense spontaneous hematomas with decreased ADC values may be seen at the earliest hyperacute (oxyhemoglobin) and late subacute (extracellular methemoglobin) stages and may thus mimic hyperacute arterial stroke on DWI (Silvera et al. 2005).
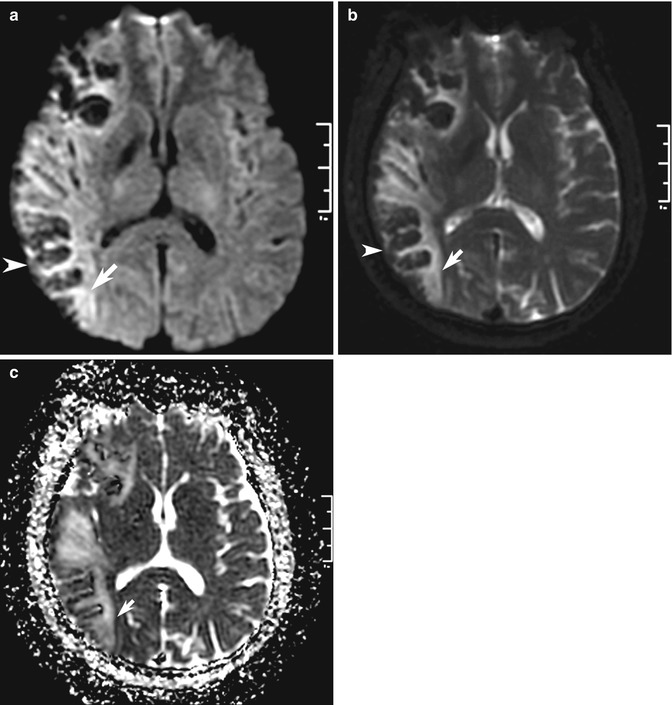
Fig. 10.9
Examples of MRI pitfalls: T2 effects on DWI. (a) Increased signal on DWI (arrow) may be caused by abnormalities other than acute cerebral infarction. (b) In this patient with indeterminate stroke symptom onset, high signal is also seen on the b = 0 image (arrow), indicating “T2-shine-through” effect and (c) confirmed by elevated ADC on the ADC map (arrow), indicating infarction of longer duration. Note the opposite “T2-blackout” effect of hemorrhagic transformation in the cortex that decreases signal on DWI (arrowhead in a, b)
Less well described is the two different “T2 washout” effects, where DWI isointensity can result from the opposing influences of T2 hypointensity and decreased ADC (false negative for ischemic injury (Mandell et al. 2012) (Fig. 10.9) or T2 hyperintensity and increased ADC in vasogenic edema. With a bewildering array of complex combinations, careful analysis of multiple pulse sequences is needed. The way the trace DWI image b = 0 image and ADC maps are labeled and displayed on PACS may also result in potential pitfalls in interpretation, especially for residents or rotating radiologists dealing with unfamiliar computer systems (Filippi et al. 2008).
10.3.3 MR Angiography and Venography
Time-of-flight (TOF) pulse sequences are popular as these do not require contrast agent injection, and ideally, background tissue should be completely suppressed and inflowing blood should be completely unsaturated to generate maximal signal. Tissues that have short T1 relaxation times, such as fat, hematoma, or thrombus, can mimic flowing blood on MIPs. Hence, review of source images and conventional MRI is crucial to eliminate artifactual signal contribution to false-negative impression of “flow” (Anderson et al. 1992; Bradley 1995; Naidich and Righi 1995; De Marco et al. 1996). False-positive overestimation of stenosis includes intravoxel dephasing caused by turbulent flow contributing to artifactually reduced signal (Fig. 10.10), which in some situations can simulate narrowing, and may give rise to the “skip sign,” an apparent discontinuity of flow in severely stenotic vessels (Heiserman et al. 1992; Furst et al. 1995; Hirai et al. 2002). Vessels close to the skull base and around the sphenoid sinus are affected by air–bone interface susceptibility artifacts and may benefit from MPRs (Ozsarlak et al. 2004).
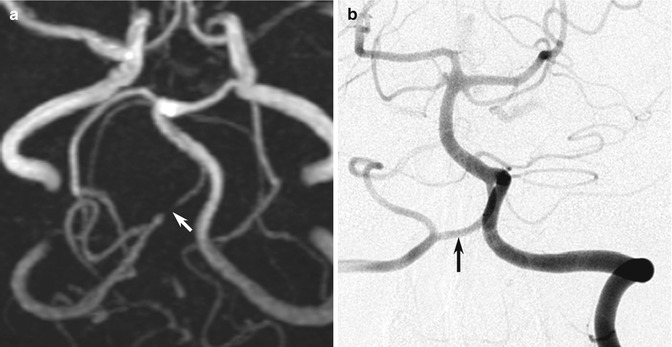
Fig. 10.10
Examples of MR angiography pitfalls: cerebral aneurysm. (a) The TOF MRA shows what appears to be a complete occlusion of the right vertebral artery just distal to the origin of the posterior inferior cerebellar artery (arrow). (b) However, the DSA clearly shows that the artery is of normal caliber throughout its distal length (arrow). This is a good demonstration of how MRA demonstrates flow in a vessel rather than luminal anatomy
In the assessment of aneurysms in the acute setting, intra-aneurysmal thrombus or peri-aneurysmal hemorrhage can also be misinterpreted as intraluminal blood flow on TOF MRA (Barber et al. 1999). In aneurysm follow-up, false-negative examinations can be caused by slow flow in the aneurysm with a saturation phenomenon or magnetic susceptibility artifact of the coil mass (Kahara et al. 1999; Anzalone et al. 2000; Cottier et al. 2003), while false positives are probably related to blood clot(s) within the coil mass, which can be interpreted as flow (Kahara et al. 1999). Some patients may require further evaluation using contrast-enhanced MRA or CTA, which have their own pitfalls.
Contrast-enhanced MRA pitfalls include inappropriately delayed acquisitions that may result in venous contamination in the MRA images, which is more of a problem in MIP than source images (Lee et al. 2000). Interestingly, this pitfall can be useful clinically to assess abnormal arteriovenous shunting or if information about venous patency is desired. Large field-of-view MR venograms can be obtained simply by subtracting arterial phase acquisitions from delayed images (Lebowitz et al. 1997). Although gadolinium-enhanced MRA is less prone to overestimation of vessel narrowing, it is still prone to all the limitations of MRI techniques. Aneurysm caliber may be underestimated in the presence of mural thrombosis and calcified atheroma, vasculitis, and vascular dissection can still be missed (Anderson et al. 1990). Residual concentrated contrast material in central veins ipsilateral to the side of arterial injection may create the false impression of arterial stenosis, when veins and arteries are in close proximity (Lee et al. 1999).
Normal anatomic variants in neuroimaging are well known enough not to present difficulties as pitfalls when radiologists encounter arachnoid cyst, Virchow–Robin spaces, midline lipoma, falx calcification, developmental venous anomaly, megacisterna magna, and cavum septum pellucidum and vergae (Bancroft and Bridges 2008; Winter et al. 2010). Likewise, anatomic variation of the arteries around the circle of Willis (fetal posterior cerebral arteries supplied by posterior communicating arteries being the most common) are not uncommon, and with more widespread adoption of CTA and MRA, we should expect to encounter rarer anatomic variants, such as persistent trigeminal artery (Caldemeyer et al. 1998) (Fig. 10.11).
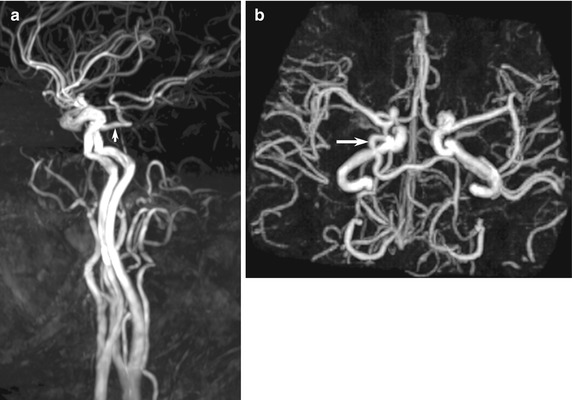
Fig. 10.11
Examples of MR angiography pitfalls: anatomic variants. (a, b) Normal persistent trigeminal artery (arrow) detected incidentally on MRA, performed for giddiness, shows characteristic connection between the carotid and vertebral systems via the cavernous sinus to join the distal basilar artery. The ipsilateral vertebral and proximal basilar arteries are typically hypoplastic
MR venography (MRV) assessment of cerebral venous thrombosis (CVT) using TOF or phase contrast (PC) studies are prone to false-positive pitfalls including intrasinus septa, arachnoid granulations (Fig. 10.12), and flow gaps due to normal asymmetry in venous anatomy (up to 31 % of cases, typically in the nondominant transverse sinus) (Casey et al. 1996). Artifactual intravascular signal loss from in-plane saturation typically occurs at predictable sites of tortuosity, especially the posterior superior sagittal sinus, transverse-sigmoid junction, and sigmoid sinuses (Vogl et al. 1994; Ayanzen et al. 2000; Leach et al. 2006). Contrast-enhanced 3D MRV, CT venography (CTV), or DSA may be necessary to prevent false-positive and false-negative studies (Liang et al. 2001). Chronic thrombosis is extremely complicated and can still be falsely negative, even when using the best techniques (Dormont et al. 1995) (see Sect. 10.4.2).
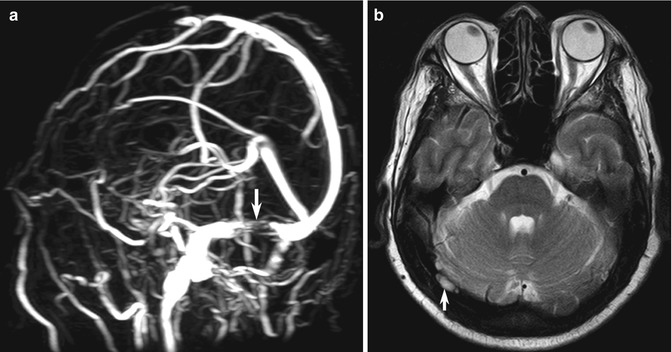
Fig. 10.12
Examples of MR venography pitfalls: normal arachnoid granulations. (a) MIP image in TOF-MR venogram shows a sharply marginated flow gap (arrow) within the right transverse sinus. (b) Axial T2-W image shows a well-defined focal area of high signal intensity (arrow) typical of normal arachnoid granulation
10.4 “Blind-Spot” Pitfalls
Certain anatomic sites deserve special attention because of the difficulty in analyzing them, and for neuroimaging, there should be a checklist of important review areas (similar to the familiar retrocardiac, lung apex, and other review areas for chest radiography interpretation) (Raskin 2006; Bahrami and Yim 2009). These anatomic “blind spots” of cranial CT and MRI include the cerebral sulci, dural sinuses, cavernous sinuses, orbits, clivus, Meckel cave, brainstem, skull base, and nasopharyngeal soft tissues (Bahrami and Yim 2009) (Fig. 10.1c). Perhaps the most important point to be aware is the fact that pathology outside the “brain” may be visible on cranial imaging and must be sought, with a special attention to the sellar/pituitary region, skull base, and venous sinus, which have been identified as most frequently missed. Specifically, we will focus on the cerebral sulci, dural sinuses, and bilaterally symmetrical abnormalities. Using a comprehensive checklist may be helpful to avoid blind spots and trigger the appropriate focused study of the pituitary, orbit, internal auditory canal, etc., using reduced field of view and slice thickness (Bahrami and Yim 2009).
10.4.1 Cerebral Sulci, Leptomeninges, and Pachymeninges
SAH is well known to be a pitfall on MRI; but FLAIR, gradient-recalled echo (GRE) and sometimes DWI sequences can be helpful in detecting acute SAH (Noguchi et al. 1995). Abnormal hyperintensity (from SAH, meningitis, and meningeal carcinomatosis) should form an appropriate differential diagnosis list of sulcal abnormalities (Stuckey et al. 2007) (Fig. 10.13a). However, leptomeningeal contrast enhancement is sometimes indistinguishable from gyral enhancement, although vascular enhancement can be differentiated, especially if hyperintense vessels stand out in hypointense CSF in the absence of cerebral edema (see Sect. 10.4.2).
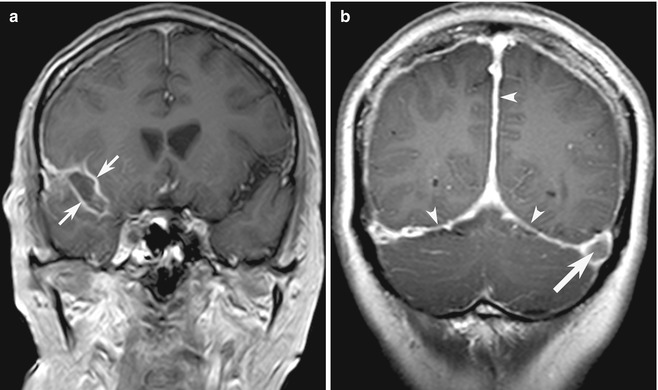
Fig. 10.13
Examples of blind-spot pitfalls: leptomeninges versus pachymeninges. (a) Coronal contrast-enhanced T1-W MR image shows typical leptomeningeal enhancement (arrow), in a patient with infectious meningitis. (b) In contrast, there is diffuse, bilateral smooth dural contrast enhancement (arrowheads) typical of intracranial hypotension and a filling defect (arrow) caused by incidental concurrent left transverse sinus thrombosis (Reprinted from Tan et al. (2008), with permission from John Wiley and Sons)
In contrast to leptomeningeal enhancement, pachymeningeal (also known as dural) enhancement tends to appear thicker, affects the laterally placed fibrous dural reflections, and does not extend into the sulcal spaces. The gamut of differential diagnosis for dural disease overlaps with leptomeningeal disease including infection (especially tuberculous meningitis) and neoplasm (especially metastasis) but also differs substantially and includes neurosarcoidosis, idiopathic hypertrophic pachymeningitis, and decreased CSF pressure/volume from ventricular shunting, lumbar puncture, or spontaneous intracranial hypotension (SIH) (Shievink 2008; Tan et al. 2008) (Fig. 10.13b). Diffuse, bilaterally symmetrical, smooth, and non-nodular dural enhancement with concurrent engorgement of venous structures, pituitary hyperemia, tonsillar descent, and subdural fluid collections is typical in SIH caused by occult CSF leakage (Shievink 2008).
10.4.2 Vascular Structures and Cerebral Venous Sinuses
Abnormalities of blood vessels may be visualized on conventional pulse sequences and may be helpful for diagnosis of occlusion in combination with typical features of brain parenchymal infarction; examples include loss of the normal arterial flow signal void on spin-echo T1- and T2-weighted MR images (Fig. 10.14a). Low signal intensity on T2*-weighted GRE MR images is the equivalent of the dense vessel sign on CT (Flacke et al. 2000). However, these abnormalities can be subtle and easily overlooked but may be the only clue in patients whom vascular disease is not suspected, and MRA and MRV are not acquired as part of the study protocol.
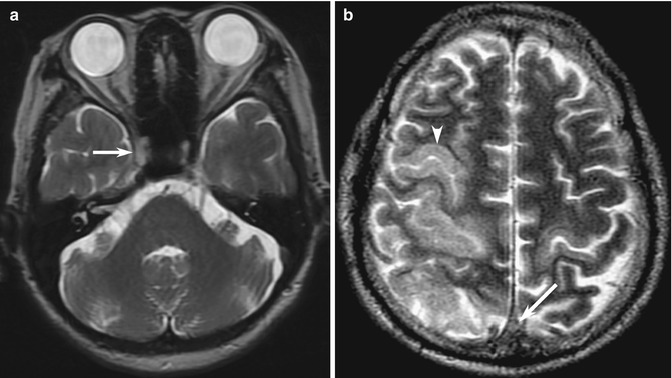
Fig. 10.14
Examples of blind-spot pitfalls: vascular structures on conventional MRI. (a) Loss of the normal signal void is seen in the occluded right internal carotid artery (arrow), with replacement by a hyperintense thrombus. This may be a subtle false negative, highlighting the vascular review areas on conventional spin-echo images in this patient with stroke. (b) In a different patient, there is direct sign of subtle replacement of the normal signal void in the thrombosed superior sagittal sinus (arrow), accounting for the indirect signs of bilateral cortical T2 hyperintensity (arrowhead) caused by venous hypertension, worse on the right
In the dural venous sinus system, direct signs of CVT such as dense “triangle sign” on unenhanced CT, “empty delta” filling defect on contrast-enhanced CT and MRI, loss of the normal MRI flow voids, and replacement by hyperintense or isointense thrombus (Connor and Jarosz 2002) are even more prone to pitfalls, especially for nonspecific complaints such as seizure or headache (Saposnik et al. 2011) (Fig. 10.14b). On the other hand, it can be easy to “over-call” false-positive densities in patients with dehydration or polycythemia (Healy and Nichols 2002). Thrombosed cortical veins are especially difficult (Fellner et al. 2005). Often, indirect signs such as SAH or hypodense venous infarction (following typical venous but not arterial territories, often with subtle hemorrhage) are detected, but the connection to CVT is not drawn, and readers may fail to proceed to confirmatory CT or MRV (Le et al. 2007; Tang et al. 2008). It is important to perform these confirmatory tests, in which the abnormalities often become obvious, but it requires a high index of suspicion. Radiologists may suggest performing these tests or go directly to DSA or MRA, especially since the clinical presentation of CVT is nonspecific (Renowden 2004; Tang et al. 2008). SAH (typically at the vertex rather than the base of skull as is typically the case in aneurysmal rupture) may rarely be the only manifestation of CVT (Oppenheim et al. 2005).
Prominence of leptomeningeal and transcerebral vessels representing enlarged, slow-flowing pial collaterals may be detected on FLAIR and as the“ivy sign” on contrast-enhanced MR images (Fig. 10.15a), providing a subtle clue to unsuspected vascular disease in patients, typically in Moyamoya disease but also in other ischemic situations (Maeda and Tsuchida 1999; Yoon et al. 2002; Lee et al. 2005). In patients with chronic CVT, the signal intensity of chronic thrombus can be complex and difficult to interpret, but the combination of engorged, corkscrew vessels and other subtle signs of dural arteriovenous fistula with CVT (Fig. 10.15b) should trigger confirmatory MRV or DSA (Kamran et al. 2000).
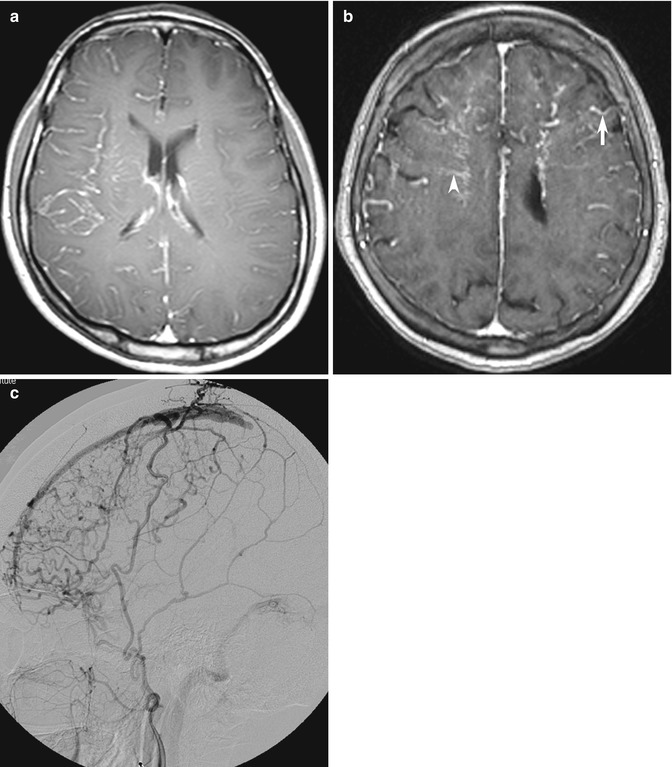
Fig. 10.15
Examples of blind-spot pitfalls: enhancing vessels on MRI. (a) Slow-flowing right cerebral hemisphere leptomeningeal collateral arteries may be seen as the “ivy sign” on contrast-enhanced T1-weighted image. In this patient with limb-shaking TIA from unsuspected ICA dissection but no fever, the initial MRI was misdiagnosed as meningitis. (b) Prominent enhancing tortuous corkscrew arteries (arrow) and transmedullary veins (arrowhead) should also trigger confirmatory vascular studies, including (c) DSA in this patient with nonspecific headache. The external carotid artery injection shows shunting from dural arteriovenous fistula and chronic partial superior sagittal sinus thrombosis
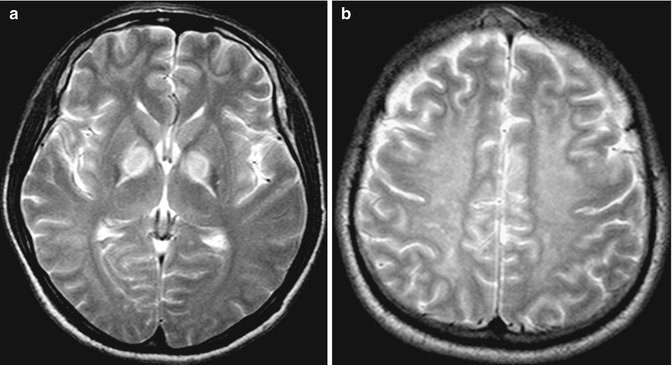
10.4.3 Bilaterally Symmetrical Abnormalities
The brain is symmetrical around the midline, and visually detectable asymmetry is an important clue in detecting focal disease (e.g., infarction, neoplasm, hemorrhage). Conversely, focal midline or bilaterally symmetrical abnormalities that do not produce asymmetry may be subtle and may be overlooked (Koontz and Gunderman 2008). Examples of pathology that may present with bilateral abnormalities include systemic (as opposed to focal) diseases, particularly acute metabolic derangements that affect the basal ganglia and/or the thalamus symmetrically (Hegde et al. 2011) (Fig. 10.16). Other examples of bilateral disease include diffuse white matter disease (e.g., leukodystrophy, posterior reversible encephalopathic syndrome), and bilateral cortical and hippocampal lesions (e.g., encephalitis, MELAS) (Fig. 10.17a). In extreme cases, there may be diffuse, widespread generalized abnormality such as severe hypoglycemic and hypoxic ischemic injury that affect the entire brain and show only the subtle clues of the “white cerebellar sign” and the “pseudo-SAH sign” on CT (Given et al. 2003; Lim et al. 2009; Gutierrez et al. 2010) (Fig. 10.17b, c). Conversely, although the differential diagnosis list of bilaterally symmetrical lesions includes systemic disease; in some situations, bilateral but asymmetrical focal abnormalities may cause confusion, especially if the imaging features or clinical presentation are not typical (Fig. 10.17d). Midline abnormalities are also diagnostic pitfalls due to lack of asymmetrical findings.