The use of MR imaging–derived methods to provide sensitive and reproducible assessments of brain volume (eg, to estimate atrophy) has increased the interest in this measure as a reliable indicator of disease progression in many neurologic disorders, including multiple sclerosis (MS). After an overview of the most commonly used methods for assessing brain atrophy state and changes in MS, this article discusses the clinical relevance of the most recent developments and reflects on its interpretation in a complex disease such as MS. Some caveats of these measurements are considered and possible future approaches discussed for improving the potential of this measure in assessing and monitoring pathologic evolution and treatment efficacy in this disease.
The recent development of computational methods that, using conventional magnetic resonance (MR) images, are able to provide sensitive and reproducible measures of brain volumes has allowed an indirect quantification of cerebral tissue loss in many neurologic disorders. These methods can be easily implemented at any MR center and have been extensively used in the study of multiple sclerosis (MS), increasing the interest in cerebral tissue loss (brain atrophy) as a marker to accurately assess and monitor the pathologic evolution of the disease. Brain volume loss has been recognized as an important feature of MS from the earliest disease stages and, in this complex disease, is the expression of a generalized process involving various tissue components of the brain.
This article reviews the most recent literature on the use of brain atrophy as a measure of disease progression in MS. Particular attention is paid to the methods used for these assessments, the clinical relevance of global and regional volume loss, and the potential limitations of these measurements.
Measuring brain volumes
There are many valid approaches to obtaining MR imaging–based measures of brain volume changes. On the basis of the amount of operator intervention, they can be grouped into manual, semi-manual, and fully automated. Clearly, when compared with manual ones, automated analysis methods provide better reproducibility and reduce reliance on time-consuming user intervention. More generally, methods for measuring brain volumes can be broadly divided into two categories depending on whether brain volumes are measured cross-sectionally or longitudinally ( Table 1 ).
| Type of Method | Features |
|---|---|
| Cross-sectional | |
| BPF | Calculation of the ratio of brain parenchyma volume to the total volume within the outer surface of the brain |
| BICCR | Brain tissue volume measured with respect to the volume of the inner table of the skull |
| Fuzzy connectedness algorithm | Each brain compartment considered a fuzzy connected set |
| Alfano’s method | Brain volumes obtained automatically with a multispectral relaxometry approach |
| TDS | Brain volumes segmented by using a digital brain atlas |
| SABRE | Individualized Talairach brain maps used for different brain regions in each hemisphere |
| Free Surfer | Calculation of cortical thickness after inflation of the folded cortical surface |
| SIENAX | Global and regional brain volume measurements normalized for subject head size |
| VBM | Assessment of voxelwise brain tissue “concentrations” |
| Longitudinal | |
| BBSI | Volume changes measured by subtracting baseline and follow-up scans |
| SIENA and SIENAr | Volume changes assessed by estimating the local shift in brain edges across the brain and its voxelwise extension for regional assessments |
Cross-Sectional Methods
These methods need a single image as input and measure the current atrophy state. They are generally based on segmentation of the brain tissues.
The first of these approaches to assess global brain atrophy is based on the measurement of the brain parenchymal fraction (BPF). The brain volume is calculated by measuring the difference in volumes inside a mesh over the exterior surface of the brain and inside the ventricles. A partial volume correction is employed to limit the impact of cerebrospinal fluid (CSF) within the cerebral sulci. Differences in the field of interest and segmentation partially cancel out because only one segmentation is performed to obtain the ratio of volume of parenchymal brain tissue to the total volume within the outer surface of the brain. This method is highly accurate, and the results are highly reproducible across different images from the same brain acquired over a short period of time (1 week), with a coefficient of variation less than 0.2%.
A similar method has been proposed by Collins and colleagues. With the brain to intracranial capacity ratio (BICCR), brain tissue is segmented as a primary step. The volume of brain tissue (or of any compartment) is measured with respect to the volume of the inner table of the skull.
Another method uses the fuzzy connectedness algorithm on dual-echo, fast spin-echo MR images for segmenting and estimating the volume of the white matter (WM), grey matter (GM), and CSF, each one detected as a fuzzy connected set.
Additional methods for measuring brain volumes in different brain compartments are the one described by Alfano and colleagues and the template-driven segmentation method (TDS). In the first method, WM, GM, and CSF volumes are obtained with an unsupervised, automated segmentation of the brain using a multispectral relaxometric MR approach. In TDS, the initial signal intensity–based statistical tissue classification is subsequently refined using a digital brain atlas as an anatomic template. This template, which is subdivided into over 120 anatomic labels, is matched to a given subject’s image using a combination of automated linear and nonlinear registration algorithms. Similarly, a more recent technique (SABRE) provides a semiautomatic brain region extraction and uses individualized Talairach brain maps for each subject to delineate and quantify different brain regions in each hemisphere. In this context, certainly interesting is an image analysis technique (Free Surfer) that segments out the cortex from the brain, avoiding the confound coming from gyral folding by inflating the folded cortical surface. This approach has allowed highly accurate measurements not only of overall cortical thickness but also of local cortical thickness in different regions.
The cross-sectional version of the structural image evaluation using the normalization of atrophy (SIENA) method (SIENAX) (part of the FMRIB Software Library [FSL]; www.fmrib.ox.ac.uk ) is an increasingly used method that estimates global and regional brain tissue volumes normalized for subject head size. It starts by extracting brain and skull images from the single whole-head input data. The brain image is then affine-registered to a canonical image (MNI152 image) in a standardized space (using the skull image to provide the scaling cue), a procedure that provides a spatial normalization (scaling) factor for each subject. Next, tissue-type segmentation with partial volume estimation is performed to calculate the total volume of brain tissue, including separate estimates of volumes of GM, WM and ventricular CSF. As is true for other methods, this calculation can be extended to include selective measures of multiple brain regions by using standard-space masks. This cross-sectional version of the SIENA longitudinal method gives a test-retest reproducibility of brain volume measures of about 0.5%.
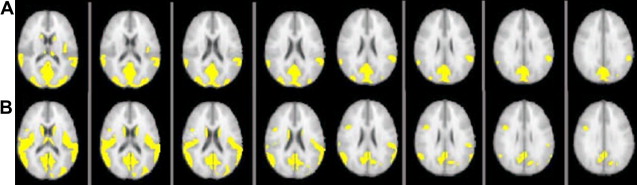
Specific regional measures of volume changes can also be obtained more indirectly by using the voxel-based morphometry (VBM) approach. This method is widely used for characterizing regional volume and tissue “concentration” differences in conventional MR images. Mainly, it is used to make voxelwise comparisons of the local concentration of GM regions between two groups of subjects. The procedure is relatively straightforward and involves a spatial normalization of high-resolution images from all subjects in a study into the same stereotactic space. This normalization is followed by a segmentation of the GM from the spatially normalized images and then a smoothing of the GM segments. Voxelwise parametric statistical tests which compare the smoothed GM images from the two groups are performed. Corrections for multiple comparisons are most frequently made using the theory of Gaussian random fields. VBM is most commonly performed using the statistical parametric mapping (SPM) software package. A VBM-style analysis is also straightforward to carry out with FSL tools. In this situation, a voxelwise general linear model is applied using permutation-based nonparametric testing. The comparison of the classical VBM approach and the FSL-VBM approach on the same data set shows similar changes in cortical GM areas ( Fig. 1 ).
Longitudinal Methods
Longitudinal methods need two sets of MR images acquired at different times as input. They measure the atrophy rate. Each of the previously described cross-sectional methods can give a measure of the atrophy rate by assessing the differences of measurement results at different time points; however, a more precise measurement is obtained when serial scans from an individual are accurately registered and the cerebral volume changes are derived directly. Explicit examples of registration-based methods that can be used for this purpose are brain boundary shift integral (BBSI) and SIENA.
In BBSI, volume changes over time are measured by subtracting baseline and follow-up scans. The method defines a region that lies near the borders of the baseline and registered follow-up brains. The BBSI technique is based on integrating the differences in intensities over this region. Scan intensities are normalized by dividing each scan by its respective mean, calculated over the interior region. The intensities are bounded by a clipping function based on a predefined upper and lower intensity for each scan. Dividing the integrated differences by the span of the clipping function provides a measure of the global brain volume loss.
Another increasingly popular approach to measuring total brain volume change directly is the SIENA method, also part of FSL. This method assesses brain volume changes by estimating directly the local shifts in brain edges across the entire brain. SIENA starts by extracting brain and skull images from the two time point whole-head input data. The two brain images are then aligned to each other (using the skull images to constrain the registration scaling). Both brain images are resampled into the space halfway between the two, avoiding bias in atrophy estimation due to asymmetric interpolation blurring. Next, tissue-type segmentation is performed to find brain/nonbrain edge points, and then perpendicular edge displacement (between the two time points) is estimated at these edge points. The displacement is estimated by aligning the peaks of the spatial derivatives of the intensity profiles of the two images to subvoxel accuracy. The mean edge displacement is converted into a global estimate of percentage brain volume change (PBVC) between the two time points. SIENA has been extended to allow the voxelwise statistical analysis of atrophy across subjects. This approach takes a SIENA-derived edge “flow image” (edge displacement between the time points) for each subject and warps this to align with a standard space edge image. The resulting images from all subjects are fed into voxelwise statistical analysis to find statistically significant localized difference in atrophy between the two groups of subjects.
In a recent study, the BBSI and SIENA methods were compared using the same data set. The two methods were in excellent agreement with each other. There was close correlation between the two measures (r = 0.87, P < .0001, median absolute difference = 0.25%), and even the absolute scaling of the two measures was close. With both methods, the measurements had an error of less than 0.2%, in agreement with previously published estimations of the overall error rate. Furthermore, another recent study has shown that registration-based techniques appear to be more precise and sensitive than segmentation-based methods in measuring brain atrophy, with BBSI and SIENA providing comparable results. Despite this finding, measures made with different techniques usually cannot be compared directly (although their measurements of change may be correlated), and sensitivities to change may be different.
Global brain atrophy
Since the earliest MR imaging studies in MS, marked atrophy of the brain has been recognized as an important feature of the late disease stages. Today, the availability of high-quality MR images and cutting-edge signal post-processing methods has allowed us to measure even small changes in brain volume occurring over relatively short periods of time (months). Serial MR imaging studies have demonstrated that brain volume loss occurs at a rate of around 0.5% to 1% per year in MS patients compared with a rate of about 0.1% to 0.3% per year in healthy subjects.
Brain atrophy appears to proceed relentlessly throughout the course of MS even at the earliest stages. In subjects at presentation with clinically isolated syndrome (CIS) suggestive of MS, it has been demonstrated that significantly greater ventricular enlargement occurs in persons in whom MS develops when compared with persons who remain stable. Several cross-sectional studies have shown that brain volume also is significantly reduced in relapsing-remitting (RR) MS subjects when compared with age-matched controls. Similarly, significant and diffuse brain atrophy is reported in patients with the secondary progressive (SP) and primary progressive (PP) forms of the disease. In a mixed population of MS patients (benign MS, RRMS, SPMS, and PPMS), a significant brain volume loss in each patient group was found, as well as a greater ventricle enlargement in patients than in normal controls ; however, in general, the rate of brain atrophy progression seems to be substantially independent of the MS subtype.
Brain atrophy in grey and white matter
Several MR and histologic studies have suggested that, even though MS is a demyelinating disorder, cortical GM pathology is also present. Many of the previously mentioned computational methods for measurement of brain volumes have been used successfully to selectively measure GM volumes in MS patients.
Several studies have demonstrated that GM volume loss is consistently present in MS patients from the earliest disease stages. For example, a decrease of GM fractional volume has been detected in CIS patients in whom clinically definite MS developed 3 years later, and cortical GM loss has been found in early RRMS patients. Other studies have tried to gain insights into the temporal evolution of GM atrophy in the early course of the disease. In particular, it has been demonstrated that GM volume loss may evolve over time periods as short as 1.5 to 2 years or less than 1 year in RRMS patients.
One of the most intriguing observations of MR studies assessing brain atrophy in MS has been that the pathology underlying cerebral volume loss seems to have a different impact in different GM regions. Overall, the studies have agreed in finding the frontal, temporal, and parietal lobes as the most involved (atrophic) cortical GM regions in MS patients. Although global measures have generically found a diffuse reduction of brain volumes in MS patients without major differences between clinical phenotypes and disease stages, selective regional measures have demonstrated differences in brain regional involvement in the progressive and relapsing forms of MS, or a progressive involvement of the cortical regions in patients with long disease duration or increasing disability. Atrophy seems to start in frontotemporal areas, specifically involving the superior temporal gyrus and superior and middle frontal gyri, and to extend to other clinically relevant areas (eg, the motor cortex) in more advanced disease phases.
Atrophy of the deep GM also occurs in MS. Normalized bicaudate volume has been found to be lower in MS patients than in normal controls, with no correlation with whole-brain atrophy or lesion volume. Thalamic volume reduction up to 25% in RRMS patients and up to 35% in SPMS patients has been observed in several recent cross-sectional and longitudinal studies. A longitudinal study of early PPMS patients found bilateral atrophy of the thalamus at baseline, which also extended to the putamen, caudate, and other cortical and infratentorial areas after 1 year. The thalamus seemed to be the only GM compartment involved in pediatric MS. All of these studies, demonstrating that there are specific deep GM regions (eg, thalamus and caudate nuclei) that can be involved earlier and more strongly than other regions in the pathologic process, provide additional evidence of the high relevance of GM pathology from the earliest stages of MS. Two of these studies bring the most relevant support to this hypothesis. By combining histopathologic methods and quantitative MR measures, they have elegantly shown that both RRMS and SPMS patients have comparable ex vivo loss of thalamic neurons and in vivo thalamic volume decrease.
Interestingly, when compared with GM volumes, decreases of WM volumes in MS are much less frequently reported. No WM atrophy has been found in CIS patients in whom clinically definite MS developed 3 years later and in early RRMS over an 18-month or 2-year follow-up. Nevertheless, decreases of WM volume have been reported in other studies of relapsing and progressive MS patients. Moreover, in a 9-year longitudinal study of a group of MS patients with a wide range of disease duration, the midsagittal corpus callosum size decreased independently of the disease course at the rate of about 1.8% per year. This decrease adds to the significant atrophy of central brain regions (ie, lateral ventricles) that also largely progresses over time in all MS stages and subtypes.
Clinical relevance of brain atrophy
In the last decade or so, many studies have investigated whether robust MR correlates of clinical change do exist in MS. The results have often been disappointing, probably explained by the fact that attention has been mostly focused on focal pathologic damage (ie, lesions) in WM. Focal WM lesions do not lead to disability progression in a simple way, and focal demyelination alone cannot explain entirely the pathologic process leading to clinical disability. Brain atrophy measures, by reflecting tissue loss (mostly myelin and axonal damage or loss) in both abnormal and normal appearing brain, may correlate with disability better than measures of focal demyelination or inflammation.
Both global brain and selective GM measures of volume loss have been closely associated with disability. Greater brain atrophy is generally found in CIS subjects in whom MS develops when compared with those in whom it does not and, in established MS, brain atrophy is greater in patients who show sustained progression of disability than in those who are clinically stable. In longitudinal studies of relapsing and progressive MS patients, brain volume at early stages seems to be a good predictor of disability status at follow-up, suggesting that atrophy is a relevant marker of disease progression and may even precede the development of measurable disability.
Interestingly, specific aspects of clinical dysfunction have been linked to regional brain atrophy. For example, longitudinal studies have shown a persisting association between segmental callosal atrophy and disability status, even at early disease stages. Also, the decline in ambulatory function (ie, Timed Walk Test) has been related to atrophy of periventricular and brainstem regions, whereas a focal thinning of the precentral gyrus and primary visual cortex has been related to the motor and visual scores of the Expanded Disability Status Scale, respectively.
Several MR studies have linked cognitive impairment to brain atrophy in MS. This impairment is an increasingly recognized clinical aspect of the disease observed in about 40% to 60% of patients, even including a proportion of those with early disease stage. Although increasing cognitive impairment may sometimes proceed in parallel with increasing T2 MR imaging lesion load, the magnitude of the correlation between neuropsychologic scores and T2 lesion volume has been found to be weak or moderate. By contrast, cognitive impairment has been found to be associated with measures of cerebral atrophy, and the importance of decreasing brain volumes (rather than increasing lesion load) to MS-related cognitive impairment has been suggested in several studies. In particular, cortical atrophy has been found to be significantly higher in cognitively impaired than in cognitively preserved RRMS patients and, in both RRMS and SPMS patients, has been the best predictor of verbal memory impairment and neurobehavioral symptoms. In other studies, the atrophy of the frontal cortex has been found to be related to reduced cognitive functions, and right and left frontal atrophy has been associated with auditory/verbal memory and episodic and working memory deficits, respectively.
The results of the previously mentioned studies strongly suggest the notion that brain atrophy (in particular, selective GM atrophy) is a good marker of unfavorable disease outcome in MS; however, its correlation with clinical disability is far from perfect. In a complex disease such as MS, several other factors (eg, spinal cord damage, cortical adaptation to injury, genetic predisposition to injury repair) can all contribute to weaken this relationship and should be considered when interpreting the clinical relevance of this and other MR imaging measures.
Use of brain atrophy as an endpoint in clinical trials
After MR-derived measures of brain volume changes were established as a sensitive, reproducible, and accurate index of brain tissue damage, they were used in several clinical trials to assess treatment efficacy. Nevertheless, only rarely has a treatment effect on brain atrophy been demonstrated.
Common characteristics of the studies using brain volume change as an endpoint are the relatively short follow-up period (mostly 2 to 3 years) and the increase of the atrophy rate occurring during the first period of treatment with anti-inflammatory agents. The latter finding is an important point that needs to be discussed.
Several lines of evidence suggest that the large brain atrophy rates found at the beginning of an anti-inflammatory therapy may be more a reflection of the resolution of inflammatory edema than a consequence of the irreversible loss of axons and myelin. In agreement with this, in many cases, the atrophy rate reduces after the first treatment period (ie, after the inflammatory edema is resolved), and, often, this lower rate is maintained over the remaining treatment period. In patients who had severe and rapidly evolving MS who underwent autologous hematopoietic stem cell transplantation, this procedure was associated (in addition to an immediate and longstanding suppression of focal demyelination and inflammatory activity) with a large and progressive atrophy (about 1.4% per year) over the first 2 years after treatment and to a significant and sustained reduction of volume loss in the subsequent 3 years (about 0.4% per year). Indeed, in CIS patients, in whom a minor resolution of inflammatory edema is expected, treatment with interferon beta-1a was shown to be effective in slowing progressive brain tissue loss.
Against this background, it is evident that measures of brain volume changes are sensitive and accurate enough to provide a robust index of efficacy in clinical trials; however, it is also clear that in a complex disease such as MS in which inflammation, demyelination, and neurodegeneration contribute to chronic disease progression, brain atrophy can be considered a good index of clinical outcome only when the study design entails relatively long follow-up periods.
Related posts:
 The Pathologic Substrate of Magnetic Resonance Alterations in Multiple Sclerosis
 MR Image Postprocessing for Multiple Sclerosis Research
 Basic Principles of Magnetic Resonance Imaging
 MR Relaxation in Multiple Sclerosis
 The Clinical Epidemiology of Multiple Sclerosis
The Use of MR Imaging as an Outcome Measure in Multiple Sclerosis Clinical Trials
The Clinical Epidemiology of Multiple Sclerosis
The Use of MR Imaging as an Outcome Measure in Multiple Sclerosis Clinical Trials
Stay updated, free articles. Join our Telegram channel

Full access? Get Clinical Tree


