A comprehensive knowledge of the natural course and prognosis of multiple sclerosis is of utmost importance for a physician to make it affordable in simple descriptive terms to a patient when personal and medical decisions are to be taken. It is still topical because the currently acknowledged disease-modifying agents only marginally alter the overall prognosis of the disease. It provides reference for evaluating the efficacy of a therapeutic intervention in clinical trials; clues for public health services, health insurance companies, and pharmaceutical industry in their respective activities; and insights into the pathophysiology and the treatment of multiple sclerosis. Precise, consistent, and reliable data from appropriate cohorts have become available and knowledge is fairly comprehensive.
A comprehensive knowledge of the natural course and prognosis of multiple sclerosis (MS) is of utmost importance for a physician to make it affordable in simple descriptive terms to a patient when personal and medical decisions are to be taken. It is still topical because the currently acknowledged disease-modifying agents (DMAs) only marginally alter the overall prognosis of the disease. It provides reference for evaluating the efficacy of a therapeutic intervention in clinical trials; clues for public health services, health insurance companies, and the pharmaceutical industry in their respective activities; and insights into the pathophysiology and treatment of MS. Since the pioneering works of McAlpine, many authors have tackled the description of the overall course and prognosis of MS. Thanks to them, precise, consistent, and reliable data from appropriate cohorts have become available and knowledge is fairly comprehensive at least at the level of groups of patients.
Methodologic considerations
For a comprehensive analysis of the natural history of MS, several methodologic criteria must be fulfilled. This includes considerations on population sampling, clinical assessments, and techniques of data analysis.
Population Sampling
The population of patients with MS under study must be representative of the disease. Ideally, all the cases of the disease present in a well-defined geographic area must have been ascertained and included in the cohort, which is population-based. Such a complete ascertainment is always a difficult challenge in MS, notably in hospital- or clinic-based studies. Benign cases, which do exist, are not so prone to come to neurologic attention. This is even more evident with the well-known patients incidentally found to have the disease at autopsy or at neuroimaging examinations. This bias leads to an overestimation of the disease severity.
Another key point is diagnostic accuracy. No specific diagnostic test is available for MS. The criteria of Poser and colleagues and McDonald and colleagues provide useful safeguards for a secure diagnosis. It must be kept in mind, however, that they are not MS-specific.
A minimum sample size is also needed for the sake of statistical power in such a clinically variable disease as MS. It is difficult to state where the lower limit stands, however, but presumably it is in a range of some hundreds. In principle, the higher the better but this may be at the expense of accuracy, homogeneity, and frequency of assessments. An interesting solution is to pool data from different sources, which is best achieved when they have been collected following the same standards on the same databasing system, such as the EDMUS system.
Last but not least, a cohort of patients can be considered as appropriate for the study of the natural history provided that DMAs have not been administered to these patients. This is no longer the case in MS since the mid-1990s with the approval and wide prescription of β-interferon, glatiramer acetate, and more recently mitoxantrone and natalizumab. The number of natural history MS cohorts is definitively limited.
Assessments
Ideally, the follow-up must be from the very onset of the disease until death for all included patients. It must be made prospectively, and at regular and as close as possible intervals, because ascertainment of relapses in MS is positively correlated to the frequency of neurologic assessments. It is also important to work on robust, easily assessable variables, even in retrospect. Assessments must be made homogeneously. This means that the same acknowledged language, definitions, and scales are to be used for all the patients throughout the study. Standardization and computerization of the data with the adoption of a database system facilitate a uniform description throughout the disease. Training sessions of examiners allow one to reduce interexaminer variability. All these tools are to be recommended. Unfortunately, for many easily understandable reasons in a disease with such a long duration, these goals are essentially unattainable for the standard follow-up of large cohorts of patients in the long-term.
Data Analysis
Analyses would be straightforward if it were possible to deal with the complete data of the overall sample population until the death of each included individual. Assuming the sample population to be representative of the disease, the results would reflect the truth at least for the area and time under study. Unfortunately, especially in a chronic disease with such a long duration, the researcher is expected to provide results well in advance and has to deal with incomplete data and to provide estimates.
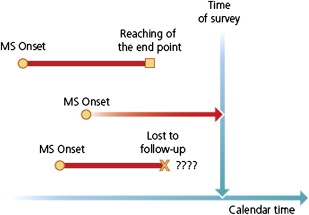
For a population of patients studied at the time of closure of the study with respect to a given end point (or outcome or dependent-variable) as, for instance, a given level of irreversible disability or the onset of progression, any individual fits one of three categories: (1) the end point has already been reached, (2) the individual is still under scrutiny but has not reached the end point, or (3) the patient has been lost to follow-up since a given date at which the end point had not been reached ( Fig. 1 ). The last two categories make up the group of censored patients.
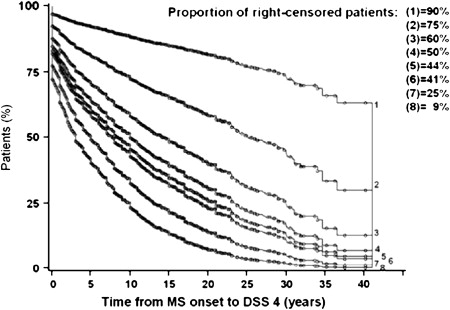
In elementary statistical analyses of the past, only the patients who had reached the end point when the survey closes were taken into account. Patients who had not yet reached this end point by the time of closure, but would do so later, were not included. This approach invariably led to underestimation of the true time interval from the starting point to the end point. Nowadays, more sophisticated survival analyses, such as those produced by the Kaplan-Meier technique, are preferred because the patients who have already reached the end point but also the patients censored at the time of closure of the study are taken into account in the probabilistic estimates of time intervals. As compared with the former statistical analyses restricted to observed data, survival analyses provide longer estimates that are closer to reality. These estimates, however, are not necessarily accurate. Noticeably, the proportion of censored patients has a clear influence on these statistics. This can be well illustrated in MS when studying the time to reach disease-related milestones, such as onset of progression or irreversible levels of disability: the higher the proportion of censored patients, the longer the estimated time intervals. For instance, as shown in Fig. 2 for the Lyon cohort, when the proportion of censored patients was experimentally decreased from 75% to 25%, the median time to reach a score of Disability Status Scale (DSS) 4 decreased from 25.1 to 5.1 years.
Material available for studies on the natural history of multiple sclerosis
Schematically, there are two different kinds of material for such a purpose. Both of them have strengths and weaknesses that, in many respects, are complementary. Geographically well-defined long-term natural history cohorts can be considered as representative of MS and provide robust information regarding long-term outcomes. Data related to the initial period of the disease are generally not optimal, however, because in many cases they have been assessed only in retrospect. More generally, for the reasons discussed previously, precision and reliability of the data are heterogeneous from one patient to the other, but also for a given patient during the course of the disease. By contrast, prospective short-term studies, either observational or within the scope of placebo arms of therapeutic trials, can provide precise and robust information regarding the course and prognosis of the disease during the study period. The latter, by design, however, is limited to several months or years. Such studies cannot provide robust results regarding the periods coming before and after the study period and, more generally, the long-term course and prognosis of the disease. Furthermore, the representativeness of the cohort is often limited, as inversely correlated to the tightness of the inclusion criteria.
For the description of the long-term natural history of MS, observational long-term studies are clearly the most valuable, especially those with a systematic longitudinal follow-up and special attention to the assessment of major outcome criteria, being it relapse occurrence, onset of progression, or time to reach selected landmarks of irreversible disability. In this respect, three cohorts combine the qualities of a relevant information source on the natural history of MS as for the large size and disease representativeness of the selected population; the prospective long-term longitudinal follow up with numerous, comprehensive, standardized clinical assessments at rather close intervals; the absence of significant DMAs; and the appropriate statistical analyses, notably survival techniques: (1) Lyon, France; (2) Gothenburg, Sweden; and (3) London, Ontario.
The clinical landmarks of multiple sclerosis
There are two approaches to describe the natural history of MS. One is qualitative, based on the interplay between relapses and progression, leading to a delineation of the course of the disease. The other one is quantitative, referring to the accumulation of neurologic disability, allowing for assessing the prognosis. Both can serve also in therapeutic trials.
Course-Related Dependent Variables
It has long been recognized that the course of MS may be considered as the expression of two clinical phenomena, relapses and progression, which correspond to distinct physiopathologic processes within the central nervous system (CNS). The clinical interplay between relapses and progression leads to the consideration of two phases in the disease and three main types of evolution.
Relapses, which may also be called “exacerbations,” “attacks,” or “bouts,” are the clinical counterpart of acute focal inflammation of the CNS. More precisely, they correspond to the occurrence of a new focal acute inflammatory lesion or the reactivation of an older one. They are defined as the occurrence, the recurrence, or the worsening of symptoms of neurologic dysfunction marked by a subacute onset over a few hours or days before plateauing and usually ending with a remission, either partial or complete. They last more than 24 hours but, for some authors, 48 hours is the minimum required duration. Symptoms occurring within a month are considered as part of the same relapse. Fatigue alone is not considered as a relapse. Similarly, transient fever or exercise-related worsening of symptoms is not considered as a relapse. Indeed, they reflect only transient impairment of the nervous conduction within pre-existing lesions in relation to transient physicochemical changes associated with increase in body temperature or physical exercise (Uhthoff’s phenomenon). By contrast, paroxysmal neurologic symptoms occurring in isolation but repeatedly in a given patient for more than 24 hours might qualify for a relapse.
Progression is defined as the steady worsening of symptoms and signs over 6 months at least or even 12 months according to other authors. As soon as progression has started, it goes on continuously throughout the disease, although occasional plateaus and temporary minor improvements may be observed. Most likely, the progression is the clinical manifestation of the chronic, progressive, diffuse degeneration of the CNS, which is the other hallmark of MS, besides the acute, multifocal, recurrent inflammatory process. The date of onset of progression is assessed in retrospect, once the required 6- or 12-month duration of continuous neurologic worsening has been confirmed. There is always some uncertainty regarding this parameter.
The occurrence of relapses and progression leads to the consideration of two distinct phases in the course of MS. The relapsing-remitting (RR) phase is characterized by relapses alternating with periods of clinical inactivity. Neurologic sequelae may be caused by relapses but remain stable (ie, they do not worsen) between relapses. The progressive phase is characterized by the clinical progression defined previously. Relapses may be superimposed onto progression, either at its onset or during its course, or both, as observed in around 40% of the cases.
Since Charcot, it has been acknowledged that the disease can enter a steadily progressive stage after successive relapses and remissions, or follow this steadily progressive course right from clinical onset. Concretely, a given patient may present only one of the two phases or both, with in the second case an orderly sequence of the RR phase coming first and followed by a conversion to the progressive phase. To standardize the terminology used in the description of the pattern and course of MS and to improve a mutual understanding of clinicians and researchers, an international survey of clinicians involved in MS has been performed and a consensus has been reached to classify the disease course in four different categories ( Fig. 3 ):
- 1.
Relapsing-remitting MS: clearly defined relapses with full recovery or with sequelae and residual deficit on recovery; periods between disease relapses characterized by a lack of disease progression.
- 2.
Secondary progressive MS: initial relapsing-remitting disease course followed by progression with or without occasional relapses, minor remissions, and plateaus.
- 3.
Primary progressive MS: disease progression from onset with occasional plateaus and temporary minor improvements allowed.
- 4.
Progressive-relapsing MS: progressive disease from onset, with clear acute relapses, with or without full recovery; periods between relapses characterized by continuing progression.
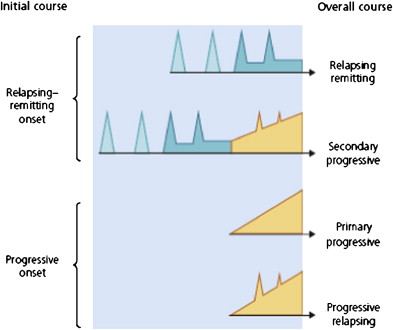
It must be noted that in this classification the presence or absence of superimposed relapses were both allowed in secondary progressive (SP) MS cases, whereas primary progressive (PP) cases with superimposed relapses were split from PP cases without (progressive-relapsing [PR] MS versus PPMS).
Prognosis-Related Dependent Variables
The second dimension in the history of MS is quantitative with the appearance of disability, which may be transitory, partially reversible, or definitely irreversible. A way of describing the natural outcome of MS is to assess the time course of disability accumulation. This leads one to address the issue of scoring in MS. The scale, which has been used in most of the works devoted to the description of the natural history of MS, is the DSS and its detailed version, the Expanded Disability Status Scale (EDSS). Such a scale, however, has acknowledged shortcomings and limitations. It has repeatedly been shown to have only moderate interrater reliability. It must also be realized that the EDSS scale is ordinal and categorical but neither quantitative nor continuous. The assumption that disability, as measured by the EDSS scale, naturally continues to progress at a similar rate all over the course of the disease is clearly contradicted by empiric observations. Despite this impressive list of limitations and criticisms, the EDSS scale has gained unrivalled familiarity and most popularity in the community of clinicians involved in MS. Only a small number of the many other scales suggested for MS are used, particularly in clinical trials, such as the MS functional composite, which is more sensitive and multidimensional than its elder. To date, however, no scale fulfills the requirements of the international MS community.
For the specific purpose of epidemiologic studies requiring long-term follow-up of numerous patients, such as natural history studies of MS, it has proved valuable to focus on robust landmarks of disability that could be easily identified through successive neurologic assessments and through retrospective interview of the patient whenever necessary. For the study of the 1844 patients of the Lyon cohort, selected landmarks of disability were DSS 4, limited walking ability but able to walk more than 500 m without assistance and without resting; DSS 6, ability to walk only with unilateral support and no more than 100 m without resting; and DSS 7, ability to walk no more than 10 m without using a wall or furniture for support. Other series have also addressed other landmarks usually defined as follows: DSS 3, moderate dysfunction (monoparesis, mild hemiparesis, and so forth; and DSS 8, restricted to bed, but with effective use of arms).
Long-term natural history studies also focus on the accumulation of irreversible disability. In the Lyon studies, disability was defined as irreversible when a given score persisted at least 6 months, excluding transient worsening of disability related to relapses. By definition, when a given score of irreversible disability had been assigned to a patient, all the scores of disability that could be subsequently assessed during the follow-up of this same patient were either equal to or higher than the initial score.
The onset of multiple sclerosis
The demographic and disease-related characteristics of the onset of MS are currently well-delineated thanks to the numerous series devoted to this issue. A female predominance is apparent in all representative studies. The usual ratio is two females for one male. The highest proportion for females has been found at 71% and the lowest at 51%.
Age at Onset of Multiple Sclerosis
There is a consensus for peak onset around 30 years of age. In most representative series, the distribution of patients by age at onset of the disease is essentially bell-shaped, with onset before the age of 20 years in around 10%, from ages 20 to 40 years in 70%, and after the age of 40 years in 20% of the cases. Onset after 55 years of age is rare and should question the diagnosis of MS. Females often seem to have a slightly younger mean age at onset than males. Furthermore, the female/male ratio is usually found to decrease as age at onset increases.
Initial Symptoms
There is no alternative, for many patients, to have their initial symptomatology assessed other than in retrospect, with an interval of months or years between the clinical onset of the disease and the first clinical evaluation. In such circumstances, it is difficult, if not erroneous, to try to go into discrete details for the description and the classification of the initial symptoms and signs. Furthermore, many wordings, although in large use, are poorly defined and may prove misleading. This is the case, for instance, for such terminologies as “motor symptoms,” “cerebellar,” “pyramidal,” “monosymptomatic,” “polysymptomatic,” “monoregional,” and “polyregional.” It is wise to classify initial symptoms conservatively in broad categories. That said, there is some consensus among the different long-term natural history series in the literature with respect to the distribution of initial symptoms in MS: an incidence of around 15% for isolated optic neuritis, 10% for isolated brainstem dysfunction, 50% for isolated dysfunction of long tracts, and 25% for various combinations of these symptoms are reasonable estimates.
The influence of gender on the initial symptomatology of MS has usually been found to be either nil or marginal. By contrast, an obvious influence of the age at onset of the disease has consistently been found, with a higher percentage of optic neuritis and diplopia in the patients with an earlier onset and of motor disturbances in the patients with a later onset.
Initial Course
It has become commonplace to call “clinically isolated syndrome” any initial neurologic episode suggestive of MS, provided its onset is acute or subacute; its course is RR; its symptomatology can be attributed to a dysfunction of optic nerves, brainstem, or spinal cord; and appropriate paraclinical investigations have been performed to discard any alternative diagnosis to that of suspected MS. It is clear, however, that this denomination is used in different ways according to different authors, from purely monosymptomatic presentations attributable to a single lesion in the CNS, to any RR initial episode. Classical wordings seem still preferable, such as “first neurologic episode” or “inaugural demyelinating episode.”
Some differences emerge among the literature as to the actual relative proportions between the two types of initial course of the disease. Indeed, the frequency of cases with progression from onset relatively to cases with an RR onset has been found to range from 5% to 37%. These extreme figures are likely to be related to recruitment differences. They can also result from classification bias, as has been shown in the London, Ontario, cohort. When the Canadian authors updated the data on their total cohort of 1099 patients in 1996, they had to reassign a significant number of patients with respect to the overall clinical course of the disease, because these patients were able to recall a remote first relapse only after several previous visits. From the currently available literature, the initial course of MS can be reasonably estimated to be RR in 85% of the cases and progressive in 15%.
Since Müller’s work, it has been repeatedly found that men are more exposed than women to a progressive onset of MS, and that symptoms related to dysfunction of long tracts are relatively more frequent, whereas optic nerve and brainstem symptoms are relatively less frequent in progressive-onset cases compared with RR-onset cases. The strongest correlation between the initial course of the disease and clinical variables assessable at the onset of MS is related to age: the proportion of progressive-onset cases rises steadily with age.
The overall course of multiple sclerosis
Most patients with MS experience successive, distinct, neurologic events: relapses for the most part and onset of progression for a number of them. The focus here is on the events’ timing during the course of the disease.
Recovery from the First Neurologic Episode
The key predictive factor of remission is the duration of the ongoing neurologic episode before admission to the hospital: the longer this duration, the lower the probability of improvement. The estimates regarding the proportion of cases matching the definition of incomplete recovery following a first acute episode suggestive of MS range from 16% to 30%.
Development of the Second Neurologic Episode
This topic has recently received renewed attention with the advent of DMAs. Indeed, the development of a second neurologic episode allows one to qualify a case of possible MS for conversion to definite MS provided the second episode involves a new site within the CNS. Following such a conversion, there is additional rationale to offer DMAs.
The first issue is the overall rate of occurrence of the second neurologic episode during the disease. McAlpine and Compston are the first clearly to demonstrate that the highest chance to develop a second neurologic episode comes immediately after the initial episode and that it diminishes progressively thereafter. A remarkably similar distribution was observed in the Lyon series with a median at 1.9 years ( Fig. 4 ) in agreement with other series.
Another source of information comes from the placebo arms of the randomized controlled trials having specifically enrolled patients with a first neurologic episode suggestive of MS. The ONTT trial has enrolled only patients suffering from an acute optic neuritis whatever the results of the brain MR imaging. The CHAMPS trial enrolled patients with a monofocal episode and two T2 lesions at least on the baseline brain MR image. The episode involved the optic nerve in 50% of the cases, the spinal cord in 28%, or the brainstem-cerebellum in 22%. In the ETOMS trial, patients were enrolled following either a monofocal (61% of the cases) or a multifocal (39%) episode with at least four T2 lesions. Last, for being enrolled in the BENEFIT trial, patients had to present with a monofocal (53% of the cases) or a multifocal (47%) episode, and at least two T2 lesions. The cumulative probability according to Kaplan-Meier estimates of developing a second neurologic episode qualifying for MS at 2 years has been 18% in ONTT, 38% in CHAMPS, 45% in ETOMS, and 45% in BENEFIT. With the exception of the ONTT trial, the median time to the second neurologic episode was close to 2 years, in agreement with what has been observed in the long-term natural history series.
Differences in the recruitment criteria explain the lower likelihood of developing a second neurologic episode within 2 years of follow-up in the ONTT trial. Indeed, enrolment was restricted to a first episode of optic neuritis only for that trial. It is well known that a significant proportion of isolated acute optic neuritis never evolves to MS, notably in cases with normal brain MR imaging. For instance, in a Swedish cohort of 86 patients of isolated unilateral acute optic neuritis followed prospectively for up to 31 years, the cumulative probability of developing a second neurologic episode was 40% at 15 years of disease evolution and this proportion did increase only marginally during the subsequent years of follow-up. A similar conclusion can be drawn from the prospective evaluation of 320 patients suffering from a clinically isolated syndrome in Barcelona. By comparison with cases with brainstem syndromes, spinal cord syndromes, or other localizations, cases with optic neuritis were twice more likely to exhibit a normal baseline MR image and less likely to suffer from a second neurologic episode during the follow-up. It can be argued whether optic neuritis is more benign than other localizations of first neurologic episodes suggestive of MS or, more likely, optic neuritis with normal baseline MR imaging is essentially not MS.
A large multicenter collaborative study of 532 patients with a first neurologic episode suggestive of MS and a mean follow-up of 3.6 years provided a Kaplan-Meier estimate of 7.1 years for the median time to conversion to clinically definite MS (CDMS). This estimate is markedly at odds with the former data analyzed previously and the clinical experience of the neurologist familiar with MS. It must be noted, however, that the outcome in this study was not the occurrence of a second neurologic episode but the conversion to CDMS, which, according to accepted criteria, requires that the new clinical episode affects other parts of the CNS compared with the first clinical episode. Furthermore, this cohort was overrepresented with optic neuritis cases (52%) and included a large proportion (30%) of cases without asymptomatic lesions (mostly patients with no lesions at all) on the baseline brain MR imaging scan. As discussed, a substantial proportion of such patients never convert to MS. Awaiting results from the further follow-up of this cohort, the median time to the second neurologic episode can be reasonably estimated to be 2 years (ie, the proportion of patients suffering from a second neurologic episode is around 50% at 2 years of follow-up).
A second issue concerns the clinical factors that may influence the rate of occurrence of the second neurologic episode in MS. According to the long-term natural history series, there is no such clinical predictive factor, be it gender, age at onset of the disease, monofocality or multifocality of initial symptoms, degree of recovery from the initial episode, and a RR or SP overall course of the disease. According to the CHAMPS trial, the 2-year cumulative probability of developing a second episode was similar for optic neuritis, spinal cord syndromes, and brainstem-cerebellar syndromes in agreement with the observations made in Barcelona when optic neuritis cases with abnormal baseline MR imaging only were compared with other inaugural topographic syndromes. This probability was twice higher for multifocal than monofocal presentations in the ETOMS trial, whereas no difference was found in the BENEFIT trial.
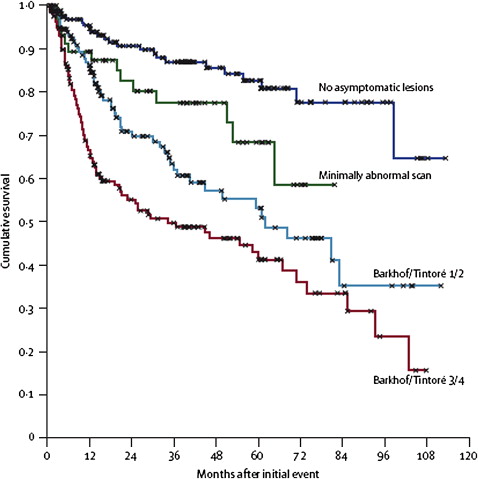
The third issue deals with the paraclinical factors that may influence the transition to a second neurologic episode. Results clearly show a strong effect of brain MR imaging abnormalities that may be observed at baseline. The four randomized controlled trials focusing on a first neurologic episode have consistently shown that the higher the number of T2 lesions on the baseline brain MR image, the higher the probability of developing a second episode. Presence of enhancing lesions on the baseline MR image seemed the strongest predictor of the development of a second episode in CHAMPS. It was also influential in BENEFIT, but not in ETOMS. Prospective observational studies devoted to patients presenting with a first neurologic episode suggestive of MS have also shown that the presence or the number of multifocal brain MR imaging abnormalities markedly increases the probability of a second neurologic episode within 1 to 3 years, but also 5 years, 10 years, and 14 years of follow-up. For instance, in the Queen Square series of 89 patients, conversion to CDMS was observed within 5 years in 65% of the 57 cases with abnormal baseline MR image (defined as one or more lesions compatible with MS) compared with 3% of the 32 cases with normal MR imaging. For the 81 patients still followed at 10 years, the corresponding figures were 83% and 11%. At 14 years, among the 71 patients still under scrutiny, figures were 88% and 19%, respectively. In the previously mentioned cohort of 532 patients with a first neurologic episode suggestive of MS, the Kaplan-Meier estimates at 2 years of survival time for the occurrence of a new clinical episode qualifying for CDMS ranged from about 10% for the group of patients without asymptomatic lesions (mostly patients with no lesion at all) to about 45% for the group of patients fulfilling the Barkhof-Tintoré dissemination in space criteria ( Fig. 5 ). The T2 lesion volume on brain MR imaging at presentation does also play a role: the higher this volume, the higher the risk of developing a second episode. Several studies have shown that the presence of gadolinium-enhancing lesions on T1-weighted brain MR imaging is a stronger predictor than the presence of T2 lesions for the probability of developing a second episode. An extensive analysis of the T2 and T1 parameters has also demonstrated that the presence of juxtacortical lesions, infratentorial lesions, and periventricular lesions are all independent predictors of the occurrence of a second neurologic episode in the short term. These data have served as a rationale for developing the MR imaging Barkhof criteria qualifying for the dissemination in space, which are used in the current diagnostic classification of MS.
Data gathered from repeating early brain MR imaging add significance to the predictions. The presence of new T2 lesions or gadolinium-enhancing lesions on a brain MR image performed 3 months after the baseline MR image or 12 months after the initial episode are both predictors of the occurrence of a second episode. For instance, among 68 patients presenting with a monofocal episode in the British study, development of a second episode at 1 year was observed in 33% of the “baseline MR imaging T2-positive” patients; 52% of the “baseline MR imaging T1-positive” patients; 57% of the “repeatedly T2-positive” patients (defined by the presence of T2 lesions on baseline MR imaging and of new T2 lesions on the second MR image performed 3 months later); and 70% of the “repeatedly T1-positive” patients. Information gathered from the second MR image improves the positive predictive value and the specificity of MR imaging for the development of a second episode. These results are obtained while maintaining sensitivity over 80% for T2 criteria, but decreasing sensitivity from 61% with the baseline MR image only, down to 39% with both brain MR imaging scans for the T1 criteria. These data served as a rationale for using the results of serial early brain MR imaging for satisfying dissemination in time in patients still at the clinical stage of a single neurologic episode.
Typical abnormalities in the baseline cerebrospinal fluid, abnormal results of baseline evoked potentials, and presence of HLA-DR2 antigen are all associated with a shorter time to a second episode. Their predictive value, however, has generally been found to be lower than that of brain MR imaging. Lately, in a study involving 103 patients with an initial monofocal episode, the presence of antimyelin antibodies in the serum was associated with a dramatically increased risk of developing a second episode, as compared with the seronegative patients. These results have not been confirmed, however, by subsequent studies.
Relapse Frequency
Considerable variations have been reported, from 0.1 to more than one relapse per year. Such a variability is not surprising because of the frequent difficulties encountered by clinicians in defining a relapse and discarding a pseudorelapse. Furthermore, clear-cut differences in the estimates of the relapse frequency emerge when comparing retrospective and prospective assessments, the latter technique leading to higher figures than the former. The frequency of assessments is also important; the higher it is, the more sensitive the detection of relapses. That said, in the cross-sectional studies with ensuing retrospective assessment of relapses, the yearly relapse rate is usually found to be lower than 0.5. By contrast, in the studies with longitudinal prospective assessments, the yearly relapse rate is usually found to be higher than 0.5. Results from these prospective studies are fairly consistent with the figure of 2 years found for the median time from onset of MS to the second episode and for the subsequent relapses during the RR phase of the disease (the authors’ unpublished data). It may be concluded that 0.5 or slightly more is a reasonable estimate of the yearly relapse rate in a standard, representative RR population of MS patients.
Many authors consider that the relapse rate declines as the disease duration increases. This has been recently challenged by a North American study in which the relapse rate determined prospectively was stable during the 3-year follow-up and was not influenced by overall disease duration. The authors favor this latter conclusion, at least for the RR phase of the disease. Furthermore, as soon as the disease has entered its progressive and chronically disabling stages, relapse detection likely becomes less prioritized and more easily overlooked, resulting in an underascertainment.
Onset of Progression
Despite the methodologic difficulties already discussed, the interexaminer reliability in assessing the onset of progression is good, and thanks to the long-term natural history series currently available, knowledge of the onset of progression in MS can be considered evidence-based.
For an overall cohort of patients with MS, including cases with a progressive onset, estimates of the time from onset of MS to onset of progression are quite consistent. With calculations based on observed data only, Müller found a median time to progression of 10 years. Using survival techniques, median time to progression turned out to be 11 years in the Lyon series and 9 years in the Gothenburg series. In the London, Ontario, series, the corresponding figure was only 5.8 years, but it must be remembered here that the proportion of the cases classified as progressive from onset was unusually high in this cohort for reasons previously discussed. In all of these studies, an older age at onset of MS was associated with a shorter time to progression.
The other way of addressing the issue of the onset of progression is to consider specifically the population of cases with an RR onset of MS. This leads one to assess the risk of secondary progression. McAlpine and Compston are to be credited with being the first to demonstrate clearly that “there is a fairly constant rate of change from a remitting to a progressive course, and that there is a gradual rise in the total percentage of progressive cases as the disease advances.” A similar distribution has been found with analyses restricted to observed data by Broman and colleagues and with survival analyses in the Lyon series ( Fig. 6 ). The median time to secondary progression turned out to be 19.1 years among the 1562 patients with an RR onset in the Lyon series, 19 years among the 220 patients in the Gothenburg series, and 18.9 years among the 2484 patients from the British Columbia MS database. These results are consistent with others coming from smaller series. It may be concluded that 19 years is a reasonable estimate for the median time to secondary progression following an RR onset in MS and that, each year, 2% to 3% of the patients with a RR form of MS enter secondary progression.
Age at onset of MS is, by far, the strongest predictor of the conversion to secondary progression: the older the age at onset, the shorter the time to onset of progression. The influence of other clinical variables on the time to secondary progression is weaker than that of age at onset, or even nil. In general, a shorter time to secondary progression has usually been found to be associated with male gender; spinal cord–related symptoms as compared with optic nerve– or sensory- and, sometimes, brainstem-related symptoms; an incomplete recovery from the initial attack; a shorter time from onset of MS to the second neurologic episode; a higher number of relapses during the first 2 or 5 years of the disease; and a higher disability score or a greater number of the affected functional systems observed 5 years after the onset of MS.
The prognosis of multiple sclerosis
Current knowledge of the overall time course of irreversible disability in MS is well documented. Results obtained at the level of a population of patients with MS lead to the description of a homogeneous picture of the disease. This is dramatically contrasted with the broad heterogeneity that can be observed from one patient to another. A third and a priori surprising characteristic of MS is the steady and stable rate of accumulation of neurologic abnormalities, which can be observed at an individual level.
Overall Accumulation of Irreversible Disability
The Kaplan-Meier estimates for the median time from onset of MS to assignment of DSS 3 has been 7.7 years in the London, Ontario, series and 11 years in the Turkish series. As for DSS 4, it has been estimated at 8.4 years and 12.7 years. It is regarding the DSS 6 outcome that the largest amount of data has become available, with fairly consistent results. The median time to DSS 6 has been estimated at 15 years in the London, Ontario, series, 18 years in the Gothenburg study, 18 years in the Turkish study, 20.1 years in Lyon series, 14.1 years in the Florence series, and 20 years in the Norwegian series. It has been estimated at 27.9 years in the British Columbian cohort of 2319 patients, but there are several peculiarities in this series that may concur to overestimating the time to reaching disability outcomes. Noticeably, however, the smaller series of 201 patients with MS in the Olmsted County, United States, provided results quite close to the Canadian’s with median times to reach a DSS score of 3, 6, and 8 at 23, 28, and 52 years, respectively. As for DSS 7, the estimated median time has been 29.9 years in Lyon, whereas the 76th percentile time turned out to be 15 years in the Myhr and colleagues study. Lastly, for DSS 8, the median time was 46.4 years in the London, Ontario, series and the 75th percentile time 28 years in Turkish series. Fig. 7 displays Kaplan-Meier estimates for the times from onset of MS to assignment of irreversible disability scores among the 1844 patients with MS in the Lyon cohort. The median times to DSS 4, DSS 6, and DSS 7 were 8.4 years (95% confidence interval: 7.6–9.2), 20.1 years (18.2–22.0), and 29.9 years (25.8–34.1), respectively.
Interindividual Variability Versus Intraindividual Fixity
Contrasting with the wide interindividual variability in the rate of accumulation of irreversible disability, it is rather surprising to observe that, for a given patient, the rate of accumulation of neurologic abnormalities is remarkably steady and stable throughout the course of the disease. This has been independently demonstrated by Fog and Linnemann from 73 patients, and by Patzold and Pocklington from 102 patients ( Fig. 8 ). What differs among patients is the individual slope of the neurologic deterioration.
Factors Affecting the Prognosis
The prognosis varying considerably from one patient to another, it is of utmost importance for the clinician and the patient to get some clues for making predictions, notably in the first years of the disease, when decisions are to be taken with regard to personal and professional life but also treatment.
Regarding demographic and clinical variables, the results from the long-term longitudinal studies and from cross-sectional studies provide robust and consistent clues. A shorter time to reach disability landmarks has usually been found associated with the factors listed in Box 1 .
- 1.
Male gender, but this influence, when present, is weak.
- 2.
Older age at onset of MS. This effect has been considered by most authors as strong.
- 3.
An initial symptomatology consisting of a spinal cord syndrome, or motor-balance-pyramidal-cerebellar symptoms, or long-tracts dysfunction as compared with optic neuritis and, in some series, brainstem syndrome. This effect has usually been found to be mild to moderate.
- 4.
A progressive initial course, as compared with cases with an initial RR course. This is considered as the strongest clinical predictor of the time course of disability. An illustration is shown in Fig. 9 using the Kaplan-Meier method for the 1844 patients with MS of the Lyon cohort. The differences in the median times between cases with an RR onset and cases with a progressive onset to reach the DSS scores of 4, 6, and 7, could be estimated 11, 16, and 20 years, respectively. All these differences were highly significant.
Fig. 9
Kaplan-Meier estimates for the time (years) from the onset of MS to the assignment of an irreversible score of 4, 6, and 7 on the Kurtzke Disability Status Scale (DSS), among the 1844 patients in the Lyon, France, MS cohort. Influence of the initial course of the disease. ( A ) Estimates for the 1562 patients with an exacerbating-remitting initial course. The median times (95% confidence interval) for reaching a score of 4, 6, and 7 were 11.4 (10.5–12.3), 23.1 (20.1–26.1), and 33.1 (29.2–37.0) years, respectively. ( B ) Estimates for the 282 patients with a progressive initial course of MS. The median times for reaching a score of 4, 6, and 7 were 0.0, 7.1 (6.3–7.9), and 13.4 (11.0–15.9) years, respectively. ( From Confavreux C, Compston A. The natural history of multiple sclerosis. In: Compston A, editor. McAlpine’s multiple sclerosis. 4th edition. London: Churchill Livingstone Elsevier; 2006. p. 183–272; with permission.)
- 5.
An incomplete recovery of the initial neurologic episode.
- 6.
A shorter time to the second neurologic episode. This criterion has received much attention and delaying the time to the second neurologic episode has become a key outcome for the approval of DMAs when administered after a first neurologic episode suggestive of MS. This time-dependent parameter has been considered as not influential, however, when the survival estimates were calculated from the date of occurrence of the second episode as starting point in the Gothenburg and in the Lyon series (Renoux and colleagues, personal communication, 2008).
- 7.
A higher frequency and number of relapses during the first 2 to 5 years of MS. This effect, however, has usually been found to be quite weak. In some series, it was nil. There was also no effect in the Gothenburg study when the time-dependency of the variable was accounted for and the survival analysis estimates of the time to DSS 6 were calculated using 5 years after onset of MS as the starting point.
- 8.
A greater DSS score, or the presence of pyramidal or cerebellar signs, or a greater number of affected functional systems, as assessed at 2 or 5 years of disease duration. Kurtzke and colleagues is to be credited as being the first to demonstrate this association. Moreover, the Gothenburg study has demonstrated that the effect was still present when the time to the disability end point (DSS 6 in this series) was estimated by the survival analysis using 5 years after onset of MS as the starting point.
- 9.
A shorter time to reaching DSS 3 or DSS 4. In the Lyon series, however, this effect was present for reaching DSS 6 and DSS 7 when onset of MS was selected as the starting point. It was no longer present when the date of assignment of DSS 4 was selected.
- 10.
A shorter time to secondary progression.
This list of clinical factors with a predictive value of the outcome in MS seems impressively long. Many of these factors are interdependent in their prognostic effect and share their predictive influence, at least partly. This is notably the case for the cluster gathering gender, age at onset of MS, initial symptoms, and initial course of the disease: older age at onset, dysfunction of long tract–related initial symptoms, progressive initial course, and male gender are associated with a worse outcome, whereas the combination of younger age at onset, optic neuritis as initial symptom, RR initial course, and female gender is associated with a better prognosis. Initial course of MS is the most influential factor on the prognosis. Age at onset of MS holds the second place. Initial symptoms and gender have a marginal or even a nil effect when initial course and age at onset are already taken into account. Although highly significant at the statistical level, the prognostic effect of these variables is moderate, at best, even when combined. Although its interest is undeniable for a general population of patients with MS, this is not the case at an individual level.
There has been an intense search for paraclinical factors predictive of the outcome of MS. Abnormalities on the baseline brain MR image have a predictive value. In a study involving 84 patients with an initial monofocal episode suggestive of MS, the T2 lesion load on baseline MR image was strongly correlated to the disability level 5 years later. Similar results have been obtained in Barcelona for 156 patients with a clinically isolated syndrome followed for a median of 7 years: the EDSS score at 5 years correlated with the number of lesions and of Barkhof criteria at baseline. The Queen Square prospective observational study of 71 patients presenting with clinically monofocal episodes and followed up to 14 years demonstrated that the EDSS assessed at the end of the follow-up was significantly correlated with the T2 lesion volume at baseline and the increase in T2 lesion volume at all time points (baseline and 5, 10, and 14 years of follow-up). The correlation was the highest, although moderate, for MR imaging at 5 years ( r = 0.60) and the increase over the first 5 years of the disease ( r = 0.61). The same group has been able to reassess 107 patients after a mean of 20.2 years among the initial group of 140 patients admitted for a first neurologic episode suggestive of MS. This led to confirmatory results of the previous study: baseline brain MR imaging findings are predictive for the development of CDMS and T2 lesion volume and its changes at earlier time points are predictive of later disability. This study also brought about that, among patients with an initial RR course of MS, the rate of increase in the T2 lesion volume was three times higher in those who converted to SPMS than in those who remained in the RR stage during the follow-up. Interestingly, this study clearly showed a linear correlation between the number of T2 lesions on the baseline MR image and the likelihood of reaching a score of DSS 6 during the follow-up: it ranged from 6% for patients with no lesion to 45% for patients with at least 10 lesions on the baseline MR image. Noticeably, however, among patients with at least 10 lesions on baseline MR image, still 35% had an EDSS score not higher than 3 and 18% had not converted to CDMS.
The search for other paraclinical factors that could be predictive of the outcome has not been rewarding up to now. This is the case for the presence of oligoclonal bands in the cerebrospinal fluid and for prolonged latencies on the visual evoked potentials at onset of MS. The presence of the HLA-DR15 allele does not significantly influence the course and severity of the disease. The influence of the apolipoprotein E alleles is still a matter of controversy. According to several large series of patients with MS, the epsilon 4 allele is associated with a rapid accumulation of disability and an accelerated evolution of brain MR imaging abnormalities. For others, this allele is not influential.
Currently, only MR imaging can provide useful adjuncts to the clinical evaluation for improving outcome predictions in MS. Unfortunately, as precise and reliable clinical and MR imaging predictors may be at the level of a population of patients, they are still too imprecise and unreliable for individual predictions. To conclude, two considerations deserve emphasis. First, the predictive factors of the disability accumulation in MS are essentially the same as those that are predictive of SPMS, which is not really surprising. Second, two phenomena seem to be operating: a weak interplay between relapses and prognosis contrasting with a strong interplay between age and prognosis. This is further discussed later.
Benign Multiple Sclerosis
As for many of the currently acknowledged clinicopathologic distinguishing features of MS, Charcot was the first to envision that the disease could become completely quiescent or even recover. Six decades later, Brain endorsed the same opinion. But it is the seminal work of McAlpine that has made popular the concept of benign MS (BMS). By studying an essentially hospital-based population of 241 patients with MS seen within 3 years of onset and followed-up until 15 years or more, McAlpine was able to demonstrate that 62 patients (26%) were still unrestricted, that is “without restriction of activity for normal employment and domestic purpose but not necessarily symptom-free,” after a mean disease duration of 18.2 years. All these patients were able to walk for more than 500 m without rest or support from a stick. This would qualify them nowadays for a DSS score of no more than 4. This figure of 26% is strikingly consistent with the results obtained with survival analysis techniques in long-term longitudinal follow-up studies of large natural history cohorts. For instance, in the Lyon cohort of 1844 patients with MS, patients with an initial progressive course included, 35%, 26%, and 13% of the patients had not reached the irreversible DSS 4 landmark at 15, 20, and 30 years of disease duration, respectively. The reassessment of the Gothenburg cohort after a 37- to 50-year follow-up allowed to estimate by a Kaplan-Meier analysis that the proportions of benign cases at 30 and 40 years of disease duration were 26% and 21%, respectively. To be classified as benign in this study, patients had to be free of secondary progression and have an EDSS score of no more than 4 at follow-up.
Presently, any physician agrees on the existence of BMS. The reality of the concept is reinforced by the well-known incidental findings of MS at autopsy or at neuroimaging examinations. There is also a strong consensus about the archetypal clinical phenotype of BMS, which recruits mainly among young women and usually follows an initial RR course.
Several issues regarding BMS, however, are still debated. The first deals with the criteria qualifying for BMS. According to the results of the international survey undertaken by the United Sates National Multiple Sclerosis Society, the consensus definition is “disease in which the patient remains fully functional in all neurologic systems 15 years after disease onset.” There is still some imprecision in this definition about the boundaries of “fully functional.” Furthermore, somewhat different definitions are used by different authors depending on the upper limit allowed for the disability score (usually DSS 3 or DSS 4) and on the minimum duration of the disease required (varying from 10–20 years, usually). In about half of the patients with a so-called BMS, inapparent symptoms, such as fatigue, pain, depression, and cognitive dysfunction, can be identified interfering with activities of daily life in otherwise fully ambulatory patients. It is difficult to compare results between studies.
Another difficulty comes from the fact that patients with BMS often escape neurologic attention. The authors analyzed the group of all suspected patients with MS in the geographic area of Southern Lower Saxony, amounting to 221 patients. They compared this group with the 1837 cases collected throughout Germany mainly in the hospitals taking part in a national epidemiologic program devoted to MS. In the geographically based series, there were many cases that had never attended any hospital or any outpatient department. Although the mean disease duration was longer in the Saxony cohort (12.1 years) than in the hospital cohort (10.5 years), the percentage of patients unrestricted or minimally restricted at the time of the survey was 52% in the Saxony cohort compared with 26% in the nation-wide hospital cohort.
Another point deserves comment: it is always difficult, if not risky, to be confident that an individual classified in the BMS category will remain so thereafter. This is illustrated by the survival curves, which show a steady decrease in the proportion of individuals still free of the disability end point with increasing disease duration. This is also illustrated by comparative serial analyses in the long-term of a given population of patients with MS: about half of the patients classified as “benign MS” at some time point of the disease no longer fall in this category when reassessed 10 years later. Altogether it may be considered that the figure of 30% is a reasonable estimate of the proportion of benign forms in MS.
Multiple Sclerosis with Childhood Onset
After being denied and then neglected for several decades, childhood-onset MS has received great attention recently and, as the number of studies devoted to childhood-onset MS increases, knowledge becomes more complete. This has been notably the case since the publication of the results of the Kids with MS (KIDMUS) study, an observational multicenter study of 394 patients who had MS with an onset at 16 years of age or younger and who were compared with a group of 1775 patients who had MS with an onset after 16 years of age. Onset of MS in childhood is rare, around 2% of the total cases with the disease. It has a female preponderance and most studies have found a gender ratio (female/male) ranging from 2.2 to 3, higher than in adult-onset MS. The cases with a very early onset, however, tend to show a higher number of males affected. The diagnosis in children is challenged by the differential diagnosis with acute disseminated encephalomyelitis. Among 296 patients with a first demyelinating event of the CNS before the age of 16, with a mean follow-up of 3 years, 20% of the 168 patients with a final diagnosis of MS had been initially diagnosed as acute disseminated encephalomyelitis. It can roughly be estimated that isolated optic neuritis occurs in approximately 20% to 25% of the patients with childhood-onset MS, isolated brainstem dysfunction in 10% to 25%, and isolated long-tract dysfunction in 40% to 50%. In a small proportion of cases, neurologic symptoms may be accompanied by various encephalitic manifestations. An RR course is by far the most common form at onset in all published studies with a relapse as the first manifestation of the disease in 85.7% to 97.7% of cases. According to the KIDMUS study, the Kaplan-Meier estimates for the median time from the onset of MS to the second neurologic episode was 2 years, with no difference with adult-onset MS (2.2 years). By contrast, patients with childhood-onset MS converted to SPMS on average 10 years later than patients with adult-onset MS but reached this phase of the disease on average 10 years younger. The same observation could be made for the reaching of disability landmarks of DSS 4, DSS 6, and DSS 7 ( Fig. 10 ). Once a certain threshold of irreversible disability had been reached, further accumulation of disability developed at a similar pace in childhood- and adult-onset MS patients.
Related posts:
 The Pathologic Substrate of Magnetic Resonance Alterations in Multiple Sclerosis
 MR Image Postprocessing for Multiple Sclerosis Research
 Basic Principles of Magnetic Resonance Imaging
 Brain Atrophy Assessment in Multiple Sclerosis: Importance and Limitations
 MR Relaxation in Multiple Sclerosis
The Use of MR Imaging as an Outcome Measure in Multiple Sclerosis Clinical Trials
MR Relaxation in Multiple Sclerosis
The Use of MR Imaging as an Outcome Measure in Multiple Sclerosis Clinical Trials
Stay updated, free articles. Join our Telegram channel

Full access? Get Clinical Tree


