MR imaging is an integral part of multiple sclerosis (MS) clinical trials. It provides the primary efficacy outcome of preliminary proof-of-concept studies and important corroborating data as secondary and exploratory outcomes in pivotal trials. At all stages of drug development, MR imaging provides important information on the kinetics and magnitude of treatment effect and insight into potential mechanisms of action. Attention to issues in scan acquisition, quantitative image processing, and statistical analysis is critical to generate high-quality data. Although it is unlikely that one single outcome measure can capture all aspects of the MS disease process, there is potential for MR imaging outcomes to evaluate inflammatory and degenerative components within clinical trials.
Rationale for MR imaging as an outcome measure in multiple sclerosis clinical trials
Multiple sclerosis (MS) is characterized pathologically by multifocal central nervous system (CNS) lesions with a combination of inflammatory demyelination and axon loss. These processes are likely tempered by innate mechanisms of remyelination and neural plasticity, the rates of which are insufficient to compensate for the ongoing pathologic changes in most patients. Even without complete knowledge of MS pathogenesis, promising new therapies are actively being evaluated. Clinical trials of any new therapeutic agent depend on sensitive indices of disease activity to detect benefit. These measures ideally should be directly linked to the mechanism of disease.
The principal impetus for use of MR imaging as an outcome measure in MS clinical trials is potentially greater sensitivity to change and treatment effects compared with clinical measures. The ultimate goal of MS disease therapy is to prevent relapses and accumulation of neurologic disability. Demonstration of benefit on these aspects is required for regulatory approval of new treatments. The direct relevance to patient outcome is at the expense of efficiency, however. Even when tested in patients preselected for a high risk for relapse or disability progression, required sample sizes are large and follow-up relatively prolonged, rendering phase III trials resource-intensive. In addition, in several neurologic diseases, including MS, clinical manifestations often develop late, sometimes after substantial irreversible tissue damage has accumulated. Likewise, in phase II trials, insensitive outcomes are undesirable, because the potential for treatment-related adverse events and placebo-related disease activity necessitates small sample sizes. The inefficiency of clinical outcomes is of even greater concern, because the availability of effective therapies for MS increasingly necessitates inclusion of an active treatment comparator for practical and ethical reasons in the testing of new therapies, which substantially increases the sample size, complexity, and cost of clinical trials. Thus, there is great impetus to develop more sensitive outcome measures.
Lesion activity on MR imaging exceeds clinically apparent relapses 5- to 10-fold, providing a much more sensitive measure of the disease process. Statistical power is further enhanced by the continuous nature of some MR imaging variables. When analyzed by a blinded “central reading center” within a clinical trial, MR imaging data provide an independent quantitative means to supplement potentially subjective clinical ratings. MR imaging raw data can be archived and reanalyzed to assess for reproducibility or even extract new variables that were unrecognized at the initial time of the study.
Therefore, MR imaging has received substantial consideration as a potential surrogate measure for MS clinical trials. Prentice defined stringent formal criteria for a surrogate measure. At this time, despite the promise of MR imaging, it does not fulfill the requirements of a surrogate measure. Nevertheless, there are many advantages to using MR imaging–based outcome measures in MS clinical trials ( Box 1 ). MR imaging is useful as the primary end point in early trials providing preliminary evidence of efficacy and as secondary and exploratory end points in pivotal trials providing supporting evidence of efficacy corroborating clinical measures. At all stages of drug development, MR imaging provides data on safety and mechanism of action.
1. Higher sensitivity to disease activity
2. Easy blinding of MR imaging raters to treatment and clinical status (independent analysis and greater objectivity)
3. Greater precision and reproducibility over clinical measures
4. Can provide continuous variables on linear scales
5. Potential retrieval of raw data for post-hoc analyses
6. More closely represents the underlying pathologic findings, potentially yielding drug mechanism–specific information
The degree of the relative advantages varies, based on the specific measure chosen ( Table 1 ).
| Modality | Pathologic Finding Assessed | Specificity | Multicenter Feasibility |
|---|---|---|---|
| Measures of inflammatory activity | |||
| T2 lesions | Combined | + | ++++ |
| GdE lesions | Acute inflammation | ++ | ++++ |
| Measures of axonal/neuronal integrity | |||
| T1 “black holes” | Axons/myelin | ++ | ++++ |
| Whole-brain atrophy | Combined | + | ++++ |
| GM atrophy | Combined | ++ | +++ |
| MTR | Myelin | +++ | ++ |
| Magnetic resonance spectroscopy | Axons | ++++ | ++ |
| DTI | Axons/myelin | +++ | ++ |
| fMRI | Function | ++ | + |
Standard MR imaging measures in MS clinical trials include measures of lesion activity (gadolinium-enhancing [GdE] lesions and new or enlarged T2-hyperintense lesions) and measures of disease severity or burden (total T2-hyperintense lesion volume, total T1-hypointense lesion volume, and whole-brain atrophy). The field has substantial experience in implementing these measures in multicenter clinical trials, estimating the required sample size, statistical analysis of the data generated, and assessing the results of these analyses. A variety of new MR imaging measures potentially provide additional pathologic specificity, or sensitivity to change and treatment effects (magnetization transfer imaging [MTI], diffusion tensor imaging [DTI], proton magnetic resonance spectroscopy [ 1 HMRS], regional atrophy, and functional MR imaging [fMR imaging]) (see Table 1 ).
Standard MR imaging measures of disease activity
Gadolinium-Enhancing Lesions
Lesions that are hyperintense on T1 images after administration of gadolinium (Gd) represent focal areas of blood-brain barrier (BBB) disruption, which are presumed to represent areas of active inflammation in MS. After the acute inflammatory stage, MS lesions typically cease to enhance over 2 to 4 weeks. Therefore, GdE activity on a single scan provides information on disease activity over a relatively narrow time window. When scans are performed at frequent (eg, monthly) intervals, the total number or volume of GdE lesions provides a cumulative measure of disease activity over the entire interval. Periods of clinical worsening correlate with increased GdE lesion burden. The relation between GdE lesion activity and neurologic disability is weak over short intervals but stronger over longer intervals. Two factors account for the poor correlation: (1) lesions frequently occur in noneloquent regions of brain and (2) studies have not been sufficiently long to capture the cumulative disability that results only after years of lesion accrual.
Several technical factors must be addressed to ensure valid analysis of GdE lesions in clinical trials. The dose of Gd, time from injection to scanning, and acquisition parameters must be standardized. Higher contrast doses (eg, triple dose) and a planned delay to imaging increase the sensitivity of enhancing lesion detection. It remains uncertain whether the GdE lesions detected with different doses of contrast represent comparable pathologic processes, however. Scan acquisition and pulse sequence should be designed to minimize the intrusion of T2 effects into the postcontrast scans, which could lead to false-positive results. Image processing software must allow review by the operator to “veto” pixels incorrectly identified as GdE lesions (eg, blood vessels). In general, total GdE lesion number and volume vary in parallel. A therapeutic agent conceivably could alter lesion evolution but not lesion initiation; as a result, it could decrease GdE volume but not the number of GdE lesions, dissociating the two measures. Therefore, in general, both parameters should be measured in a clinical trial.
New or Enlarged T2-Hyperintense Lesion Number
Because of their transient nature, GdE lesions on a single scan indicate disease activity at that time point only. Because GdE lesions are virtually always associated with T2-hyperintensity, enumerating the number of T2 lesions that are new or enlarged on a follow-up scan compared with baseline provides a measure of lesion activity over that period. T2 lesions comprise a variety of tissue changes, including edema, inflammation, demyelination, remyelination, axon loss, and gliosis. Significant month-to-month fluctuation in T2 lesion volume is attributed to these biological factors as well as technical variability. The criteria for lesion enlargement must take this into account and be defined in advance of data analysis. A typical definition is to classify a lesion as enlarged if it has a 50% increase in diameter (if smaller than 5 mm) or a 20% increase in diameter for a lesion larger than 5 mm. To avoid double-counting T2 lesions that are also GdE, the parameter “combined unique active lesions” is useful.
Standard MR imaging measures of disease severity
T2-Hyperintense Lesion Volume
The most useful method of quantifying the overall “burden of disease” is total volume of abnormal T2-hyperintensity. Despite its lack of pathologic specificity, T2 lesion burden early in the disease strongly predicts long-term disability and brain atrophy. When implementing T2 lesion burden in a clinical trial, acquisition parameters must be standardized and optimized to maximize sensitivity and reproducibility. Reliable longitudinal detection of small T2 lesions requires protocols with thin tissue slices (generally 3 mm) without interslice gaps. Cerebrospinal fluid (CSF)–suppressed sequences, such as fluid-attenuated inversion recovery (FLAIR), increase sensitivity for periventricular and subcortical lesions compared with traditional T2-weighted or proton density–weighted sequences. The same T2-weighted sequence (conventional spin-echo versus rapid acquisition with relaxation enhancement [RARE] versus a fluid-suppressed sequence) must be used across all sites. Because lesion boundaries are indistinct, automated segmentation approaches are preferable to manual methods because of their greater precision. Conversely, with automated techniques, approaches to limit misclassification of lesions, which can have signal intensity similar to brain tissue or CSF depending on lesion stage and MR imaging pulse sequence, are necessary.
T1-Hypointense Black Holes
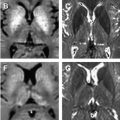
A proportion of T2-hyperintense lesions (5%–20%) are hypointense on non-enhanced T1-weighted images, so-called “T1 black holes,” representing areas with irreversible tissue loss and axonal destruction. Approximately half of GdE lesions evolve into chronic T1 black holes, making baseline GdE lesion number a strong predictor of subsequent T1 black holes. However, early GdE lesions themselves may appear transiently hypointense on T1-weighted images, due to edema. For this reason GdE lesions should be excluded from the total volume of T1 holes. Total T1 black hole volume correlates more strongly than T2 lesion volume with physical disability, although the absolute magnitude of the correlation remains modest. A stronger association between T1 black hole volume and whole-brain atrophy measures in most studies suggests that axonal disconnection from chronic lesions contributes at least in part to brain atrophy development. Thus, total T1-hypointense lesion volume provides a measure of the burden of severe brain tissue destruction.
Whole-Brain Atrophy
Tissue loss can be viewed as the final common pathway for the wide variety of pathologic processes that occur in MS, which can be captured by measurement of whole-brain atrophy. This lack of specificity is an advantage and a shortcoming of brain atrophy as an outcome measure. Whole-brain atrophy becomes extremely apparent in the middle to late stages of the disease, but it is detectable even in the earliest stages of the disease, suggesting substantial subclinical pathologic change. Short-term whole-brain atrophy progression predicts long-term disability.
Multiple techniques have been developed to measure brain atrophy, including manual linear measurement of central or regional atrophy, semiautomated or automated methods of measuring whole-brain atrophy using segmentation-based techniques, and registration-based techniques to identify changes in brain volume over time. Brain atrophy progression and treatment effects can be detected in a 2-year clinical trial when precise automated techniques that normalize brain volume are used. Sample size estimates to demonstrate treatment benefit on whole-brain atrophy progression are similar to those required for lesion analyses. For example, to demonstrate a 50% effect size with 90% power, 44 subjects per arm are needed for a 2-year trial.
An important issue with the use of brain atrophy in clinical trials is that the magnitude of change is small in short-term trials and different measures can produce conflicting results because of differences in reproducibility, susceptibility to artifacts, geometry as a function of anatomic site, and biologic factors determining the rate of atrophy in different structures. In addition, brain volume fluctuates as a result of tissue water content related to hydration status and inflammatory activity. This issue is especially relevant to high-dose corticosteroids, which can induce “pseudoatrophy” depending on the timing of their use relative to scan acquisition. Anti-inflammatory effects of MS disease-modifying agents can cause apparent acceleration of atrophy progression at the initiation of therapy. Therefore, when using normalized brain atrophy as a key outcome measure in a clinical trial of an agent expected to have anti-inflammatory activity, it may be useful to use a scan obtained, for example, at month 3 as a revised baseline.
Exploratory MR imaging measures for clinical trials
MR imaging is useful to track the inflammatory components of MS. Inflammation alone, however, as currently measured by the lesions seen on conventional MR imaging, accounts incompletely for disability progression. In studies of a variety of agents in secondary progressive MS, neurologic disability and brain atrophy continued to progress despite effective inhibition lesion activity on MR imaging. Therefore, the MR imaging outcomes presented up to this point are unlikely to help in testing treatments targeting the progressive or degenerative component of MS, including potential neuroprotective or reparative strategies. Several imaging approaches have been proposed to provide additional pathologic specificity with greater ability to monitor tissue integrity within lesions visible on standard imaging, normal-appearing brain tissue (NABT), and gray matter (GM).
Magnetization Transfer Imaging
MTI quantifies the interaction between MR imaging–visible free water protons and MR imaging–invisible protons associated with macromolecules (proteins and lipids), providing a measure of tissue integrity, particularly myelin in the brain. MT is quantified using the magnetization transfer ratio (MTR). Demyelination and decreased axonal density decrease MTR compared with normal tissue. Whole-brain MTR correlates strongly with T2 lesion volume and with whole-brain atrophy, raising some question of its added value in clinical trials. MTI provides information on preservation of tissue structure, however, distinguishing it from these other measures.
One approach is to measure MTR over the entire brain, generating a frequency distribution of MTR versus voxel count. Whereas normal controls have a narrow range of MTR values, patients who have MS have a higher proportion of voxels with low values, resulting in a lower mean and higher variance. Whole-brain histogram analysis on a relatively large scale (82 patients from five centers) failed to show an effect on MTR for interferon β-1b in secondary progressive MS. An alternative approach is to measure MTR in defined regions, such as lesions, NABT, white matter, or GM. Following MTR in individual lesions over time, looking for stabilization (suggesting preservation of myelin and axons) or improvement (suggesting remyelination) is a potential way to test neuroprotective or repair strategies. Benefit was demonstrated in small studies for intravenous methylprednisolone (IVMP) and interferon-β using this approach.
Inclusion of MTI in large-scale multicenter trials has been limited by technical issues and difficulty with standardization across sites. These impediments are not as great as with some other advanced imaging measures, however. Guidelines for incorporation of MTI into trials recently were published.
Diffusion Tensor Imaging
With DTI, the diffusivity of water molecules is quantified in multiple spatial directions to determine the orientation and integrity of fiber tracts. As fiber tracts undergo axon loss, their spatial anisotropy is disrupted and molecules diffuse more equally in all directions. This is manifest as increased mean diffusivity and decreased fractional anisotropy. DTI seems to be sensitive to disease-related changes in NABT, even over short periods. Analogous to MTI, DTI can be performed on the whole brain, yielding a frequency distribution of values, or in regions of interest. Both approaches can be applied longitudinally over time. A preliminary study suggested that DTI can be performed reproducibly at high field strength across multiple study sites.
Proton Magnetic Resonance Spectroscopy
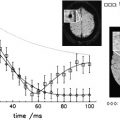
1 HMRS is a technique that derives a nuclear magnetic resonance spectrum from a volume of tissue, yielding relative concentrations of the major proton-yielding metabolites. The most prominent peak in the spectrum from the CNS is N -acetyl aspartate (NAA), almost exclusively contained within neurons and their processes. The concentration of NAA, measured most commonly as a ratio of NAA to creatine (Cr), decreases when there is neuronal dysfunction, damage, or axonal or neuronal loss. Decreased NAA/Cr ratio was demonstrated within MS lesions and in NABT. Use of 1 HMRS in clinical trials has been limited, but studies of interferon-β and glatiramer acetate demonstrated treatment benefit.
Issues complicating the use of 1 HMRS in multicenter trials include the need for standardization of techniques across centers, and the limitations of single-voxel techniques (which are difficult to duplicate over time within patients). With the growing capability of whole-brain MRS techniques, some of these issues may be overcome. New recommendations were published to facilitate the use of 1 HMRS in multicenter clinical trials.
Spinal Cord Atrophy
A significant portion of the physical disability in MS results from spinal cord involvement and subsequent upper extremity and gait impairment. Patients who had MS were shown to have significant spinal cord atrophy compared with normal controls (up to 40% volume loss), particularly in primary progressive (PP) MS, which progresses over periods as short as 1 year. Spinal cord atrophy has not yet been used as a supportive outcome in a major clinical trial, although this approach potentially is of interest, particularly in progressive disease. The principal impediment has been poor reproducibility.
Localized Brain Atrophy
It is possible to separate brain volumes into different compartments, using automated or manual parcellation software. One distinction of particular interest is GM versus white matter. Selective GM atrophy has been noted early in relapsing-remitting (RR) MS and PPMS and correlates with disease severity. Measurement of lobar atrophy also is feasible and may correlate best with specific cognitive measures. Localized measures of brain atrophy have not been applied prospectively in a major clinical trial. It may be possible to analyze preexisting data sets post hoc, however.
Functional MR Imaging
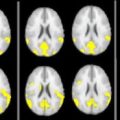
Focal damage in MS elicits not only attempted tissue repair but neural plasticity, with reassignment of function to other anatomic sites. fMR imaging can be used study the effects of MS on specific pathways and provides a way to interrogate these compensatory mechanisms. Most methods use the different magnetic properties of oxygenated and deoxygenated blood to identify regions of increased or decreased cerebral blood flow (called the blood oxygen level–dependent [BOLD] technique). There may be particular utility in using fMR imaging to study effects on fatigue, a consequence of the disease that has been difficult to quantify objectively thus far. fMR imaging protocols highly dependent on a standardized methodology, as implemented by technicians and other study staff, rendering it challenging to implement longitudinally in multicenter trials.
Purposes served by MR imaging in clinical trials
Some of the measures discussed here are now routinely incorporated into clinical trials at all stages of drug development, wherein they serve multiple purposes. Nevertheless, the emphasis is different in phase I, phase II, and phase III studies.
Subject Selection
MR imaging is commonly used to support the diagnosis of MS in clinical practice and, likewise, for enrollment in clinical trials. Increasingly, trials allow diagnosis of MS by criteria in which dissemination of pathologic change anatomically or over time is confirmed by MR imaging. This effectively expands the pool of subjects eligible for clinical trials. MR imaging is also helpful in excluding subjects who have other neurologic diagnoses mimicking MS.
Requiring GdE lesions on a baseline MR imaging scan has been used as a way to enrich study populations with subjects more likely to experience ongoing disease activity during the trial, and thus able to demonstrate benefit from the intervention. The phenomenon of regression to the mean dictates that periods of activity may be followed by a quiescent period, however, even in the absence of therapy. Therefore, the magnitude of benefit is difficult to quantify without a parallel placebo group.
If randomization is successful in large-scale trials, treatment groups should theoretically be well matched for MR imaging parameters at baseline. In smaller trials (those that are most likely to rely on MR imaging as an outcome measure), randomization may not be effective for all characteristics. Analysis of a screening MR imaging scan for a variable of interest (ie, the presence of GdE lesions) allows the investigators to balance the randomization of treatment allocation a priori, limiting potential confounders in small studies. It is also possible to compensate for potential imbalances statistically; however, at times, results of this approach may be difficult to interpret.
Assessment of Efficacy
Given their increased sensitivity over clinical outcomes, MR imaging measures of MS disease activity are ideally suited to preliminary trials aimed at exploring efficacy of new immunomodulatory agents expected to have a rapid and prominent effect on lesion activity. Use of MR imaging outcomes allows smaller sample size and shorter study duration, with less exposure of study populations to an agent with which there may be limited experience.
The effect of a novel treatment on cumulative disease severity can also be assessed by MR imaging. Quantifying the overall volume of T2 lesions is the most routinely performed measure of overall burden of disease, although whole-brain atrophy is becoming increasingly more common. Measures of cumulative tissue integrity can include T1 black hole volume and advanced MR imaging techniques.
Even in initial small-scale trials, a treatment’s relative effect on different MR imaging measures can yield information about the kinetics and mechanism of action of the tested therapy. For instance, a potent suppression of GdE lesions would imply an anti-inflammatory mechanism of action, whereas an improvement on MTI or 1 HMRS-derived metrics would suggest tissue repair. The timing of an agent’s biologic effect (influenced by its pharmacokinetics and pharmacodynamics) is often first identified in a phase I or phase II study using frequent MR imaging to monitor closely for the outcome of interest.
Monitoring Safety
In initial studies of novel therapies, scans obtained shortly after initiation of treatment can be used to monitor for unexpected increase in disease activity suggesting “reverse efficacy,” as was seen in trials of interferon-γ, altered peptide ligand, and anti–tumor necrosis factor-α. Increased tissue damage can occur despite a therapeutic decrease in inflammation, for example, the increased rate of brain atrophy seen after immunoablation with bone marrow transplantation rescue. With emerging potent immunomodulatory therapies, neoplasia and opportunistic infection (eg, progressive multifocal leukoencephalopathy) are concerns. Thus, MR imaging also functions as an important safety outcome measure. During development of the protocol, it must be decided whether MR imaging scans are to be monitored for safety issues at the central reading center or at the individual sites.
Related posts:
 The Pathologic Substrate of Magnetic Resonance Alterations in Multiple Sclerosis
 MR Image Postprocessing for Multiple Sclerosis Research
 Basic Principles of Magnetic Resonance Imaging
 Brain Atrophy Assessment in Multiple Sclerosis: Importance and Limitations
 MR Relaxation in Multiple Sclerosis
 The Clinical Epidemiology of Multiple Sclerosis
Stay updated, free articles. Join our Telegram channel

Full access? Get Clinical Tree


