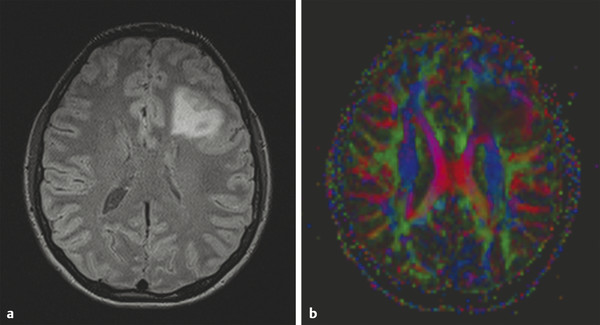
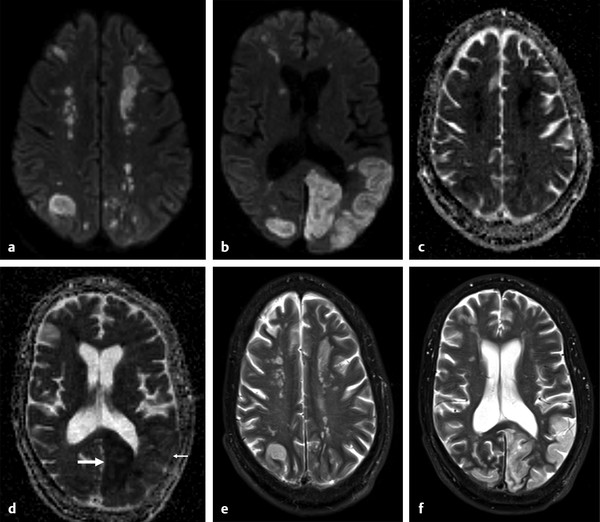
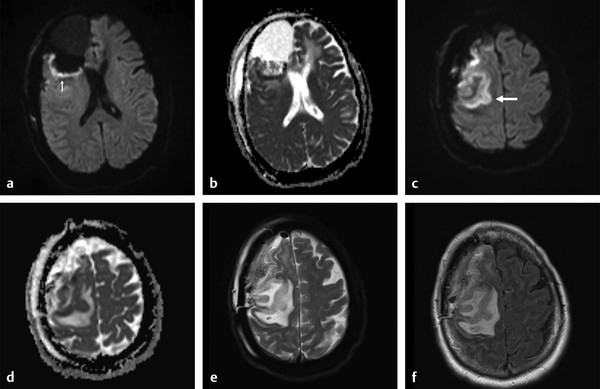
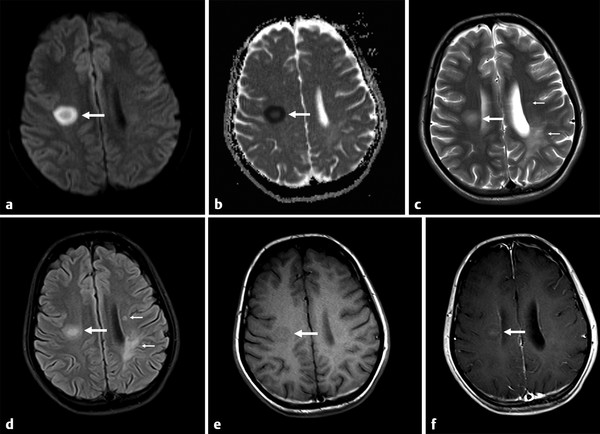
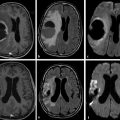
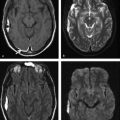
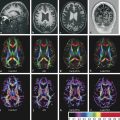
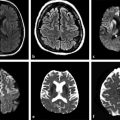
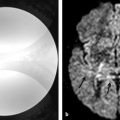
Several forms of edema have been identified under the larger rubric of “brain edema.” These generally fall into the cellular or extracellular forms. Cellular edema denotes cytotoxic edema (CE). Extracellular edema refers to vasogenic edema (VE) and “special” forms of osmotic edema and hyperemic edema.1,2 The pathophysiology of these forms of brain edema were characterized and defined more than 50 years ago.1 This chapter defines the two most common forms of brain edema (VE and CE), discusses their imaging characteristics, and presents representative disease processes that can be readily investigated using diffusion weighted imaging (DWI) and diffusion tensor imaging (DTI). The text incorporates causes of excitotoxic brain injury (EBI), which ultimately leads to cytotoxic edema. VE and CE can present separately or in combination. This chapter demonstrates a wide variety of representative and commonly seen adult-specific conditions that have DWI and DTI findings, spanning multiple categories of diseases, including vascular, infectious, inflammatory, neoplastic, and demyelinating diseases. Subsequent chapters provide in-depth discussions of additional diseases and their DWI and DTI findings. VE results from leakage of fluid through a disrupted blood–brain barrier (BBB). Although extracellular protein breakdown has been shown to attenuate fluid clearance, no evidence to date suggests that the protein breakdown products result in fluid exiting the vascular space.3 Through a combination of bulk flow and diffusion of water, fluid accumulates preferentially in the usually tightly bundled white matter. If the BBB is reconstituted early in the process, the VE can be reversed.4 EBI includes temporary or permanent dysfunction of excitatory amino acid homeostasis. Among the excitatory amino acids glutamate, aspartate, and glycine, glutamate is the most important. It is involved in numerous functions, such as cognition, memory, movement, and sensation.5 Abnormal levels of glutamate can cause neuronal injury and demise related to activation of the N-methyl-d-aspartate (NMDA) receptor subtype of the glutamate receptor.6 In the acute phase, three mechanisms are known to cause excessive extracellular glutamate: (1) glutamate leakage from disrupted axonal membranes, (2) abnormal neuronal membrane depolarization causing further glutamate release, and (3) dysfunctional reuptake of extracellular glutamate. These mechanisms can self-propagate in a transaxonal or transynaptic manner along white matter tracts.5,6,7 Abnormal increases in intracellular water content cause CE. On the molecular level, the sodium–potassium (Na+-K+) adenosine triphosphatase (ATPase) and calcium ion pumps become dysfunctional, resulting in net diffusion of water into the cell. The BBB remains intact initially, yielding stable extracellular water content. Continuous insults cause BBB breakdown and subsequent VE. Apoptotic pathways are activated as well.7 The discovery of various subtypes of aquaporin (AQP) channel proteins has shed light on another mechanism of CE.8 Specifically, AQP-4 channels are found in the brain and allow massive free water transport across the astroglial endfeet membranes.9 These findings are supported by numerous mouse model studies10,11; however, the relationship between these water channels and cerebral edema in humans remains to be demonstrated. On magnetic resonance imaging (MRI), VE is T1 hypointense and T2 hyperintense, predominantly within the white matter. VE is bright on both DWI and ADC maps. Decreased fractional anisotropy (FA) is seen on DTI sequences.4 Both benign and malignant neoplasms can cause VE due to tumor angiogenesis and BBB breakdown and show increased diffusivity on DWI and ADC maps. Type-1 peritumoral VE is associated with low-grade (▶ Fig. 2.1) and nonglial tumors, such as metastases and meningiomas. Parenchymal compression causes ischemia and necrosis, which can persist after the tumor is removed. Fig. 2.1 A 42-year-old man with a supratentorial pilocytic astrocytoma with surrounding edema displacing adjacent white matter tracts. (a) T2-fluid=attenuated inversion recovery image showing a well-defined tumor in the right parietal lobe with internal cystic components and layering debris, along with surrounding vasogenic edema (arrow). (b) Diffusion weighted imaging shows slight hyperintensity in the surrounding edema. (c) Apparent diffusion coefficient map confirms that this surrounding area is T2 shine-through. (d) Color fractional anisotropy map shows displacement of deep white matter tracts (arrow) without evidence of disruption or destruction. Type-2 peritumoral edema is associated with high-grade glial neoplasms, which show highly infiltrative behavior and significant destruction of the BBB. VE extension beyond the vicinity of enhancing tumor is characteristic and represents tumor microinvasion (▶ Fig. 2.2). Partial to complete resolution of VE can occur after removal of the tumor. Relative to type-1 VE, type-2 edema shows more increased ADC signal and further diminishment of FA on DTI, likely related to greater tissue destruction by malignant neoplasms. Fig. 2.2 A 27-year-old woman with left frontal anaplastic astrocytoma with infiltration of regional fiber tracts. (a) T2-fluid-attenuated inversion recovery image showing a relatively well defined left frontal T2 hyperintense mass extending to the anterior body of the corpus callosum. (b) Axial diffusion tensor imaging color fractional anisotropy map shows destruction of fiber tracts in the region of the mass and infiltration of fiber tracts at the medial margin as shown by loss of the normal white matter tracts (compare to right hemisphere for reference). Computed tomography shows a loss of gray–white matter differentiation early in CE/EBI. In subacute phases, BBB breakdown can show white matter hypoattenuation of VE, presenting a mixed edema picture. MRI reveals swelling of the gray matter and loss of gray–white matter differentiation. ADC dark and DWI bright areas are present in CE/EBI; FA is decreased on DTI.4 Hypoxia caused by acute arterial infarction leads to rapid depletion of adenosine triphosphate (ATP) and resultant CE.4 Excitotoxicity causes sodium–potassium pump failure and rapid influx of water into the cell. Intracellular calcium increases causing release of lipase and protease, ultimately leading to cell death.5 Experimental studies on NMDA-type glutamate receptor antagonists (MK-801) have shown a reduced volume of ischemic injury after occlusion of the middle cerebral artery (MCA).12 Accordingly, excitotoxic injury related to glutamate is associated with the pathophysiological findings of ischemic penumbra.5,12 Within 30 minutes CE develops, often peaking between 24 and 72 hours, and can persist for up to 24 hours after reperfusion. Detection of hyperacute infarction (< 30 min from onset of neurological deficit) is most sensitive on DWI4 (▶ Fig. 2.3a–c). As the infarction evolves, the CE (DWI bright, ADC dark) will be surrounded by VE (DWI bright, ADC bright) and associated mass effect. ADC can show pseudonormalization between 10 and 15 days, with persistent DWI hyperintensity due to T2 shine-through of VE13 (▶ Fig. 2.3d–f). Chronic infarction shows ADC bright signal due to encephalomalacia and gliosis.14 Fig. 2.3 A 45-year-old man with human immunodeficiency virus and staphylococcal bacteremia with endocarditis and multiple septic emboli of various ages. (a) Diffusion weighted imaging (DWI) showing multiple watershed distribution infarctions. (b) DWI showing additional areas of infarction, including left medial and parietal cortical infarctions. (c) Apparent diffusion coefficient (ADC) shows that watershed infarctions are dark and therefore acute. (d) ADC shows that medial left parietal infarction is dark and therefore acute (arrow), whereas the lateral parietal infarction is pseudonormalized and therefore subacute (small arrow). (e) T2-weighted image with high T2 signal in the areas of watershed infarction. (f) T2-weighted image with high signal in both the medial and lateral parietal infarctions, but also showing gyral swelling in the subacute infarction laterally. Venous infarction is caused by thrombus in the dural venous sinuses, cortical veins, or deep cerebral veins. The area of infarction does not correspond to an arterial distribution and has a propensity to undergo hemorrhagic transformation. Risk factors include chronic inflammation, infection, thrombophilic states (e.g., dehydration, hypercoagulation disorders, cancer), and cranial surgery.15 CE surrounded by VE and mass effect is typically seen (▶ Fig. 2.4). CT or magnetic resonance venography can identify thrombus. Fig. 2.4 A 58-year-old man with right frontal anaplastic oligoastrocytoma status post–prior resection, radiation therapy, and recent repeat resection. (a) Diffusion weighted imaging (DWI) shows high signal along the right frontal surgical cavity indicative of devitalized tissue (arrow). (b) Apparent diffusion coefficient (ADC) map confirms reduced diffusion at the margin of the surgical cavity. (c) More superiorly and distant from the surgical cavity is a large area of high signal on DWI (arrow). (d) On ADC this area is bright, indicating T2 shine-through. (e) On T2-weighted images this was a new area of edema and local mass effect due to a cortical venous injury and venous infarction during the surgery. (f) T2-fluid-attenuated inversion recovery image also demonstrates the area of postoperative venous infarction in the right frontal lobe CE in multiple sclerosis (MS) plaques is rarely captured on MRI. As seen in the early (hyperacute and acute) phases of MS, these lesions are profoundly hypointense on ADC maps and bright on DWI5 (▶ Fig. 2.5). Fig. 2.5 A 26-year-old woman with acute demyelinating lesion from multiple sclerosis (MS). (a) Diffusion weighted image shows a peripherally bright ring lesion in the right centrum semiovale (arrow). (b) Apparent diffusion coefficient map confirms that periphery of this lesion is dark (arrow) representing reduced diffusion. (c) T2-weighted image shows a centrally hyperintense and peripherally gray matter isointense signal to the lesion (arrow). Additional other T2 hyperintense white matter lesions are noted (small arrows). (d) T2-fluid-attenuated inversion recovery image shows to better advantage the ringlike lesion (arrow) and additional lesions (small arrows). (e) T1-weighted image demonstrates gray matter isointense to slightly hyperintense signal to the periphery of the ring lesion (arrow). (f) Postcontrast T1-weighted image shows central enhancement of the lesion (arrow).
2.2 Pathophysiology
2.2.1 Vasogenic Edema
2.2.2 Cytotoxic Edema and Excitotoxic Brain Injury
Excitotoxic Brain Injury
Cytotoxic Edema
2.3 Diseases Associated With Cerebral Edema
2.3.1 Vasogenic Edema
Neoplasm-Related Vasogenic Edema

2.3.2 Cytotoxic Edema/Excitotoxic Brain Injury
Arterial Infarction
Cerebral Venous Infarction
Multiple Sclerosis
Related posts:
 Diffusion Weighted Imaging in the Evaluation of Brain Tumors
 Diffusion Weighted Imaging in Hemorrhage
 Diffusion Weighted and Diffusion Tensor Imaging in Aging
 Diffusion Weighted Imaging and Diffusion Tensor Imaging in Head and Neck Diseases
 Diffusion Weighted and Diffusion Tensor Imaging in Infectious Diseases
 Physics of Diffusion Weighted and Diffusion Tensor Imaging
Stay updated, free articles. Join our Telegram channel

Full access? Get Clinical Tree


