Congestive cardiomyopathy
Fibroelastosis of the left ventricle
Hypoplastic left heart disease
Critical aortic stenosis
Table 15.2
Obstructions of the aortic arch and isthmus which influence blood flow in the abdominal arteries
Coarctation of the aorta |
Interrupted aortic arch |
The diastolic flow within the body arteries is caused by the aortic ‘Windkessel’. All cardiovascular abnormalities with a large leakage of the aortic ‘Windkessel’ influence the diastolic amplitude (Deeg 1989). Especially in arteries with low peripheral resistance, the high diastolic amplitude of the peripheral flow is caused by the aortic ‘Windkessel’. Defects of the aortic ‘Windkessel’ cause a reduction of the diastolic forward flow and of the diastolic flow velocities (end-systolic and end-diastolic flow velocities) and an increase of the resistance index (Figs. 15.5 and 15.6).
Moderate ‘Windkessel’ leakages cause further reduction of the diastolic amplitude. Often the end-diastolic flow is missing (Figs. 15.5b and 15.6b, c).
Large defects of the aortic ‘Windkessel’ are characterised by a retrograde diastolic flow (Figs. 15.5c and 15.6d) (Deeg and Trusen 2005).
15.2 Congenital Heart Diseases with a Leakage of the Aortic ‘Windkessel’
Pathophysiologically the following congenital heart diseases are leakages of the aortic ‘Windkessel’ (Deeg 1989):
Patent ductus arteriosus Botalli
Common arterial trunk
Aortic septum defect (aortopulmonary window)
Severe aortic regurgitation
Great arteriovenous fistulas
Aorto-cameral tunnel
Aortopulmonary shunt
The most frequent leakage of the aortic ‘Windkessel’ is a patent ductus arteriosus Botalli (Table 15.3).
Table 15.3
Congenital heart disease with a leakage of the aortic ‘Windkessel’
Patent ductus arteriosus Botalli |
Common arterial trunk |
Aortic septum defect |
Aortic regurgitation (severe) |
Aorto-cameral tunnel |
Aortopulmonary shunt |
Great arteriovenous fistulas |
15.3 Patent Ductus Arteriosus (PDA)
A persistent ductus arteriosus Botalli (PDA) is a frequent problem in the neonatal period, especially in preterm-born babies. A large PDA can be seen through 2D echocardiography in the parasternal short axis view through the right ventricular outflow tract and the pulmonary artery (Fig. 15.1). The best modality for the diagnosis of a PDA with left to right shunt is colour-coded Doppler sonography of the blood flow in the main trunk of the pulmonary artery (Fig. 15.2a–d). It shows a red inflow in the region of the pulmonary bifurcation which is directed towards the anterior wall of the pulmonary artery (Fig. 15.2a–d). If the pulmonary resistance is high, blood flow in the open duct is directed away from the pulmonary artery to the descending aorta. In these cases, the open duct is displayed blue (Fig. 15.2e). A small PDA causes only a tiny flare (Fig. 15.2c, d), whereas a large PDA has a greater width and reaches the pulmonary valve (Fig. 15.2a, b).


Fig. 15.1
(a) Parasternal short axis view of an open ductus arteriosus Botalli. The picture shows a large communication (PDA) between the pulmonary trunk (PAST) and the descending aorta (DAO). AO ascending aorta, LPA left pulmonary artery, RPA right pulmonary artery. (b) Closing PDA in a newborn baby. AO ascending aorta, DAO descending aorta, PA main pulmonary artery, RPA right pulmonary artery
Fig. 15.2
(a, b) Large PDA. Colour Doppler of the flow within the pulmonary artery (PA). Left to right shunt through an open ductus (PDA) shows a large red inflow into the pulmonary trunk (PA). The normal flow is displayed blue. RV right ventricle. (c, d) Small PDA. The parasternal short axis view through the pulmonary artery shows a tiny flare at the junction of the pulmonary artery (PA) with the persistent ductus (PDA). AO ascending aorta, RV right ventricle. (e) Right to left shunt through an open ductus (PDA) in a patient with pulmonary hypertension. The flow in the ductus arteriosus is displayed blue as it is directed from the pulmonary artery to the aorta. PDA persistent ductus arteriosus, LPA left pulmonary artery, RPA right pulmonary artery
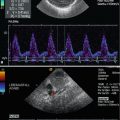
PW and CW Doppler show diastolic inflow into the pulmonary artery which is displayed above the baseline, whereas the normal pulmonary flow is displayed below the baseline (Fig. 15.3a–c). As long as the pulmonary resistance is high, pulsed Doppler shows only diastolic inflow into the pulmonary artery with low peak systolic flow velocities (Fig. 15.3a, b). When the resistance of the pulmonary artery has fallen to normal values, systolic-diastolic inflow with high flow velocities can be found (Fig. 15.4a, b). If the pulmonary vascular resistance has fallen to normal values and the PDA remains open, more and more blood is shunted away from the aorta to the pulmonary artery.


Fig. 15.3
Pulsed Doppler recording of the inflow into the pulmonary artery by an open duct in patients with high pulmonary resistance. In the colour Doppler image, the inflow is displayed red. (a–c) Pulsed Doppler recording of the flow within the ductus arteriosus. The sample volume of the pulsed Doppler device is placed within the ductus. The flow curve shows only diastolic inflow into the pulmonary artery with low flow velocities of 1 m/s (a, b) and 1.7 m/s (c) respectively. In systole no left to right shunt can be shown indicating high pulmonary vascular resistance
Fig. 15.4
Pulsed Doppler recording of the inflow into the pulmonary artery by an open duct in patients with low pulmonary resistance. (a, b) Pulsed Doppler recording of the flow within the ductus arteriosus. The sample volume of the pulsed Doppler device is placed within the ductus. The flow curve shows a systolic-diastolic flow in the pulmonary artery with high flow velocities 3 m/s (a) and 4 m/s (b) indicating low peripheral resistance in the pulmonary vascular bed and high shunt volume
In prematurely born infants of 23–28 weeks of gestation, the PDA is the main cause of respiratory deterioration at the end of the first week of life. Immediately after birth, the pulmonary arterial resistance is high. Although the PDA is open, there is no significant leakage of the aortic ‘Windkessel’: Only a small amount of blood is shunted away from the aorta to the pulmonary arterial bed (Fig. 15.2d). Blood flow in the body arteries with low peripheral resistance (brain, abdomen) is therefore normal. If the pulmonary arterial resistance falls at the end of the first week of life and the PDA stays open, the leakage of the aortic Windkessel increases and blood is shunted away to a greater extend from the aorta to the pulmonary vascular bed. This may lead to hyperperfusion of the lungs and cause pulmonary deterioration due to pulmonary oedema. The shunted blood volume is ‘stolen’ from the descending aorta. This may cause hypoperfusion of important body organs such as the brain, liver, kidneys and intestine (Bejar et al. 1982; Dykes et al. 1980; Maier 2005; Kittermann 1975; Sonntag 2005).
Flow measurements in low-resistance peripheral arteries show a reduction of the diastolic amplitude and a decrease of the end-systolic and end-diastolic flow velocities (Figs. 15.5, 15.6 and 15.7) (Perlman et al. 1981; Martin et al. 1982; Deeg et al. 1986a, b). These flow alterations can be found in all low-resistance arteries of the body such as the brain arteries, the coeliac trunk, the renal arteries and their branches (Figs. 15.5, 15.6 and 15.7) (Perlman et al. 1981; Martin et al. 1982; Deeg et al. 1986a, b).


Fig. 15.5
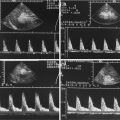
(a–c) Doppler sonographic flow measurements in the cerebral arteries in infants with open ductus. (a) Flow measurement in the internal carotid artery (sagittal section) in a small PDA: the sample volume of the pulsed Doppler device is placed in the petrosal part of the internal carotid artery. Decreased diastolic forward flow in a haemodynamically insignificant duct. (b) Flow measurement in the internal carotid artery (coronal section) in patient with a moderate PDA. The sample volume of the Doppler device is placed within the petrosal part of the internal carotid artery. The diastolic amplitude is markedly decreased with an end-diastolic flow velocity approximating zero. (c) Flow measurement in the anterior cerebral artery (sagittal section) in a large PDA: the sample volume of the pulsed Doppler device is placed in the anterior cerebral artery in front of the third ventricle. Diastolic backflow in a haemodynamically significant duct which should be closed with ibuprofen or indomethacin
Fig. 15.6
(a–d) Flow measurements in abdominal arteries in patients with an open duct. (a) Flow measurement in the coeliac trunk in a patient with a small PDA (longitudinal section through the middle upper abdomen): the flow curve shows a decreased diastolic amplitude with a decrease of the end-systolic and end-diastolic flow velocities in accordance with a small duct. (b, c) Flow measurement in the coeliac trunk in a patient with a moderate to large PDA. The sample volume is placed in the coeliac axis after its origin from the descending aorta. The flow curve shows no diastolic forward flow indicating a haemodynamically significant duct. The oscillations in (b) around the zero line are caused by high-frequency oscillating ventilation. (d) Flow measurements in the renal artery of a preterm infant with a large PDA. The sample volume is placed in the renal artery. The flow curve shows a holodiastolic backflow characteristic of a haemodynamically significant duct
Fig. 15.7
Doppler sonographic flow measurements in the anterior cerebral arteries of patients with small PDA (dotted columns) and large PDA (hatched columns) in comparison with a healthy control group of similar age and weight (empty columns). The end-systolic and end-diastolic flow velocities are moderately decreased in small PDA and markedly decreased in large PDA, whereas the resistance indices are moderately and markedly increased respectively
15.3.1 Quantification of the Haemodynamic Relevance of a PDA
Flow measurements in peripheral arteries allow a semi-quantitative judgement of the haemodynamic relevance of a PDA:
A small PDA is characterised by only slight reduction of the diastolic flow (Figs. 15.5a, b, 15.6a and 15.7) (Deeg 1989; Deeg and Trusen 2005).
A moderate PDA is characterised by a marked reduction of the diastolic amplitude. The end-diastolic flow velocities approximate zero. Often no flow at the end of diastole can be seen (Figs. 15.5b, 15.6b, c and 15.7) (Deeg 1989; Deeg and Trusen 2005).
Moderate and especially large PDAs may cause organ hypoperfusion and dysfunction.
Hypoperfusion of the brain may be associated with hypoxemic-ischaemic encephalopathy, periventricular leucomalacia and intraventricular haemorrhage (Bejar et al. 1982; Dykes et al. 1980; Martin et al. 1982; Maier 2005).
Hypoperfusion of the kidney may cause oliguria and anuria, whereas hypoperfusion of the gastrointestinal tract may be associated with an increased incidence of necrotising enterocolitis (Kittermann 1975; Deeg et al. 1986a, b; Sonntag 2005).
To judge the haemodynamic relevance of a PDA, flow measurements can be performed in the cerebral arteries or the coeliac trunk or any other abdominal artery with low peripheral resistance (Figs. 15.5 and 15.6) (Deeg et al. 1986a, b). The cerebral or abdominal arteries are equally suitable for judgement of the haemodynamic relevance (Figs. 15.5 and 15.6). For exact quantification, the end-systolic and end-diastolic flow velocities should be measured, or the resistance indices should be calculated (Figs. 15.5, 15.6 and 15.7).
The comparison of the flow velocities and resistance indices of infants with haemodynamic relevant PDA showed a significant decrease of the end-systolic, end-diastolic and time average velocities and an increase of the resistance index (Fig. 15.7) (Deeg et al. 1986a, b).
Other modalities for the judgement of the haemodynamic relevance of a PDA are:
Ad 1: In patients with a haemodynamic relevant PDA, the size of the left atrium increases due to increased left to right shunt increased pulmonary venous backflow and an increase of the shunt volume (Fig. 15.8a). The measurement of the width of the left atrium in diastole in relationship to the width of the aorta in the parasternal long axis view is one of the most popular methods for estimating the haemodynamic relevance of the PDA (Fig. 15.8b, c, d) (Skinner 2000). Once a good parasternal long axis view through the aortic valve is obtained, the M-mode curser is dropped through the aortic cusps in the left atrium (Fig. 15.8b, c, d). Due to international convention, the measurements are performed from leading edge to leading edge (from the front of the anterior wall of the aorta to the front of the posterior wall of the aorta and from the front of the posterior wall of the aorta to the front of the posterior wall of the left atrium). The maximal diameter of the left atrial is measured at the point of maximum forward motion of the aorta.

Fig. 15.8
Increased left atrium in patients with a large ductus. (a) Parasternal long axis view in a patient with open PDA. The image shows an increase left atrium (LA). AAO ascending aorta, LV left ventricle, RV right ventricle. (b–d) Quantification of the size of the left atrium by M-mode through the aortic root in the parasternal long axis view. The M-mode line is placed through the aortic valve and the left atrium. The diameter of the aortic root (AO) and the largest diameter of the left atrium are measured with the leading edge method and the LA/AO ratio is calculated. An LA/AO ratio > 1.4 indicates a large left to right shunt. (b) LA/AO = 1.77. (c) LA/AO = 1.88. (d) LA/AO = 2.72
In normal infants, the LA/AO ratio is <1.3:1. In patients with a patent PDA, the LA/AO ratio exceeds 1.4:1.
Ad 2. The most sensitive method for the diagnosis of an open duct with left to right shunt is demonstration of colour flow within the pulmonary trunk, best seen in a high parasternal short axis view through the pulmonary artery (Fig. 15.2) (Kluckow and Evans 1995). In healthy infants without a PDA, the flow in the pulmonary artery is displayed blue. In patients with an open PDA, a retrograde flow at the superior border of the pulmonary artery, which is displayed red, can be seen (Fig. 15.2a–d). Measuring the width of the internal diameter of the colour jet at its narrowest point within the pulmonary artery may be helpful (Kluckow and Evans 1995). In the opinion of Kluckow, a large PDA has a diameter of more than 1.4 mm (Kluckow and Evans 1995).
A problem of estimating the size of the PDA by colour Doppler is the dependency on machine settings such as Doppler gain, filter and map controls. If repeated investigations are done with identical settings, the diameter of the internal size of the colour jet may be judged as closed, small, moderate or large. The size of the shunt however does not only depend on the diameter of the duct but also on the resistances on both ends of the PDA. If the pulmonary artery resistance is high, the flow through a large duct may be only minimal such as immediately after birth.
Another problem is the blooming effect of colour Doppler, which means that the size in the colour image is greater than the real two-dimensional diameter. In our eyes the diameter of a vessel (here the PDA) cannot be judged by colour Doppler (blooming effect).
Another semi-quantitative method is the way the ‘flare’ travels in the pulmonary artery. A tiny shunt causes a narrow jet which does not reach the pulmonary valve (Fig. 15.2c, d). A moderate jet produces a wider shunt which may reach the pulmonary valve. A large shunt causes a very wide jet which reaches the pulmonary valve and swirls back into the artery (Fig. 15.2a, b).
In summary, the quantification of the haemodynamic relevance of a patent PDA by means of the colour inflow into the pulmonary artery is not a good method (Tables 15.4 and 15.5).
Table 15.4
Flow velocities in the anterior cerebral arteries of 24 preterm infants with small ductus arteriosus Botalli in comparison with a control group of the same age and weight
Small PDA | Control group | p | |
|---|---|---|---|
n | 24 | 24 | |
Gestational age (w) | 35 ± 3.7 | 35 ± 3.5 | n.s. |
Weight (g) | 1,960 ± 650 | 1,950 ± 660 | n.s. |
V s (cm/s) | 44 ± 11 | 37 ± 8 | n.s. |
V es (cm/s) | 14 ± 5 | 16 ± 4 | ≤0.001 |
V ed (cm/s) | 5 ± 3 | 9 ± 3 | ≤0.001 |
RI | 0.90 ± 0.04 | 0.75 ± 0.06 | ≤0.001 |
Table 15.5
Flow velocities in the anterior cerebral arteries of 32 preterm infants with large ductus arteriosus Botalli in comparison with a control group of the same age and weight
Large PDA | Control group | p | |
|---|---|---|---|
n | 32 | 32 | |
Gestational age (w) | 31.3 ± 3.1 | 31.3 ± 3.2 | n.s. |
Weight (g) | 1,280 ± 530 | 1,290 ± 520 | n.s. |
V s (cm/s) | 35 ± 9 | 28 ± 7 | ≤0.001 |
V es (cm/s) | 4 ± 3 | 13 ± 5 | ≤0.001 |
V ed (cm/s) | 3 ± 4 | 7 ± 3 | ≤0.001 |
RI | 1.07 ± 0.21 | 0.76 ± 0.07 | ≤0.001 |
Table 15.6
Flow velocities in the anterior cerebral arteries of 20 preterm infants with large PDA before and after surgical closure of the ductus
Before ligation | After ligation | p | |
|---|---|---|---|
n | 20 | 20 | |
Gestational age (w) | 31.1 ± 3.2 | 31.7 ± 3.1 | |
Weight (g) | 1,330 ± 590 | 1,390 ± 590 | |
Days after ligation | 0 | 3 ± 3 | |
V s (cm/s) | 37 ± 8 | 35 ± 10 | n.s. |
V es (cm/s) | 5 ± 9 | 13 ± 6 | ≤0.001 |
V ed (cm/s) | −3 ± 4 | 6 ± 3 | ≤0.001 |
RI | 1.02 ± 0.26 | 0.83 ± 0.06 | ≤0.001 |
Table 15.7
Flow velocities in the anterior cerebral arteries of eight infants with truncus arteriosus communis in comparison with a control group of the same age and weight
Truncus arteriosus communis | Control group | p | |
|---|---|---|---|
n | 8 | 8 | |
Gestational age (w) | 47.5 ± 14 | 46.5 ± 13 | |
Weight (g) | 3,150 ± 1,090 | 3,300 ± 1,400 | |
V s (cm/s) | 50 ± 19 | 54 ± 12 | n.s. |
V es (cm/s) | 11 ± 9 | 25 ± 10 | ≤0.001 |
V ed (cm/s) | 2 ± 10 | 14 ± 8 | ≤0.001 |
Table 15.8
Flow velocities in the anterior cerebral arteries of seven infants with aortopulmonary shunt in comparison with a control group of the same age and weight
Aortopulmonary shunt | Control group | p | |
|---|---|---|---|
n | 7 | 7 | |
Gestational age (w) | 53.5 ± 16.5 | 51 ± 17 | |
Weight (g) | 4,710 ± 2,030 | 4,710 ± 2,100 | |
V s (cm/s) | 72 ± 23 | 59 ± 5 | ≤0.05 |
V es (cm/s) | 21 ± 12 | 30 ± 8 | ≤0.01 |
V ed (cm/s) | 4 ± 5 | 18 ± 8 | ≤0.001 |
RI | 0.97 ± 0.06 | 0.73 ± 0.08 | ≤0.001 |
Table 15.9
Flow velocities in the anterior cerebral arteries of 12 infants with hypoplastic left heart syndrome (HLHS) and critical aortic stenosis (AS) in comparison with a control group of the same age and weight
HLHS and critical AS | Control group | p | |
|---|---|---|---|
n | 12 | 12 | |
Gestational age (w) | 41 ± 2 | 40.5 ± 1.5 | |
Weight (g) | 2,940 ± 340 | 2,940 ± 340 | |
V s (cm/s) | 26 ± 6 | 47 ± 11 | ≤0.001 |
V es (cm/s) | 13 ± 10 | 22 ± 6 | ≤0.01 |
V ed (cm/s) | 7 ± 3 | 12 ± 4 | ≤0.05 |
RI | 0.68 ± 0.14 | 0.74 ± 0.08 | n.s. |
AFT (s) | 0.32 ± 0.10 | 0.19 ± 0.04 | ≤0.001 |
AT (s) | 0.15 ± 0.06 | 0.07 ± 0.02 | ≤0.001 |
DT (s) | 0.17 ± 0.10 | 0.12 ± 0.03 | ≤0.05 |
AS (kHz/s) | 13 ± 9 | 55 ± 16 | ≤0.001 |
DS (kHz/s) | 9 ± 6 | 31 ± 21 | ≤0.01 |
15.3.2 Indications for Treatment of a Haemodynamically Relevant PDA
Moderate or large PDAs should be treated with indomethacin or ibuprofen. In cases of contraindications for closure with drugs, surgical ligation is necessary. Flow measurements in peripheral arteries are especially helpful for the estimation of the haemodynamic relevance of a patent duct with left to right shunt and for further controls. As long as the diastolic forward flow in low-resistance peripheral arteries is high, the haemodynamic relevance of a patent duct is not relevant; the left to right shunt is minimal. With decrease of the pulmonary vascular resistance, the left to right shunt increases which causes a decrease of the diastolic amplitude in peripheral vessels.
After surgical closure of the PDA, a significant increase of the diastolic flow velocities and a decrease of the resistance index can be seen in all low-resistance arteries (Figs. 15.9 and 15.10) (Table 15.6). The normalisation of the abdominal perfusion causes improvement of renal function and urine production as well as improvement of digestion.


Fig. 15.9
Graphic illustration of the flow velocities in the anterior cerebral artery of 19 patients with a large PDA before (left) and after (right) surgical ligation. The picture shows that in all patients the end-diastolic flow velocity (V ed) increased and the resistance index (RI) decreased. Vs peak systolic flow velocity, V es end-diastolic flow velocity, V ed end-diastolic flow velocity
Fig. 15.10
Doppler sonographic flow measurements in the anterior cerebral arteries of 18 patients with a large PDA before (hatched columns) and after (empty columns) ligation of the PDA. The figure shows, that the end-systolic and end-diastolic flow velocities increase after surgical ligation of the PDA and the resistance index falls to normal values
Nowadays an open PDA of preterm infants is medically closed by ibuprofen. Sonographic controls should include flow measurements by colour-coded Doppler sonography in the pulmonary artery and within a peripheral artery, such as the anterior cerebral artery or the coeliac trunk. Colour Doppler of the flow within the pulmonary artery will demonstrate if the PDA is still open, whereas flow measurements in the peripheral arteries demonstrate the haemodynamic relevance of a still-existing leakage of the aortic Windkessel.
15.4 Common Arterial Trunk (TAC)
A common arterial trunk is a congenital cardiac malformation where only one single artery originates from the heart that gives rise to the coronary arteries, the pulmonary arteries and the brachiocephalic arteries (Fig. 15.11).


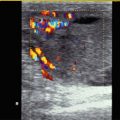
Fig. 15.11
(a) Pathologic anatomic specimen of a patient with truncus arteriosus communis. The picture shows a large malalignment ventricular septal defect (VSD) with only one vessel, the truncus arteriosus riding over the ventricular septal defect (VSD). The truncus arteriosus gives origin to the pulmonary arteries (PA) and the ascending aorta (AO). Arrows truncal valve. (b, c) Parasternal long axis view through the ascending aorta. The image shows that only one artery (the common arterial trunk TAC) originates from the heart which gives origin to the pulmonary artery (PA) and the aorta (AAO). AOB aortic arch, DAO descending aorta, LA left atrium. (d) Parasternal short axis view through the origin of both pulmonary arteries from the common arterial trunk (TAC). LPA left pulmonary artery, RPA right pulmonary artery. (e) Pulsed Doppler sonographic flow measurement in the aortic arch in a patient with common arterial trunk. Colour Doppler shows a retrograde flow displayed red. Pulsed Doppler shows retrograde diastolic flow displayed over the zero line
Echocardiographic diagnosis in TAC shows a malalignment ventricular septum defect with an overriding systemic vessel (Fig. 15.11b, c). In contrast to Fallot tetralogy, no pulmonary artery originates from the right ventricle. Careful examination of the ascending aorta and the aortic arch reveals one or two pulmonary arteries which arise from the ascending aorta (Fig. 15.11a–d).
Pathophysiologically TAC is also a large leakage of the aortal ‘Windkessel’. Immediately after birth, the pulmonary vascular resistance is high. Flow measurements in peripheral arteries in the first days of life may show normal flow profiles and flow velocities (Deeg 1989). Thus far the pulmonary vascular resistance falls, the leakage of the aortic ‘Windkessel’ increases, and blood is shunted away from the systemic circulation to the pulmonary vascular bed (Fig. 15.11e). Flow measurements in the aortic arch and the descending aorta show diastolic backflow which is displayed red with colour Doppler (Fig. 15.11e). This causes a marked decrease of diastolic flow in all arteries of the body (Figs. 15.12 and 15.13) (Table 15.7) (Deeg 1989). Typically a diastolic backflow can be found in all low-resistance arteries (Fig. 15.13a, b). The leakage of the aortic ‘Windkessel’ may be aggravated if regurgitation of a malformed truncus valve is associated.


Fig. 15.12
(a) Doppler sonographic flow measurement in the coeliac axis of a patient with common arterial trunk with an age of 1 day. Significant reduction of the diastolic amplitude, although the pulmonary arterial resistance is still high. (b) Doppler sonographic flow measurement in the superior mesenteric artery of the same patient at day 3. The diastolic forward flow has disappeared and a retrograde diastolic flow causes hypoperfusion of the gut with following necrotising enterocolitis
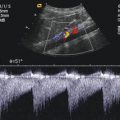
Fig. 15.13
(a) Doppler sonographic flow measurement in the renal artery of a patient with common arterial trunk at day 3. Systolic forward and holo-diastolic backflow caused by a large leakage of the aortic Windkessel. The kidney showed insufficient perfusion and the infant was anuric. (b) Doppler sonographic flow measurement in the internal carotid artery of a patient with common arterial trunk at day 3. Diastolic backflow caused by the large leakage of the aortic Windkessel
If surgery cannot be performed in the neonatal period, pulmonary hypertension will rapidly develop. Repeated Doppler sonographic controls in low-resistance arteries show an increase of the diastolic flow amplitude and flow velocities and apparently a ‘normalisation’ of the flow profile and flow velocities (Fig. 15.14) (Deeg 1989). This is however a bad sign, as irreversible alterations of the pulmonary vascular bed (Eisenmenger reaction) may soon develop.

Fig. 15.14
Alteration of the flow velocities in the anterior cerebral arteries of a patient with common arterial trunk with increasing age. With the decrease of the pulmonary vascular resistance during the first weeks of life, the end-diastolic flow velocity decreased. With increasing vascular resistance in the pulmonary vascular tree, the end-diastolic flow velocity ‘normalised’. This is a strong hint of the development of irreversible alterations of the pulmonary arterioles and capillaries and persistent pulmonary hypertension. Vs peak systolic, Ves endsystolic, Ved enddiastolic flow velocity
To distinguish fixed pulmonary hypertension from flow-dependent pulmonary hypertension, flow measurements should be performed with 21 % oxygen and 100 % oxygen (Deeg 1989). Flow-dependent pulmonary hypertension causes a decrease of the diastolic amplitude in peripheral arteries if 100 % oxygen is inhaled (Fig. 15.15); 100 % oxygen reduces pulmonary resistance and increases blood flow through the pulmonary vascular bed. This increases the leakage of the aortic ‘Windkessel’.

Fig. 15.15


Flow measurement in the anterior cerebral arteries of a patient with common arterial trunk and high pulmonary vascular resistance. Breathing normal air of 21 % O2, the end-systolic (V es) and end-diastolic (V ed) flow velocities were normal as there was no significant leakage of the aortic Windkessel. The invasively measured Rp/Rs ratio was elevated with 0.46:1. With 100 % O2 the diastolic flow velocities (V es and V ed) decreased. The invasively measured Rp/Rs ratio fell to normal levels of 0.18:1. This was a strong hint that the pulmonary vascular bed still responded to oxygen and that no fixed pulmonary resistance existed. Surgical correction was done without delay
Related posts:

Stay updated, free articles. Join our Telegram channel
Full access? Get Clinical Tree
