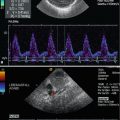
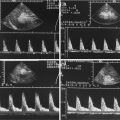
Fig. 6.1
Bidirectional power Doppler. Tortuous course of a recanalised umbilical vein. Different flow directions are marked in blue and red colours, but not as consistently clear as in colour Doppler sonography (CDS). Longitudinal section (Courtesy of GE Healthcare)
Pulsed wave DS (PW–DS)-based spectral analysis is mandatory for documentation and analysis of flow patterns and velocities. Reliable flow velocity measurements demand a reasonable Doppler angle (<60°). All measurements taken at angles >20° need angle correction. The sample volume should exceed 50 % of the vessel diameter. The Doppler signals can be evaluated visually as well as acoustically.
An additional new technique for visualising blood flow is the B–flow (b = brightness). It is not a Doppler-based method but estimates temporal position changes of blood particles applying a subtraction technique during greyscale US. The brightness depends on the density and the velocity of the moving blood particles. It may provide angiography-like images with a high spatial and temporal resolution (Fig. 6.2). B-flow enables real-time imaging of areas with simultaneously low and high flow like in arteriovenous haemodialysis shunts or aneurysms. It may be useful for vessels close to the surface and investigations in small or slim patients; thus usually linear transducers are used. The method has intrinsic limitations in deeper regions. Like in the power Doppler mode, there is no angle dependency and a good depiction of slow flow, demonstrating not only direction but mostly flow volume. The benefit of B-flow compared to the power Doppler is less risk of motion or flash artefacts and display of flow direction, and furthermore B-flow applies far lower sound energies.
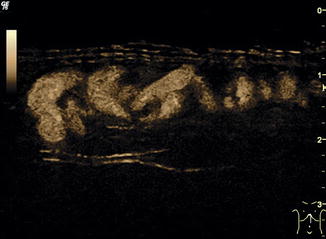
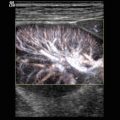
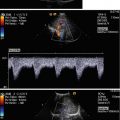
Fig. 6.2
B-flow image. Tortuous course of a recanalised umbilical vein. Longitudinal section (Courtesy of GE Healthcare)
6.2.2 Measurements and Indices
The basic DS assessment includes standard Doppler criteria and measurements such as peak systolic velocity (V s, cm/s), end–diastolic velocity (V ed, cm/s), time average velocity (TAV, cm/s) and resistive index (RI, synonym: resistance index, Pourcelot index). RI is calculated using the equation RI = (V s − V ed): V s and is thus independent of the Doppler angle.
For reproducible and reliable measurements, at least three comparable cardiac cycles should be assessed and measured and thereafter given as mean by the US device or measured in a single but reliable cardiac cycle. The Doppler angle has to be optimised <60° by altering the transducer position and beam-steering of the colour box. If the angle of incidence is greater than 60°, no quantification of the flow should be performed. With an angle of 90°, no or only a minimal Doppler signal will be visualised. This often leads to misinterpretations (e.g. dilated bile ducts instead of portal vein branches) by unexperienced investigators.
The pulsatility index (PI or Gosling index): PI = (V s − V ed): TAMX (time average maximal velocity) is rarely used for liver DS.
The congestion index (CI) (flow volume measurements, F Vol) is the ratio of the portal vein cross-sectional area A (cm2) to the mean portal vein flow velocity TAV (cm/s):
A can be calculated from the diameter according the following equation: A = (d/2)2 × π.
The congestion index (CI) can be obtained using the vessel diameter d (mm) and the time average velocity (TAV) (cm/s).
This index considers two signs of portal hypertension: the portal vein dilatation and the decrease of the flow velocity. The CI measures normally <0.075. In adults, a value above 0.1 indicates the presence of portal hypertension with a 95 % sensitivity and specificity (Haas et al. 1999).
Volume measurements in the portal vein can be done using the following equation: Vol-flow = A × TAV × 60 mf/min. Vol-flow measurements very much depend on an exact measurement of the cross-sectional area A and the time average velocity (TAV). The estimation of the cross-sectional area A affords the correct estimation of the transverse measurement of the vessel’s diameter. Errors in measuring this dia-meter severely impact flow volumes, as they affect the respective equation by the square – this can be very cumbersome with respect to the small diameters of the vessels in neonates, infants and young children. Thus vessel diameters should be measured in a true orthogonal plane to the longitudinal vessel axis using the magnification tool of the US device to zoom the vessel on greyscale US. As mentioned previously, the vessel diameter should not be measured with CDS. Blurring will artificially increase the vessel diameter and thus measurements will be incorrect (Fig. 6.3)! Due to these restrictions and challenges, volume measurements should not be used in routine praxis, particularly not in infants and small children.
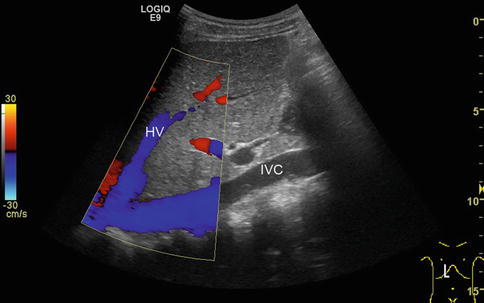
Fig. 6.3
Blooming artefacts. Longitudinal section through the inferior vena cava (IVC) with inflow of the left hepatic vein (HV). Within the colour Doppler box, the vessel diameter artificially increases due to blooming artefacts and results in incorrect measurements, if vessel diameters are taken here. Vessel diameters should always be measured in B-mode images
6.2.3 Important Parameters to Be Adjusted
The colour Doppler gain should initially be increased until blooming artefacts appear. Afterwards the gain should be diminished until the colour signal fills the complete vessel without passing the vessel walls. If adjusted too high, blooming and mirroring artefacts may occur. Alterations of the vessel wall or adherent an- or hypoechoic thrombi may be overlooked. If the colour Doppler gain is adjusted too low, a suboptimal colour sensitivity results.
The scale has to be adjusted lower for veins than for arteries.
The wall filter may eliminate low-frequency artefacts from movements and pulsations of the vessel wall. For abdominal investigations, wall filters of 100–200 Hz are recommended; for low venous flows, less than 50 Hz may be required. Too high wall filter settings may obscure low flow velocities.
The pulse repetition frequency (PRF, synonyms: pulse repetition rate, velocity range, scale) should be oriented to the expected frequency (dependent on the flow velocity) and adjusted during the investigation. If chosen too high in CDS, low-flow movements will not or incompletely be detected; if chosen too low, the direction of flow will no longer be correctly displayed due to aliasing.
Aliasing in the PW-DS spectrum is characterised by cut tops of the spectral curves, which are wrapped around and depicted under the baseline; in CDS aliasing is seen by mirrored colours of the opposite spectrum.
The baseline adjustment in PW-DS should be optimised in the measurement field so that about three quarters will be occupied.
6.2.4 Practical Considerations
There are some general considerations for performing liver DS in infants and children:
Generally, patients are examined in supine position. Sedation – e.g. in infants or psychomotorically retarded patients – is rarely required. The parents should be present and help calming the children; warmed US gel should be used.
Consider the impact of food intake on greyscale US and DS.
Always start investigating the liver with greyscale US before using DS.
In neonates and patients with portal hypertension, potential relicts of the physiological foetal circulation should be assessed (Table 6.1).
Table 6.1
Residuals of the foetal circulation
Foetal circulation
Postnatal anatomic remnants
Aa. umbilicales
Ligg. umbilicales mediales
V. umbilicalis
Lig. teres hepatis (in the falciform ligament)
Ductus venosus Arantii
Ligamentum venosum
All liver vessels, the inferior vena cava (IVC), the confluence of the portal vein and the splenic vessels should be investigated in a standardised manner.
Transducers: for greyscale imaging and for most of the DS measurements, curved-array transducers should be used; in neonates an appropriate linear or sector transducer can also be useful. The frequency of the probe used depends on the US wave penetration and therefore on age, stature and body composition of the patient.
At the end of the investigation, the liver surface, superficial pathologies and – if indicated – peripheral liver perfusion should be investigated with a high-frequency linear transducer.
Respiratory motions can hardly be avoided in small children. Using a larger sample volume and positioning the gate at a site, where respiratory changes occur within the range of the gate, are recommended.
Changes of liver flow patterns and measurements/Doppler indices due to anaemia, cardiac malformations, ventilation therapy and other systemic factors have to be considered and taken into account when interpreting DS.
Venous flow patterns are influenced by the intrathoracic pressure, and thus in a crying child or during breath-hold, these patterns may artificially be altered (Fig. 6.4).
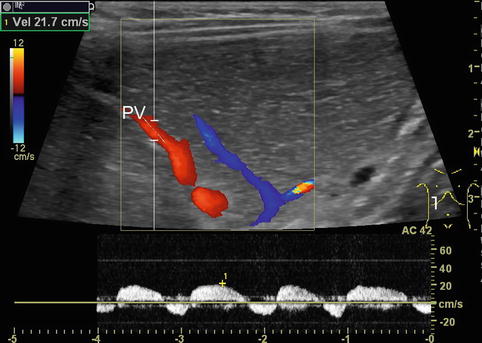
Fig. 6.4
Portal venous flow changes due to forced breathing. Pulsed Doppler: infant after extubation following liver transplantation with increased respiratory effort. Pathological portal venous pattern in a smaller branch (PV) with end-inspiratory reverse flow. Intercostal oblique section
Flow velocities, flow volumes and flow resistance depend on many factors: the nutritional status (fasted or not), the posture, previous exercise, the systemic circulation (e.g. heart rate, circulating blood volume, blood pressure, peripheral resistance, anaemia, fever, heart malformation), the intrathoracic pressure (ventilation, crying, lung or heart disease) as well as altered systemic circulation (e.g. in patients on ECMO or heart assist, Fig. 6.5a, b). Furthermore, any condition of the supplying vessels (e.g. mid-aortic syndrome, aortic coarctation, coeliac trunk stenosis) affects flow patterns, direction and measurements and, naturally, liver pathology (e.g. cirrhosis, portal hypertension, liver lesions with shunt flow, amount of collateral circulation) will influence Doppler findings. Flow profiles additionally depend on the elasticity of the vessel wall and the surrounding tissue. Additionally, findings may be altered due to a curved course or branching of the vessels.
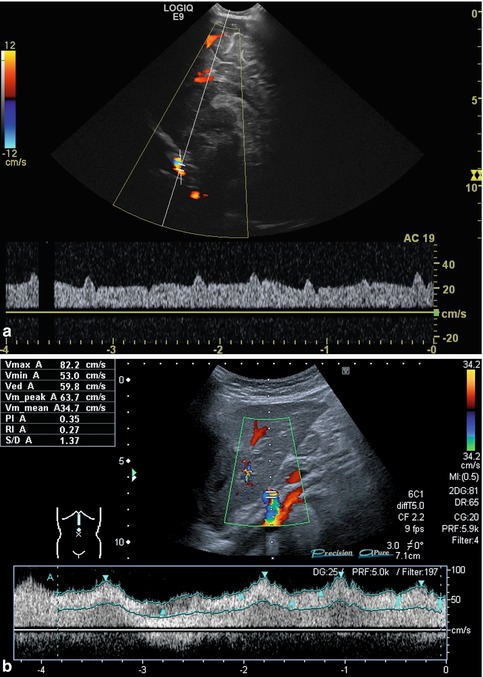
Fig. 6.5
(a, b) Atypical arterial flow patterns (pulsed wave Doppler): (a) Atypical flow in the internal carotid artery of an infant on extracorporeal membrane oxygenation (ECMO). Broad, nearly band-like flow spectrum with only minimal pulsatile elements. Sagittal section. (b) Atypical flow in the coeliac trunk in a child with cardiomyopathy and heart assist: low flow velocity, broadened systolic complexes and low RIs. Increased acceleration and deceleration time and decreased acceleration and deceleration slope. Longitudinal section
Due to the law of Hagen-Poiseuille, alterations of the flow velocity will be induced by alteration of the vessel diameter such as in vessel stenosis, the length of the altered vessel section, the flow volume within a given time, the viscosity and the pressure gradient in the investigated vessel section.
The highest flow velocity is found in the centre of the vessel. When entering a vessel section with a lower diameter, the increase of flow velocity needs a certain time (“inlet effect”), and the same accounts for the decrease of flow velocity when entering a region with a higher vessel diameter (“outlet effect”). These physical aspects have to be taken in account, when investigating a patient.
In regions directly distal to a relevant stenosis, a turbulent flow (Fig. 6.6) or even a flow reversal with a simultaneously blue-and-red coding can be observed on CDS (Fig. 6.7). This may lead to poststenotic dilatation of the vessels due to shear forces (Fig. 6.8).
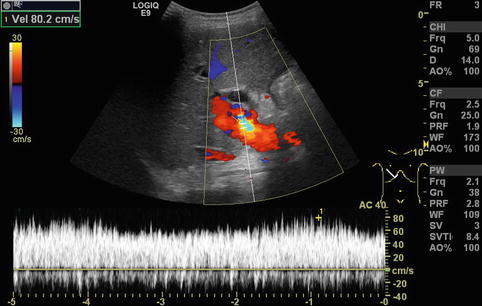
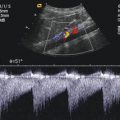
Fig. 6.6
Turbulent flow in the portal vein postoperatively after full-size liver transplantation. Aliasing in colour Doppler sonography (CDS) with a yellow-and-light blue coding due to an increased flow velocity (80 cm/s) and antegrade and negative flow in the CDS sonogram can be shown. In the pulsed wave duplex sonogram (PW-DS), a turbulent, spikelike pattern in the portal vein is found. Additional finding: dilated common bile duct. Oblique intercostal section through the liver hilus
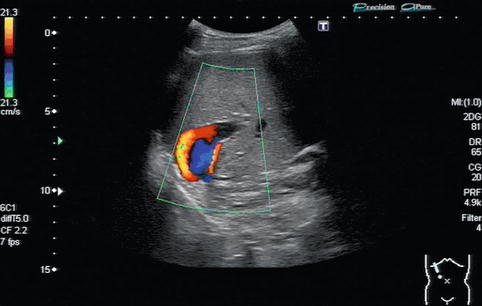
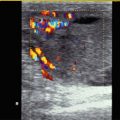
Fig. 6.7
Flow reversal with a simultaneously blue-and-red colour coding in the portal vein. The red-and-blue colour coding in colour Doppler sonography (CDS) is due to a “looping flow” distally to a portal vein stenosis in the anastomotic area after liver transplantation. Oblique intercostal section through the liver
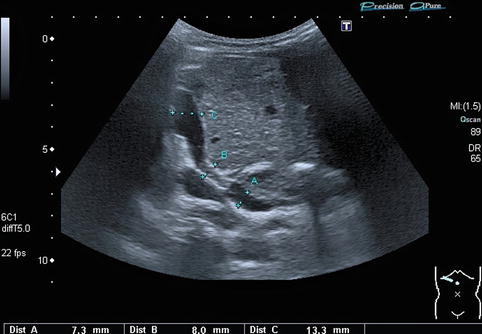
Fig. 6.8
Portal vein stenosis after transplantation of a left lateral split-liver graft. Extra- and intrahepatic course of the portal vein in an infant with a stent in the portal vein located at the stenotic anastomosis dilatation. The stent is positioned at measurement “B”. The extrahepatic portal vein (recipient’s vessel) is located at measurement “A”: poststenotic dilatation of the intrahepatic portal vein (donor’s vessel) at measurement “C”. Oblique section through the liver
The flow in arteries shows acceleration and deceleration phases. In the HA, there is normally a low resistive flow in order to enable a permanent hepatic perfusion. In case of thrombosis, the flow may change to a high resistive flow in the section proximal to the block with a low or missing diastolic flow like in non-visceral arteries supplying the extremities (Fig. 6.9). In cases with stenosis or stricture of the hepatic artery, a tardus-parvus arterial blood flow distal of the stenosis can be observed (Fig. 6.10a, b). If other (parenchymal) conditions cause peripherally increased resistance, a similarly high resistance flow pattern may be seen. Therefore, indirect signs of the peripheral resistance like the systolic acceleration and deceleration time with respective indices, shape and duration of the antegrade flow curve and possibly reversed flow even within a single cardiac complex may be observed.
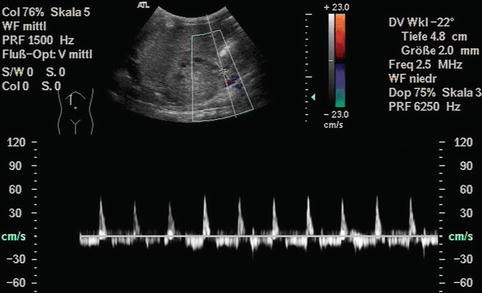
Fig. 6.9
Hepatic artery occlusion immediately after liver transplantation. Infant with syndromatic biliary atresia, butterfly liver, polysplenia and heterotaxy syndrome. The PW-Doppler is positioned in the area before the occlusion: stop flow with very short systolic forward flow and reverse diastolic flow in the hepatic artery (biphasic flow). Oblique section
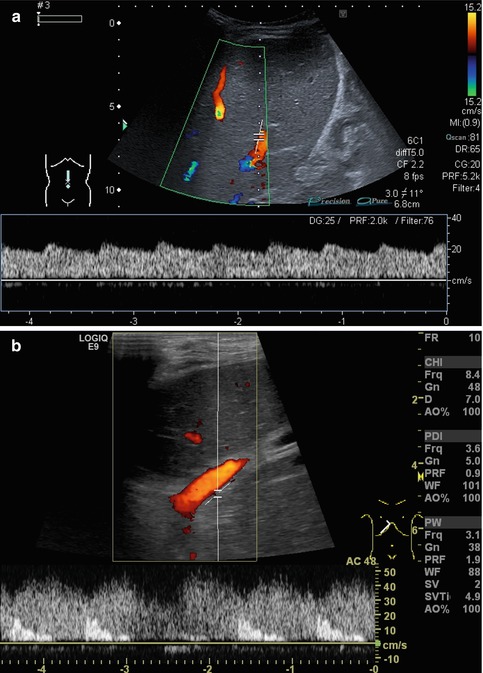
Fig. 6.10
(a, b) Impaired arterial blood flow. (a) Tardus-parvus pattern in an intrahepatic hepatic artery distally of a stenosis. Low flow velocities, high diastolic and low flow systolic amplitude. Longitudinal section. (b) Impaired arterial blood flow; the gate is beneath the portal vein as no arterial signal can be visualised with CDS. Contrary to the hepatic artery, the adjacent portal vein can clearly be visualised in CDS and has a much higher flow velocity than the impaired hepatic artery in PW-DS. Oblique section through a split-liver transplant
All these aspects have to be considered when eventually reading the DS findings of the liver; it may be beneficial or even mandatory to assess additional vessels from other organs for comparison or further pathology (e.g. renal or cerebral vessels, coeliac trunk, superior mesenteric artery/vein and splenic vessels) (Figs. 6.11, 6.12a–c and 6.13). This improves differentiation of a systemic condition from a disease of the liver or of the splenoportal circulation.
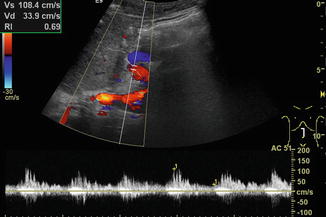
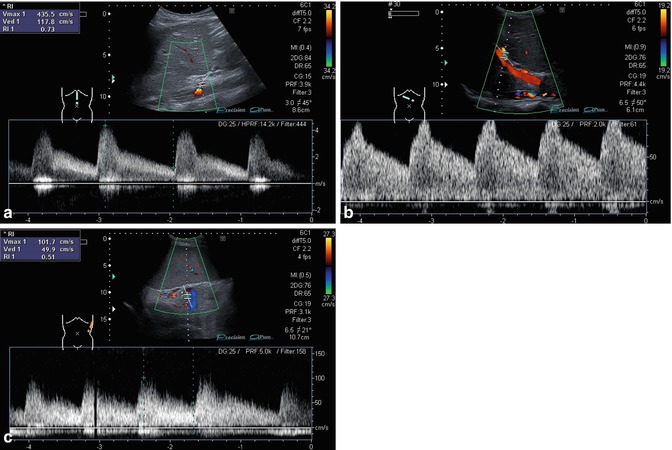
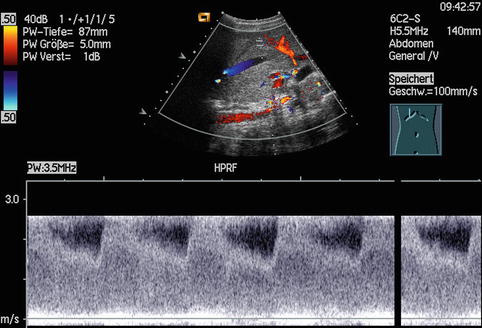
Fig. 6.11
Turbulent flow in the extrahepatic hepatic artery, which derives directly from an aortic Gore-Tex graft. Grafting was necessary after aortic rupture due to invasive candidiasis after liver transplantation. Longitudinal section through the upper abdomen
Fig. 6.12
(a–c) Adolescent with stenosis of the coeliac trunk and recurrent abdominal pain. (a) Increased systolic and diastolic flow velocities in the coeliac trunk (normal upper limit 1.5 m/s). Longitudinal section through the upper abdomen. (b) Same patient. Increased poststenotic diastolic flow velocity in the hepatic artery at the hilar region. Oblique right intercostal section. (c) Turbulent flow in the splenic artery. Adolescent with stenosis of the coeliac trunk. Spikelike pattern, high diastolic flow velocity and therefore low RI. Left lateral section
Fig. 6.13
Increased flow in the coeliac trunk in a patient with hepatoblastoma. The high flow velocities exceed the measuring range of 2.5 m/s although a high pulse repetition frequency mode was chosen. Longitudinal section through the upper abdomen (Courtesy of Prof. K.H. Deeg, Bamberg)
6.3 Normal Findings
6.3.1 Basic Considerations
A proper greyscale B-mode image of the respective vessel is essential. For PW-DS measurements, switching to and fro the 2D image to CDS (duplex mode = simultaneous greyscale and CDS) is helpful in improving angle correction and for exact positioning of the gate inside the vessel. At present, the triplex mode (simultaneous greyscale imaging, CDS and PW-DS) is mostly too slow to be practicable or of additional help. In most instances, it degrades the quality of the Doppler spectrum. Technical evolution may in future overcome this restriction. In situations difficult to survey, e.g. with multiple vessels in a close location, artefacts due to heart beating or vessels with slow flow close to vessels with fast flow, using PW-DS without switching to CDS is sometimes preferable. On CDS and particularly power Doppler, vessels tend to become blurred (Fig. 6.3) so that these images cannot be used for the measurement of the vessel diameters, e.g. for F Vol calculations or measurement of stenosis diameter. As mentioned previously, vessel diameters should only be measured in the greyscale US.
Possible anatomic variations such as an accessory HA should be ruled out. A dedicated effort to visualise the coeliac trunk, the splenoportal confluence, the superior mesenteric vein and artery as well as the inferior vena cava (IVC) should be undertaken. The investigation of the main splenic vein is mandatory in all conditions with suspicion of flow alterations. The entire vascular anatomy and the respective flow patterns of all supplying liver vessels should always be visualised and analysed.
6.3.2 Liver Anatomy and Segment Classification According to Couinaud
The liver anatomy can be described and subdivided in two different manners: morphological (classical anatomic description) or functional (angiographic and surgical approach). The classical morphological anatomy is based on the external appearance of the liver and does not take the internal vessel and biliary duct branching into account, which is obviously essential for a surgical procedure such as hemihepatectomy (Fig. 6.14a, b).
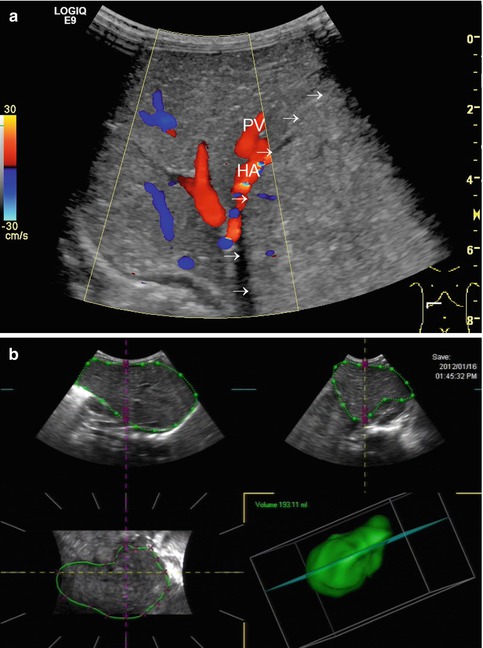
Fig. 6.14
(a, b) Hepatoblastoma in segments I, II, III and IV. (a) The tumour borders of the roundish solitary hepatoblastoma (arrows) with increased echogenicity are located directly left from the compressed portal vein (PV) and hepatic artery (HA). Transverse subcostal section. (b) 3-dimensional volumetry suggests sufficient liver volume of the unaffected liver segments V–VIII in order to avoid a “small-for-size” situation after hemihepatectomy
The anatomic division of the liver into two lobes is along the falciform ligament, which runs along the diaphragmatic liver surface. It divides the anatomic left lobe (segment II and III) and the anatomic right lobe (segments I, IV–VIII).
The anatomic approach described differs enormously from the functional classification according to the classification of Couinaud (Fig. 6.15), where only the segments V–VIII belong to the right lobe. The left lobe is fed by the left PV and includes the segments I–IV. In the Couinaud classification, the liver is divided into eight functionally independent segments, each with an own vascular inflow and outflow as well as an own biliary drainage. Each segment can be resected without damaging the remaining segments. The resection lines parallel the course of the liver vein (LV), preserving the centrally located branches of the PV, HA and bile ducts. The segmental classification according to Couinaud therefore is more useful for surgical procedures, which are orientated on the vascular supply and therefore preferred in the clinical setting. Therefore, DS descriptions should preferably be based on this functional classification. The main PV stem branching into a right and left intrahepatic branch divides the liver into lower and upper segments; thereafter, the main right and left PV stems branch superiorly and inferiorly into the centre of each segment (Fig. 6.15). The middle LV divides the functional right from the left liver lobe. This imaginary plane is passing through the gallbladder anteriorly and the IVC posteriorly and is named the Cantlie line. The left LV is positioned between the segments II/III and IVa + b and divides the left lobe into a medial and a lateral part. The middle LV runs between segments IVa + b and V/VIII and divides the liver into the right and left functional lobe. The right LV runs between segments V/VIII and VI/VII and divides the right lobe into anterior and posterior segments. The classification of Couinaud from 1957 is predominately used in Europe and Asia, whereas the similar Bismuth’s classification is popular in the United States (Smithuis, Radiology Assistant). The differences between these two classifications are mainly that Couinaud divided the liver into eight and Bismuth into four sectors: right lateral (segments VI and VII), right paramedian (segments V and VIII), left paramedian (segments III and IV) and left lateral liver sector (segment II).
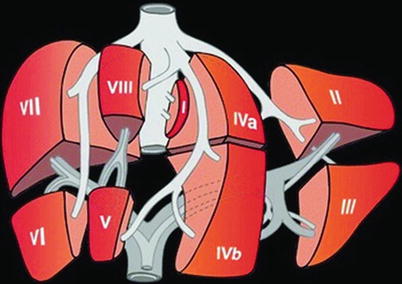
Fig. 6.15
Liver segments according to the classification of Couinaud. Couinaud’s anatomy of the liver and division of liver segments (Kinkhabwala and Vivanco 2012)
6.3.3 Portal Vein
The PV is responsible for approximately three quarters of the liver perfusion and supplies about 50–60 % of the liver’s oxygen requirements under normal circumstances. Especially the hepatic sinusoids are supplied by portal venous branches, whereas the bile ducts and the connective tissue of the portal triads are predominantly perfused by the HA. Due to the dual blood supply, the native liver is quite resistant to ischaemia and collaterals may develop rapidly. In case of HA stenosis or thrombosis, the PV flow increases and usually preserves normal liver function in a native liver (Killi 1999; Hoyer 2005).
On greyscale US, the main PV stem can be seen in an upper abdominal oblique to transverse cross section in the midline. A right lateral intercostal access is also suitable, especially if the main PV is obscured by gas on the median approach (Fig. 6.16). For visualising the PV branching in the main right and left branch, a section tilted cranially and rotated anticlockwise for approximately 90° is useful. The PV is normally much larger than the HA, and there is no significant tapering of the PV diameter when entering the liver. There may be a dilatation of the left PV branch, the sinus venosus (synonyms: venous recess, recessus Rex or umbilico-portal confluence), a physiological remnant of the umbilical venous drainage, which can be of interest when a surgical mesenterico–portal Rex shunt is necessary in children with PV thrombosis and absent liver cirrhosis for bypassing the superior mesenteric vein to the umbilical portion of the left intrahepatic PV (Stenger et al. 1999) (Fig. 6.17a). Another indication for evaluating the venous recess is possible thrombosis after umbilical vein catheterisation in neonatal intensive care patients (Fig. 6.17b, c).
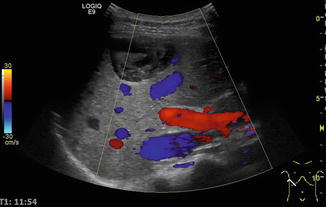
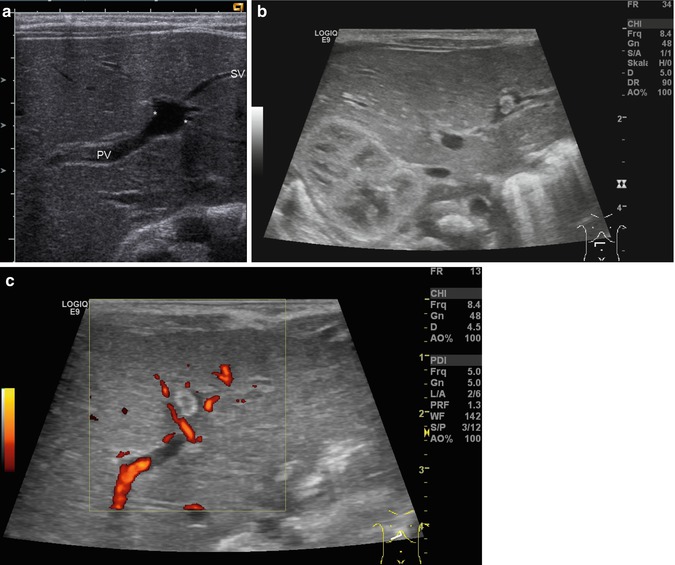
Fig. 6.16
Standard access for visualising and measuring the portal vein (PV), hepatic artery (HA) and the common bile duct. Main portal stem (red), hepatic artery above the portal vein (red), inferior caval vein (IVC) below the portal vein (blue). Additional finding: Echinococcus cyst in segment VIII/IV close to the liver surface. Below the cyst is a branch of the middle hepatic vein. Oblique intercostal section through the hilus of the liver. HV hepatic vein
Fig. 6.17
(a–c) Sinus venosus (synonyms: venous recess, recessus Rex, umbilico-portal confluence), a physiological remnant of the umbilical venous drainage in the left portal venous branch. (a) The venous recess is located at the slight dilatation of the left portal venous branch at the inflow of the former umbilical vein. Cross section through the main portal venous branching inside the liver. (b) B-mode image. Hyperechoic thrombus in the venous recess after umbilical vein catheterisation in a preterm newborn. (c) Colour Doppler image. Hyperechoic thrombus in the venous recess. Cross section through the liver
In the foetal circulation (Fig. 6.18), the oxygenated blood from the placenta comes through the umbilical vein, which gives a branch to the PV and continues afterwards as venous duct of Arantii to the ICV. As a remnant of the foetal circulation, the former umbilical vein degenerates under normal circumstances into the ligamentum teres hepatis, which runs in the free rim of the falciform ligament from the venous recess of the liver to the umbilicus (Table 6.1). The former venous duct (Arantii) can be visualised as venous ligament from the left PV branch to the IVC. It may be seen open in neonatology (Vade et al. 2001) and regain patency in cases of portal hypertension and portosystemic shunting (Fig. 6.19a–c). Both ligaments may persist with a patent lumen and some shunt flow until a maximum of four weeks postnatally (Fig. 6.19). If they stay open more longer or even show high (shunt) flow (Fig. 6.19d, e), an underlying pathological liver condition must be considered.
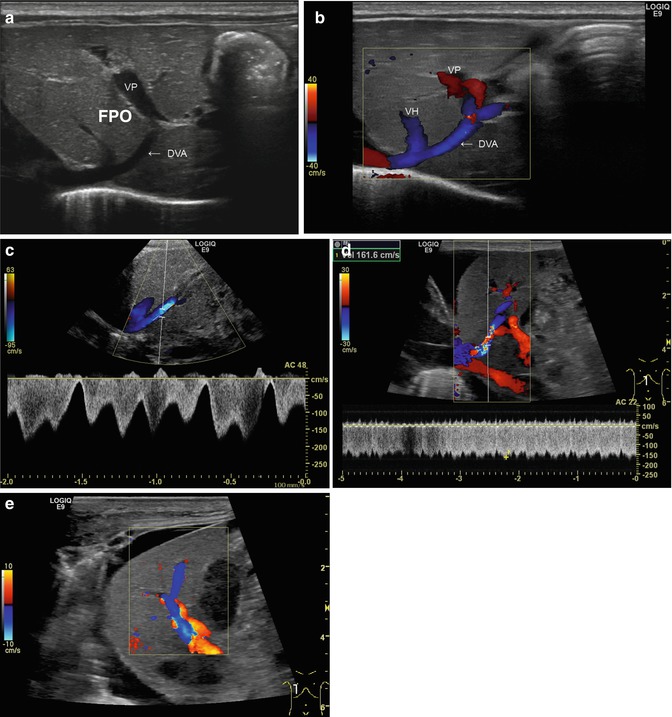
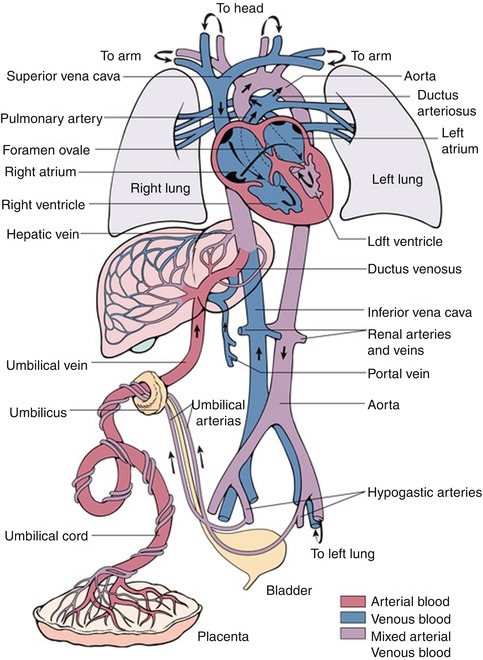
Fig. 6.19
(a–e) Patent venous duct of Arantii (a) Midline longitudinal section through the upper abdomen in a preterm infant. The duct of Arantii is marked with “DVA”, the portal venous branch with “VP”. A branch of a hepatic vein runs into the duct of Arantii, which is leading into the right atrium (Courtesy of Prof. K.H. Deeg, Bamberg). (b) Same image with CDS. The flow in the venous duct is displayed blue. VH hepatic vein, DVA duct of Arantii, VP vena porta (Courtesy of Prof. K.H. Deeg, Bamberg). (c) Same image with the pulsed wave DS. Physiological triphasic flow in the venous duct of Arantii, the main flow direction is away from the transducer, in CDS displayed in blue (Courtesy of Prof. K.H. Deeg, Bamberg). (d) Increased flow in the patent venous duct of Arantii in a newborn with acute liver failure due to neonatal haemochromatosis and HFO ventilation. CDS shows aliasing in the venous duct of Arantii and in the pulsed wave duplex sonogram (PW-DS); a highly increased flow velocity in the venous duct of Arantii is measured (161.6 cm/s). Longitudinal section. (e) Same patient. The very high flow velocity within the venous duct of Arantii leads to a flow reversal in a main portal venous branch. This can be visualised as change of the antegrade flow direction (red) into a reverse (blue) flow. Longitudinal section
The size of the PV varies with age: in 0–5-year-old infants, the diameter is 3.5 ± 2 mm, in 6–12-year-old children 6.3 ± 2 mm and in >12-year-old children 7 ± 2.6 mm (Kao 1996; Vergesslich 1987). A diameter less than 3.5 mm is suggested to be predictive for PV stenosis after liver transplantation (Suzuki et al. 2008). However, no reliable age-dependent cut-off values exist for the PV diameter in the diagnosis of portal hypertension in paediatric patients. In approximately 20 % of the population, there are variations of PV branching pattern (Couinaud 1999; Fraser-Hill et al. 1990). Intrahepatically, the branches of the PV, the HA and the bile ducts neighbour side-by-side (“trias of Glisson” or periportal triangle). In preterm babies and neonates, the left liver lobe may be physiologically large.
CDS helps to identify the PV, possible anatomic anomalies (Fig. 6.20) and its patency and will give first information on flow direction (Coley 2004; Corness et al. 2006). Normally, the PV flow is hepatopetal (synonym: antegrade), exhibits an antegrade band-like flow spectrum and usually has slight respiratory modulations in children in contrast to adults (Fig. 6.21), who more commonly exhibit an unmodulated flow. Flow patterns may be altered by respiration and by atrial contractions (Fig. 6.22a, b). A retrograde trans-sinusoidal transmission of atrial pulsations (Görg et al. 2002) and transmission of pulsations of neighbouring vessels such as the IVC, splanchnic arteries and especially the HA may also alter flow patterns. A pathological pulsatile flow in the PV is predominately seen in severe right heart failure (Fig. 6.22a, b), arterio-portal fistulas and portocaval shunts (Görg et al. 2002; Westra et al. 1995).
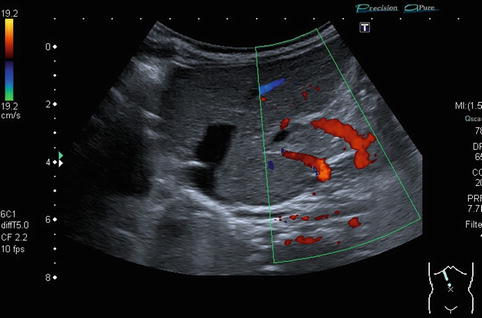
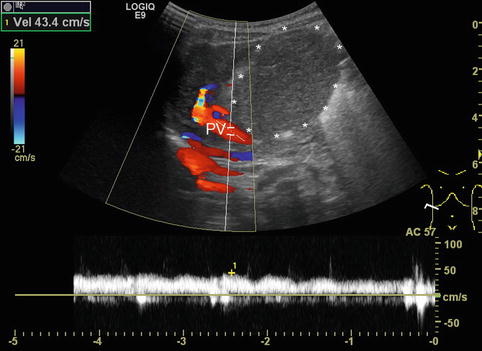
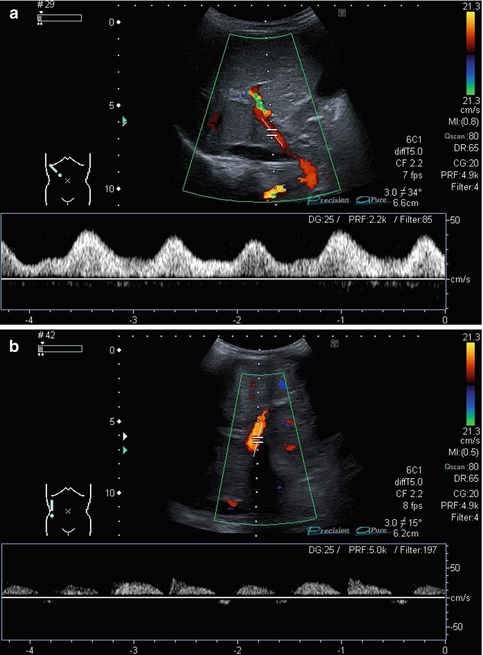
Fig. 6.20
Anatomic variance in a newborn with unclear syndrome. Two separate portal veins can be identified. Oblique intercostal section
Fig. 6.21
Portal venous flow with slight pulsatile alterations. Infant with neonatal haemochromatosis and grossly enlarged caudate lobe. The sample volume of the spectral Doppler is placed in the portal vein (PV). The signals of the hepatic artery can be seen in the background of the pulsed wave Doppler signal of the portal vein. Oblique intercostal section through the liver hilus
Fig. 6.22
(a) Portal venous flow with increased flow velocities and gross pulsatile alterations. Newborn with right heart failure, double outlet right ventricle (DORV), ventricular septal defect (VSD) and persistently patent foramen ovale (PFO). Oblique intercostal section through the liver hilus. (b) Impaired portal venous flow in a child with severely reduced cardiac output and cardiomyopathy. The pulsed wave Doppler signals of the portal vein are not continuously, bow-like and partly even with a reverse (negative) flow direction. In the background single signals of the hepatic artery are visible. Longitudinal section through an enlarged liver
DS spectral tracing enables a more detailed analysis after angle correction. Typically, flow velocities (and sometimes F Vol) are measured in the main PV and vary not only with age, but also with splanchnic activity, increasing after meals. Therefore DS values are ideally acquired in a standardised fasted child. For practical reasons, the fasting state in infants and small children is usually confined to special indications on demand or research. Some authors (Berzigotti and Piscaglia 2011; 2012) recommend the crossing point of the PV with the HA as the ideal reproducible section to measure the PV flow (Fig. 6.23). However, particularly in children with liver cirrhosis and reduced PV flow as well as increased arterial flow to the liver, the PV flow is likely to show major concomitant pulsations from the HA in this section, thus altering the PV flow spectrum; furthermore, it may be difficult to obtain an angle <60° in this section. Patients after liver transplantation usually do not have this clear crossing point any longer.
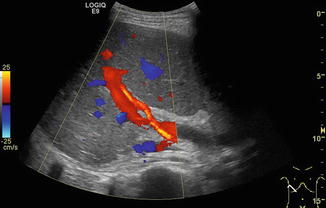
Fig. 6.23
Crossing point of the portal venous main stem and the hepatic artery (HA) in the hilar region in a healthy child. The hepatic artery is depicted in orange due to the higher flow velocity compared to the portal vein (in red). The crossing point is recommended as the ideal reproducible section to measure the portal venous (PV) flow. However, in children with liver cirrhosis and thus reduced PV and increased HA flow, the PV flow is likely to show major concomitant pulsations. Oblique intercostal section through the liver hilus
6.3.4 Hepatic Artery
The greyscale US access to the main HA is the same as for the PV. Additionally one should try to visualise the coeliac trunk in median axial and sagittal sections in order to pick up potential variations such as an additional HA originating from the superior mesenteric or the gastric artery. The HA is usually relatively small and sometimes is only clearly identifiable using CDS. Colour Doppler allows the differentiation of the HA from the common bile duct running just posterior-laterally or from an intrahepatic bile duct portion. Anatomic variations are common, the most common being the accessory HA (Killi 1999). An increased diameter and a tortuous appearance of the HA can be found in patients with hepatitis, liver cirrhosis and liver tumours. HA aneurysms are rare in children.
The HA supplies a rather low resistive organ thus exhibiting an antegrade (hepatopetal) systolic-diastolic flow. The typical DS measurements in the HA are V s, V ed and RI. Optimal angle correction is essential for meaningful DS measurements. Measurements should be taken at the hilar region and, if indicated, in the main branches of the right and left liver lobe.
At least two to three similar consecutive pulse phases should be traced (if possible), to ensure a correct measurement. Exact location of the sample volume within the centre of the vessel is important for correct measurements.
The RI is usually below 0.75. Very low RI < 0.45 may indicate a stenosis of the artery proximally (Fig. 6.24). Additional reasons for a low RI may be hyperperfusion due to inflammation or peripheral shunts (e.g. haemangioendothelioma, arteriovenous or arterio-portal shunts; Fig. 6.25a–b). A low RI may appear secondary to systemic circulation alterations in patients on ECMO or heart assist. The flow velocities and RI decrease from the hilus to the peripheral regions.
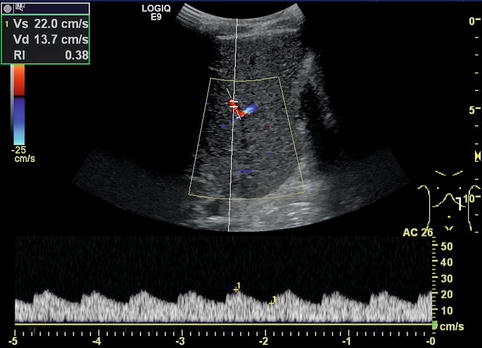
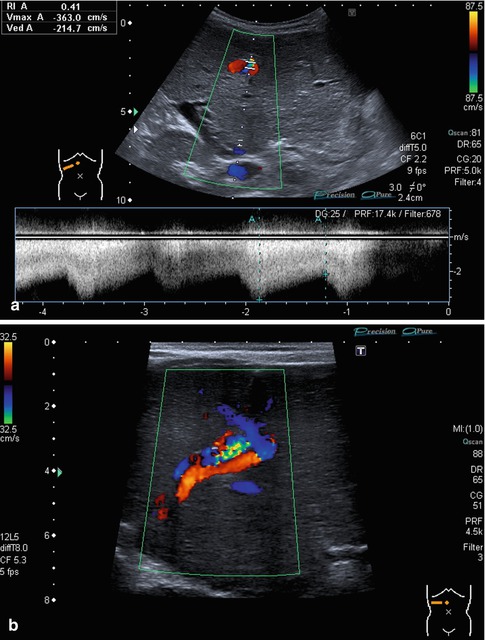
Fig. 6.24
Tardus-parvus pattern in an intrahepatic branch of the hepatic artery distal of a stenosis. Especially, the diastolic flow velocity is increased, resulting in a low resistive index (RI) of 0.38. Left paramedian longitudinal section through the left lobe of a full-size liver transplant
Fig. 6.25
(a, b) Prenatally diagnosed and postnatally rapidly growing haemangioma in an otherwise healthy newborn without signs of cardiac decompensation. (a) B-mode image at 6 weeks of life with a hypoechoic appearance due to dilated vessels; calcifications occurred later after beginning remission, watchful waiting approach. Subcostal oblique section. (b) CDS shows the haemangioma draining into all three hepatic veins. Infant at 6 weeks of age. Subcostal oblique section
Flow velocities and the RI vary with age and, to a lesser extent, with the degree of splanchnic activation. In fasted patients velocities are lower, and after feeding the diastolic flow increases. After meals the velocities and RI in the HA increase by 30 % (Numata et al. 1999), though this phenomenon is less obvious than in the superior mesenteric artery.
F Vol measurements in the HA are problematic due to the small diameter especially in young children with a normal size of the hepatic artery – they get more accurate in older children or when the HA is enlarged. As the diameter of the HA cannot be measured exactly, volume flow in the HA cannot be measured in infancy and childhood.
6.3.5 Liver Veins
The valveless main three LVs can best be displayed in a transverse-oblique section tilted cranially from a right midline transducer position (Fig. 6.26b). As the situs and the access may vary, other approaches such as a more lateral or a more sagittal view may become necessary for assessing a vein, particularly if there are anatomic variations such as an accessory vein or an unusual branching pattern (Fig. 6.27a). Another approach is the measurement of the left LV in a midline sagittal section. The branching inside the liver is sharp-angled; in cases with fatty liver degeneration, it may become blunt-angled (Fig. 6.28a, b). In congestion of the liver, the LV branches are broadened and can be seen up to the periphery. In chronic congestion they may exhibit an echogenic delineation of the vessel borders (Fig. 6.29a), which is normally not present. In liver cirrhosis the LV may alter the straight into a bowed and irregular course and may even not be detectable any longer by greyscale US (Fig. 6.30a, b). In this case, CDS enables detection of the location of the LV and reveals information on the flow direction and directional modulation.
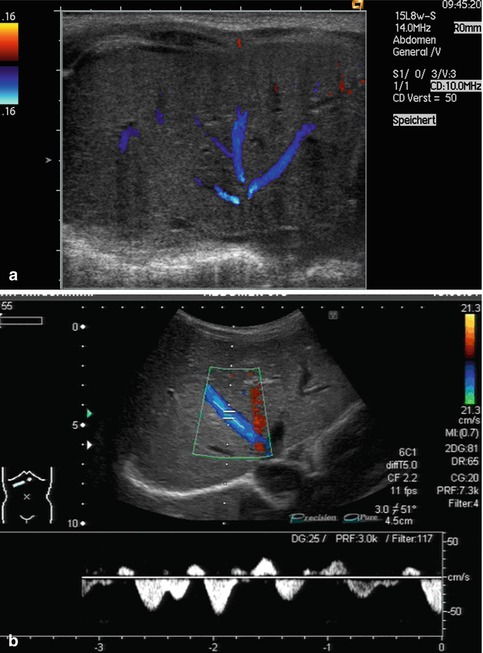
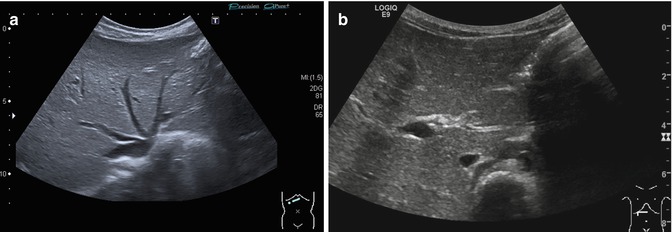
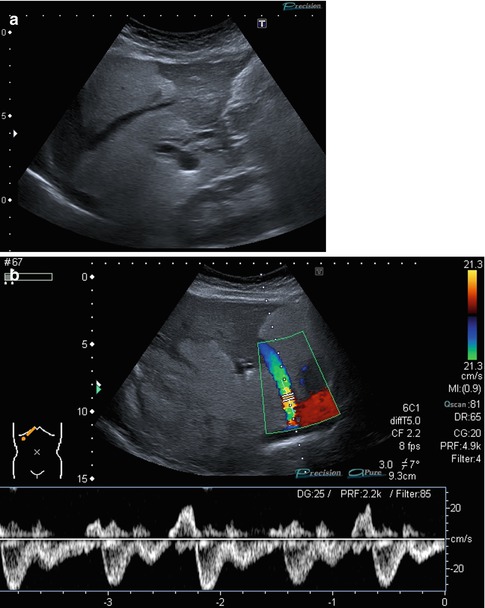
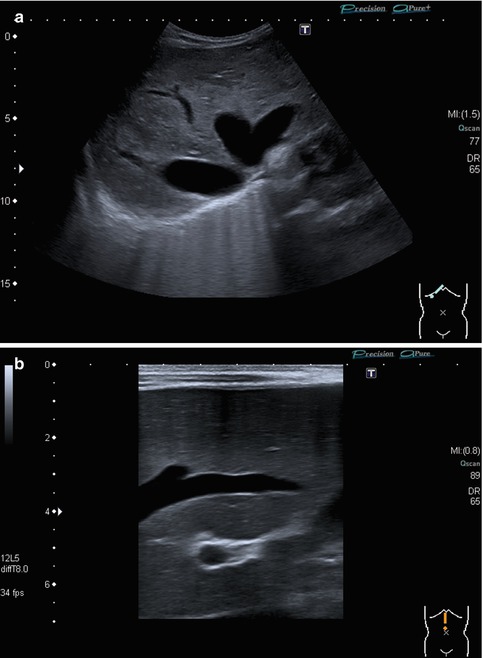
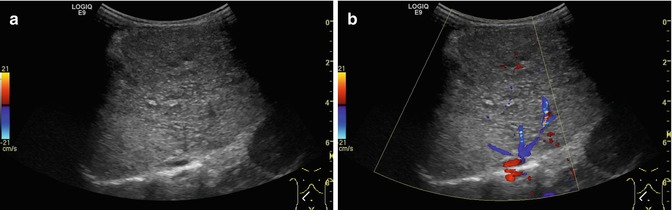
Fig. 6.26
(a, b) Normal findings of the venous hepatic star. (a) B-mode image of the 3 main liver veins draining into the right atrium. Transverse-oblique section tilted cranially from a right subcostal transducer position.(b) CDS and PW-DS of the middle liver vein: normal triphasic flow within the liver vein before reaching the proximal inferior caval vein and the right atrium. Same section
Fig. 6.27
(a, b) Anatomic hepatic vein variations: (a) Common variant: 4 instead of 3 hepatic veins are draining into the right atrium. Transverse-oblique section tilted cranially from a midline transducer position. (b) Accessory hepatic lobe with an unusual branching pattern of the hepatic vessels. Transverse-oblique subcostal section
Fig. 6.28
(a, b) Hepatic veins in focal fatty liver degeneration. (a) The hepatic vein branching inside the liver is usually sharp-angled; in this 12-year-old boy with fatty liver degeneration after rapid loss of 14 kg of weight, it became blunt-angled. Longitudinal section in the right medioclavicular line. (b) Same patient. The flow in the hepatic veins is still normal (triphasic). Transverse-oblique subcostal section
Fig. 6.29
(a, b) Hepatic veins in chronic congestion. (a) Broadened hepatic vein with an echogenic delineation of the vessel border, which is normally not present. Infant with chronic heart failure. Longitudinal midline section. (b) Child with congestive cardiomyopathy and grossly broadened hepatic veins. Transverse-oblique subcostal section
Fig. 6.30
(a, b) Narrowed hepatic veins in liver cirrhosis. (a) In the B-mode US, the hepatic veins can hardly be visualised. Infant with biliary atresia, liver cirrhosis and portal hypertension. Transverse-oblique section tilted cranially from a right subcostal transducer position. (b) Also in CDS, the hepatic veins are narrowed. Same section
The caudate lobe has an own vein, which drains directly into the IVC. This is of special importance in the case of liver vein thrombosis in Budd-Chiari syndrome. The medium LV divides the angiographic left and right liver lobe. Occasionally there may be more than 3 LVs (Fig. 6.27a).
The detailed flow analysis is performed by spectral Doppler analysis, which should be measured close to but not at the inflow into the ICV. The flow in the LV becomes physiologically laminar when measured further away into the liver periphery. If possible, the measurements should be taken at the end of expiration or preferably during normal superficial respiration. Observation of flow modulation is essential: the LV exhibits a strongly undulating bidirectional triphasic flow pattern influenced by the cardiac and the respiratory cycle (Fig. 6.26b) resembling the atrial pressure similar to the jugular venous pulse. The liver veins have a mainly hepatofugal flow consisting of two large waves due to atrial filling in the atrial diastole and ventricular systole and a pronunciation by the tricuspid valve opening. The hepatopetal portion is due to right atrial contraction and tricuspid valve closure in atrial systole and ventricular diastole (Fig. 6.31). These directional changes can be appreciated by the changing colour coding on CDS and – more obvious – by the spectral flow trace (Fig. 6.32). The modulation is usually more prominent in the left and/or the middle than in the right LV. Mono-, bi- and triphasic flows are discriminated (Fig. 6.31). In severe tricuspid regurgitation, the flow will be undulating (Fig. 6.33a–c). In liver cirrhosis the LV flow is becoming monophasic (Zang et al. 2011) due to the decrease in tissue compliance. LV may drain directly into the right atrium without passing the IVC (Fig 6.34), especially after liver transplantation. No changes of the LV flow are depictable by DS with food intake (Chavhan et al. 2008).
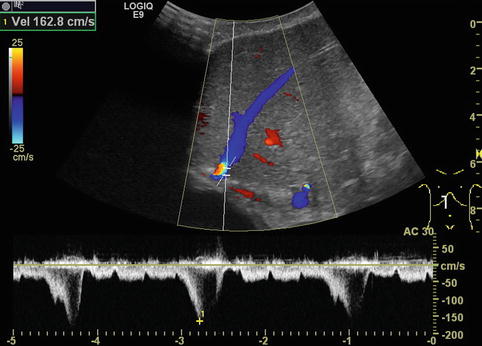
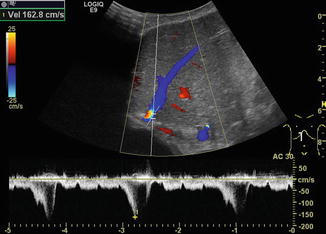
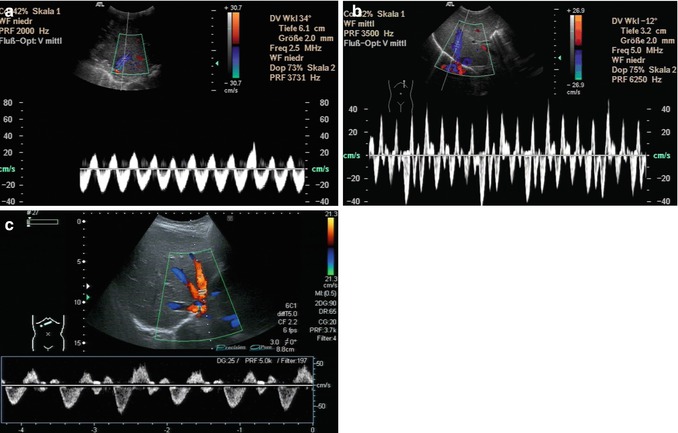
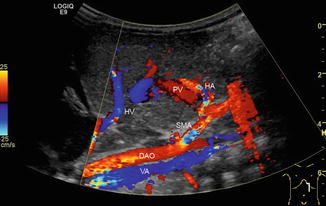
Fig. 6.31
Different flow patterns of the hepatic veins (Adapted according to Coulden et al. (1992)). Alteration of hepatic venous flow patterns can be observed in any liver disease with organ swelling, increased stiffness or parenchymal resistance (Table with description (text) in the first row, schematic drawing in the second row and an example of a Doppler image in the third column, four rows, see below – see extra scheme). 1. Triphasic bidirectional (normal physiological) flow. Normally, one cycle consists of a large wave with hepatofugal direction and a high amplitude that is followed by a hepatofugal wave with a lower amplitude. Thereafter a short reverse (hepatopetal) wave appears above the baseline in the pulsed wave Doppler 2. Triphasic monodirectional flow (unspecific). There is no short reverse (hepatopetal) wave after the big and the small hepatopetal waves under the baseline 3. Biphasic monodirectional (dampened) flow. A large and small wave under the baseline can no longer be distinguished. Hepatopetal waves of nearly the same amplitude 4. Monophasic monodirectional (laminar) flow as a possible sign of severely impaired hepatic venous flow
Fig. 6.32
Aliasing in the hepatic vein close to the inferior caval vein (coded in red) and only bi-monophasic flow due to a stenosis after liver transplantation. Marked respiratory changes in the hepatic venous flow. Longitudinal section in the midline
Fig. 6.33
(a–c) Directional flow changes in the hepatic veins using spectral analysis (PW-DS). (a) Undulating flow in the liver vein in severe tricuspid insufficiency. Longitudinal section in the midline, upper abdomen. (b) Child with cardiac failure and tricuspid insufficiency: even more undulating flow in the hepatic veins. Longitudinal section in the midline, upper abdomen. (c) Atypical flow pattern in a child with a heart assist. In the CDS, the hepatic veins are coded red and blue simultaneously caused by the altered flow by the heart assist. Correspondingly, there are reverse high peaks (waves above the baseline) in the spectral analysis (PW-DS). Transverse-oblique section tilted cranially from a right subcostal transducer position
Fig. 6.34
Colour-coded Doppler sonogram of pathological drainage of the hepatic veins directly into the right atrium. Child with aplasia of the inferior caval vein and azygos persistence (VA) (blue vessel beneath the aorta, which is coded in red) in heterotaxy syndrome. Additionally, hepatic artery (HA) variant originating from the superior mesenteric artery (SMA). PV portal vein, HV hepatic vein, DAO descending aorta. Longitudinal section in the midline through the upper abdomen
6.3.6 Normal Values
There are only little data on normal values of the flow parameters in liver vessels, particularly in neonates, infants and young children. In older children, normal values are similar to those in adults. In general, PV and HA flow velocities and volumes are significantly lower in neonates than in elder children. From neonatology to adolescence, flow velocities gradually increase with age. RI is relatively age independent. This statement is not completely true for neonates – RI values are physiologically higher in neonates than later in life, before they relatively quickly adjust to adult values. This is partially due to the transition of foetal circulation to postnatal circulation. In the first days of life, the still patent ductus Arteriosus Botalli causes a higher RI.
6.3.6.1 Hepatic Artery (HA)
In older children, the HA has a peak systolic flow velocity V s of 70–120 cm/s, with an RI value around 0.5–0.75. In general, RI values below 0.5 and above 0.8 are considered indicative for some sort of perfusion disturbance. These cut-off values do not apply to neonates or preterm babies, where RIs can be much higher and flow velocities are much lower.
6.3.6.2 Portal Vein (PV)
PV peak flow velocities are – as a rule of thumb – above 20 cm/s in the non-fasting child, with some respiratory undulation. Generally 20 cm/s can be used as the lower cut-off value independent of age; in neonates the flow may be lower with a cut-off at 10 cm/s in preterm babies and 15 cm/s in term neonates. The flow pattern and – to a lesser degree – flow velocities are additionally influenced by respiration causing a more undulating flow in earlier years than later in childhood. The flow in the PV is dependent on food intake. In healthy term neonates, the peak portal blood flow may double 15 min after feeding from 24 ± 1.3 cm/s to 35.9 ± 2.4 cm/s (Kao et al. 1996).
6.3.6.3 Liver Veins (LV)
Like in adults, the physiologically triphasic bidirectional modulation of the flow pattern in the LV is modulated by respiration and varies within the three LV – the right LV usually has the least pronounced modulation, whereas the others exhibit stronger undulation. Neonates and infants may sometimes exhibit a physiological monophasic flow pattern. The typical flow pattern in children as well as in adults however is triphasic with flow velocities of 16–40 cm/s (Ahmetoğlu et al. 2005; Chavhan et al. 2008; Coulden et al. 1992; Jequier et al. 2002; Schuller 2008).
6.4 Doppler Sonography in Portal Hypertension
6.4.1 Basic Considerations
Portal hypertension (PH), one of the main conditions that indicate liver DS (Table 6.2), can be diagnosed with high accuracy. The main causes and sonographic features are listed in Tables 6.4 and 6.5. The most common causes are pre-existing systemic or liver diseases (e.g. biliary atresia with consecutive biliary cirrhosis, cystic fibrosis, liver fibrosis in autosomal recessive polycystic kidney disease or nephronophthisis, liver cirrhosis in M. Wilson, α-1 antitrypsin deficiency, tyrosinaemia, M. Niemann-Pick) (Grunert et al. 1989; Tüney et al. 1998). Additionally, acquired PV thrombosis, e.g. after umbilical vein catheterisation, compression by tumours, thrombosis of the LV and congenital PV malformations (the Abernethy malformation complex), may cause portal hypertension.
Table 6.2
Main indications for Doppler sonography of the liver in children
Suspicion of fibrotic or cirrhotic liver alterations |
Portal hypertension |
Neonatal cholestasis |
Acute liver failure |
Focal liver lesions (haemangioma, haemangioblastoma, FNH, metastasis, etc.) |
Vessel alterations (Abernethy syndrome, portal vein thrombosis, Budd-Chiari syndrome, hepatic artery stenosis or occlusion) |
Sinusoidal obstruction syndrome (SOS, synonym: veno-occlusive disease = VOD) |
Stenosis or occlusion of the inferior vena cava |
Status before chemotherapy or bone marrow transplantation |
Liver involvement in chronic cardiac or pulmonary diseases |
Systemic diseases with possible involvement of the liver (ARPKD, nephronophthisis, cystic fibrosis, intoxications, metabolic diseases such as glycogenosis, tyrosinaemia, etc.) |
Monitoring of possible side effects of treatment (e.g. methotrexate) |
Congenital malformations, e.g. heterotaxy syndrome |
Basically, greyscale US already delivers a range of findings that suggest the diagnosis liver cirrhosis:
Rounded shape of the liver
Irregular surface
Hypertrophy of the caudate lobe (segment I)
Enhanced echogenicity
Inhomogeneous liver texture
Ascites
An occluded or enlarged PV (Fig. 6.35)
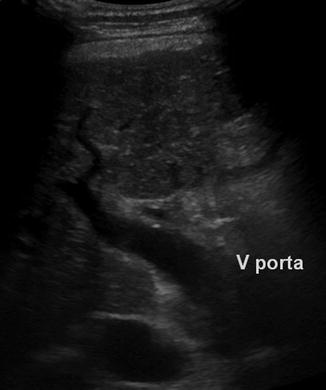
Fig. 6.35
Enlarged extrahepatic and narrowed intrahepatic portal vein (PV) in a child with liver cirrhosis and portal hypertension. Oblique intercostal section through the hilus of the liver
An enlarged HA (Fig. 6.36a, b)
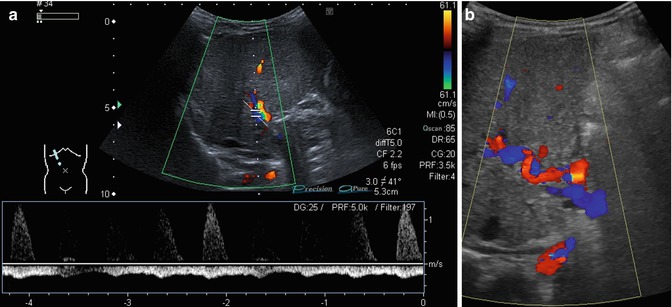
Fig. 6.36
(a, b) Changes of the flow in the hepatic artery in portal hypertension. Oblique intercostal sections through the liver hilus. (a) Prominent hepatic artery with no diastolic flow and retrograde portal vein flow in the spectral analysis (PW-DS). (b) Serpentinous and elongated course of the hepatic artery coded in red (hepatopetal). The portal vein has a reverse (hepatofugal) flow and is therefore coded in blue (flow away from the transducer)
The sensitivity for the US diagnosis of low-grade cirrhosis is rather low (up to70%); however, for advanced disease and PH, the sensitivity is much higher (90–95 %) (Nürnberg et al. 2006; Berzigotti and Piscaglia 2012). Findings suggestive for PH are as follows:
The presence of portosystemic collaterals seen as enlarged.
Tortuous and elongated splanchnic veins.
Spleno-renal shunts.
Collateral vessels at the splenic hilus or lower pole of the spleen, to the flank and chest wall or in the gastric wall (particularly at the gastro-oesophageal junction – indicating oesophageal varicosis) (Fig. 6.37a–l).
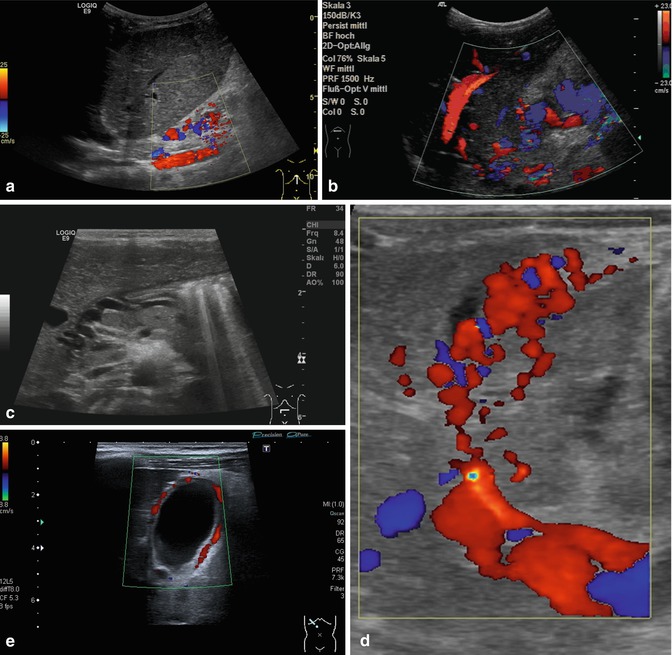
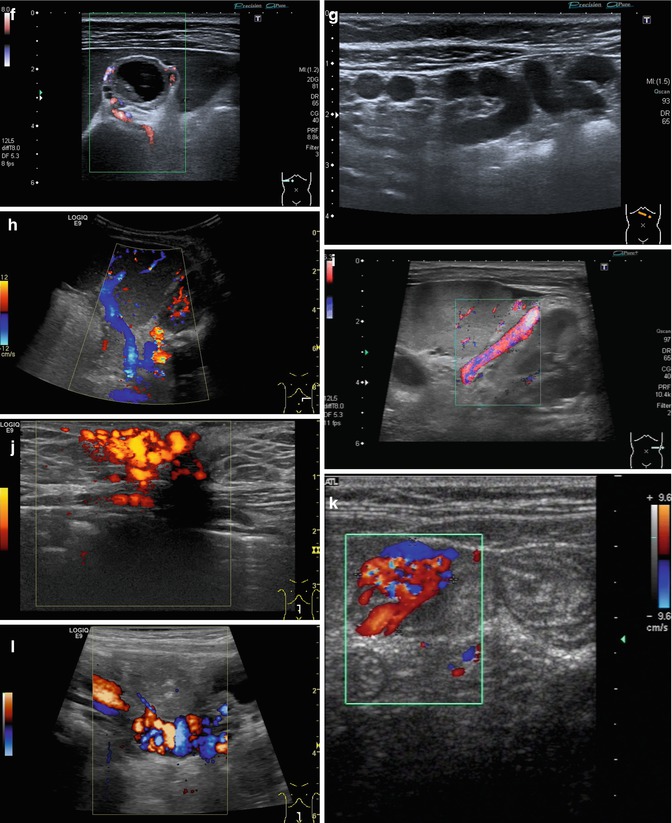
Fig. 6.37
(a–l) Portal hypertension: different pathways of portosystemic collaterals. (a) Perioesophageal collaterals in a child with ARPKD (autosomal recessive polycystic kidney disease) and liver fibrosis. Midline longitudinal section. (b) Multiple collaterals in the subhepatic, peripancreatic and perioesophageal area. Longitudinal section through the right upper abdomen. (c) Coil of dilated pancreaticoduodenal and peripancreatic collaterals in direction towards the oesophagus. Already in B-mode, multiple big, tortuous vessels can be detected. Transverse section through the upper abdomen. (d) Collaterals along the former umbilical vein, which is not recanalised itself. Longitudinal section through the liver. (e) Collaterals around the gallbladder. CDS. Longitudinal section. (f) Collaterals around the gallbladder. Bidirectional power Doppler. Sludge in the gallbladder. Cross section. (g) Collaterals in the abdomen just beneath the abdominal wall. Oblique section through the left abdomen, B-mode. Even without the Doppler, the collaterals can clearly be seen. (h) Shunts with small collaterals between the splenic and renal parenchyma (→) and a large shunt between the splenic and the renal vein (↑). Infant with biliary atresia and portal hypertension. Cross section left lateral upper abdomen. (i) Large spontaneous shunt between the spleen and left kidney arising from dilated gastric veins. Cross section through the left lateral upper abdomen. Infant with biliary atresia and portal hypertension. (j) Paraumbilical collaterals: caput medusae. Child with portal hypertension. Power Doppler, high-frequency probe (15 MHz). Longitudinal section through the umbilicus. (k) Intestinal varices in a child with high-grade portal venous stenosis and portal hypertension. Transverse section through the middle abdomen. (l) Perirectal varices in a girl with biliary atresia, liver cirrhosis and portal hypertension. Power Doppler. Medial longitudinal section through the lower abdomen
A recanalised umbilical vein with a hepatofugal flow direction (Fig. 6.38a, b).
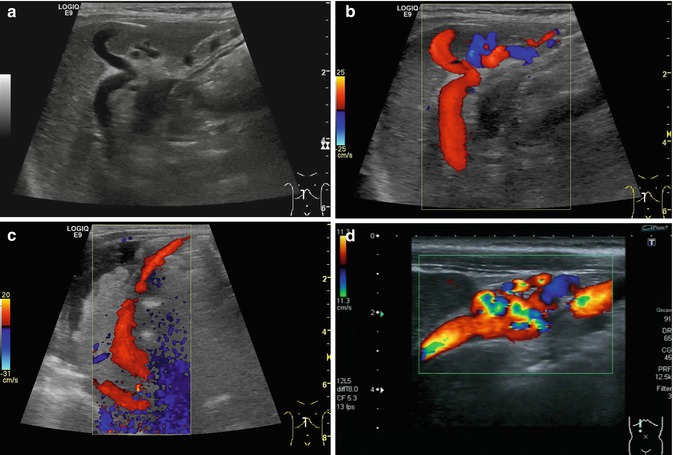
Fig. 6.38
(a–d) Portal hypertension: different patterns of recanalised umbilical veins. (a) Infant with advanced liver cirrhosis and tortuous recanalised umbilical vein. B-mode image. Longitudinal section right upper abdomen. (b) Same patient. Colour-coded Doppler sonogram. Longitudinal section right upper abdomen. (c) Infant with advanced liver cirrhosis, ascites and a large recanalised umbilical vein with hepatofugal flow (red coded) direction running from the left portal venous branch to the umbilical area. Longitudinal section right upper abdomen. (d) Recanalised umbilical vein with tortuous changes. Infant with portal hypertension. Longitudinal section through the right upper abdomen. Immediately below the abdominal wall, multiple tortuous vessels are displayed with colour Doppler
An increasing splenomegaly.
A reduced PV flow velocity (below 20 cm/s) or even a hepatofugal reversed flow and ascites are commonly found in PH (Fig.6.36b).
Additional signs are the gradual flattening of the physiologically triphasic HV flow pattern on PW-DS.
A pathological congestion index of the PV.
On CDS the depiction of PV colour signals may be poor due to the low flow velocities, which may even be missing, undulating or eventually reversed (Fig. 6.36a). In contrast, the HA usually exhibits prominent high-flow signals, due to the compensatory arterial hyperperfusion. Additionally collateral venous vessels, as listed above, may be observed. In the course of PV thrombosis, cavernous transformation of the occluded PV may be visualised as a network of irregular, ectatic, usually physiologically insufficient and torturous atypical low-flow veins in the liver hilus around the course of the PV (Fig. 6.39a–c).
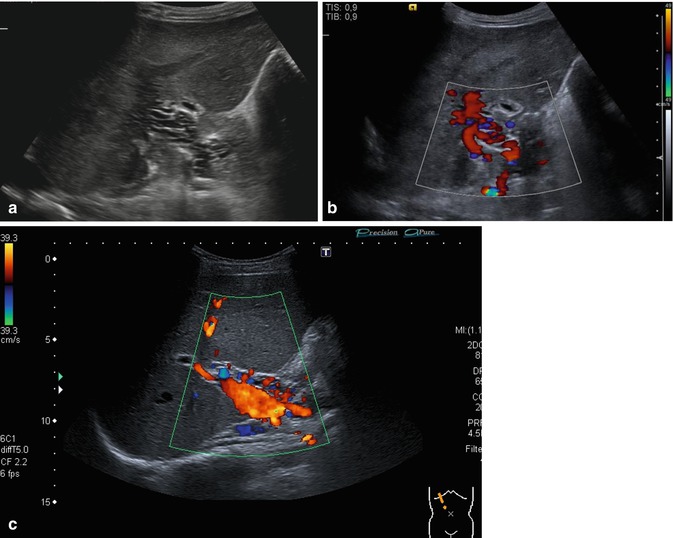
Fig. 6.39


(a–c) Cavernous transformation of the portal vein. Oblique intercostal section through the hilus of the liver. The occluded PV may be visualised as a network of irregular, ectatic, usually physiologically insufficient and torturous atypical low-flow veins in the liver hilum around the course of the PV (a). The portal vein itself is thrombosed, but high-calibre collaterals with an antegrade flow may be confused with the original portal vein (b, c) (a, b Courtesy of Dr. Taut, Dresden)
Related posts:
Stay updated, free articles. Join our Telegram channel
Full access? Get Clinical Tree
