1. Determine myocardial function with gated blood pool imaging.
2. Interpret myocardial volumes and ejection fraction with myocardial perfusion single photon emission computed tomography (SPECT).
3. Select the optimal myocardial perfusion agent based on required performance.
4. Select the appropriate myocardial stress method based on patient presentation.
5. Interpret and report myocardial perfusion SPECT exams.
6. Apply nuclear medicine techniques to evaluate myocardial viability.
7. Select the optimal method for the diagnosis of cardiovascular infection.
8. Select and optimize methods for the diagnosis of myocardial sarcoidosis.
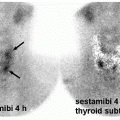
9. Diagnosis and interpret pyrophosphate myocardial SPECT in suspected myocardial amyloidosis.
MYOCARDIAL FUNCTION
Myocardial function is examined with gated blood pool imaging and myocardial perfusion imaging. Gated blood pool imaging, also known as “MUGA,” for “multiple gated acquisition” is a quantitative technique performed most commonly when reliable and reproducible left ventricle ejection fractions are required, typically to evaluate and follow patients treated with cardiotoxic drugs (1).
The blood pool is labeled with technetium-99m (Table 10.1) either with a modified in vivo or more reliably with an in vitro technique. Both methods use the reducing agent stannous pyrophosphate to deliver stannous ion to red cell where 99mTc-pertechnetate will later bind to hemoglobin.
Upon tagging of the blood pool, sequential electrocardiogram (ECG)-gated images are then acquired in anterior, left anterior oblique (LAO), and lateral views. The best LAO view is selected for separation of the ventricles. Caudal-cephalic tilting may help in separating the left ventricle from the left atrium. The end-diastolic frame is acquired at the “R” wave and the R-R cycle is divided into 24 frames with an R-R tolerance window set at between 10% and 20% (1).
The left ventricular ejection fraction is calculated as
LVEF = {[ED – ES]/[ED – Bk]} × 100%
where
LVEF = Left ventricular ejection fraction,
ED = End-diastolic counts,
ES = End-systolic counts,
Bk = Background counts.
The placement of the three region of interests (ROIs) is important, as misplacement results in erroneous ejection fraction calculations (Fig. 10.1).
Figure 10.2 shows adriamycin cardiotoxicity in a 55-year-old woman with breast cancer presenting with shortness of breath; end-diastolic frames in red, end-systolic frames in green, background in yellow.
Top row: initial examination prior to chemotherapy; LVEF = 60% at 65 bpm.
Bottom row: follow-up exam upon completion of chemotherapy; LVEF = 30% at 93 bpm. Note the visually dilated end-systolic frame.
Myocardial function can also be reliably quantitated with gated myocardial perfusion SPECT or positron emission tomography (PET) imaging. In fact, the myocardial volumes measured at SPECT and PET are similar to those measured with cardiac magnetic resonance (MR) (2). A significant advantage for SPECT and PET is the ease with which these volumes are determined after simply locating the myocardium and allowing the computer to rapidly present the results for end-diastolic volume, end-systolic volume, left ventricular ejection fraction, and myocardial mass.
Table 10.2 presents some typical cardiac volumes with their calculated LVEFs and cardiac outputs for a given heart rate. We can see that the LVEF is a global measure of left ventricular health and the simple measurement of LVEF is strongly associated with cardiac outcomes. The normal LVEF is on the order of 65% with a range of between 50% and 80%. LVEFs measured for smaller hearts may be falsely elevated by MUGA or by gated myocardial perfusion SPECT as the small end-systolic lumen may be obscured by blur from the myocardial walls. Thus, we typically report all very high LVEFs as >80%.
Table 10.1 RBC LABELING TECHNIQUES
Labeling Technique
Advantages
Disadvantages
In vivo
Simple and rapid
No risk of blood handling
Incomplete labeling with higher background activity
More sensitive to confounding drugs
In vivo/in vitro
Faster than in vitro labeling
Labeling efficient less than in vitro
Some handling of blood
In vitro
Highest labeling efficiency and stability
Risk of blood handling
Patient blood identification errors
Requires more technical expertise
More expensive, more time consuming
RBC, red blood cell(s).
FIG. 10.1 • Background ROI placed over the spleen. Misplacement of the background ROI over the spleen results in a falsely high measurement subtracted from the denominator results on a low denominator and therefore a falsely high ejection fraction. The LVEF calculated in this case was 90%. Repeat with a correctly placed background between the spleen and the LV results in the correct LVEF = 60%.
LVEF, left ventricular ejection fraction; ROI, region of interest.
Myocardial perfusion is typically performed with the intravenous administration of 99mTc tetrofosmin or 99mTc sestamibi during treadmill or post-coronary vasodilator regadenoson and at rest. SPECT imaging is then acquired, and images are reconstructed in the short axis, vertical long axis, and horizontal long axis (3). Relative regional myocardial perfusion can then be evaluated visually and with computer analysis.
The characteristics of myocardial perfusion imaging radiopharmaceuticals (4,5) are summarized in Table 10.3.
FIG. 10.2 • is an example of results in a patient with LVEF of 60% at baseline dropping to 30% due to adriamycin cardiotoxicity.
While ideally patients are stressed on a treadmill, many patients are unable to exercise adequately for myocardial perfusion scintigraphy. Most commonly, patients are challenged with hyperemic agents like dipyridamole, adenosine, or regadenoson, or by the β1-adrenoceptor stimulator dobutamine. Myocardial pharmacologic agents are summarized in Table 10.4.
As most gamma camera myocardial perfusion SPECT requires on the order of 10 minutes per acquisition or 6 minutes for a half acquisition exam, it is clear that data are not acquired rapidly enough to estimate absolute myocardial blood flow in mL/min/g of myocardium. Myocardial perfusion PET may be acquired in rapid list mode such that temporal resolution of between 0.2 and 10 seconds per data point may be achieved (4,5). Interestingly, rapid dynamic SPECT imaging with cadmium zinc telluride (CZT) crystal technology may achieve temporal resolution of 3 seconds with the ability to quantitate myocardial blood flow with 99mTc sestamibi or 99mTc tetrofosmin (6).
In current practice, myocardial perfusion SPECT is interpreted visually, with or without computer-assisted interpretation. Relative activity from each myocardial region is compared to all of the other myocardial regions. Convincing defects seen only on the post-stress images are interpreted as myocardial ischemia, while regional defects noted at both rest and stress are either infarction, hibernating myocardium, or attenuation artifact. Causes for false-positive and false-negative myocardial perfusion SPECT are listed in Table 10.5.
Absence of stress-induced myocardial perfusion SPECT defects is typically noted in patients without significant coronary artery stenosis. Patients with dilated cardiomyopathy typically demonstrate a dilated left ventricle with reduced left ventricular ejection fraction. Patients with elevated left atrial pressures and prolonged pulmonary transit times may also demonstrate increased lung as in Figure 10.3.
Only gold members can continue reading. Log In or Register to continue