Cell, Tissue, and Tumor Kinetics
▪ THE CELL CYCLE
The ability of cells to produce exact, accurate copies of themselves is essential to the continuance of life; it is accomplished through highly organized processes, well conserved through evolution. Lack of fidelity in cellular reproduction as manifested by DNA and chromosome alterations is a hallmark of cancer.
The only event in the cell cycle that can be identified with a simple light microscope is the condensation of the chromosomes during mitosis (M); this was observed in the late 19th century. Using autoradiography, Howard and Pelc in the early 1950s divided the cell cycle by showing that DNA was synthesized only during a discrete time interval, which they called the S phase. Between mitosis and the S phase was the “first gap in activity” (G1), and between S phase and the next mitosis was the “second gap in activity” (G2). If the cells stop progressing through the cycle—that is, if they are arrested—they are said to be in G0. The cell cycle was discussed in detail in Chapter 4.
Howard and Pelc also showed that it was in these gaps that radiation affects cell cycle progression, because in their early studies, it was obvious that cells arrest cell cycle progression after low-dose radiation damage not in S or M but in either G1 or G2. It was subsequently recognized that these arrests also were related to the process of malignancy, because primary cells would arrest in both G1 and G2, but tumor cells often would show only the G2 arrest point. Breakthroughs in understanding these events and the nature of the cell cycle itself came with the discovery of the cyclins, the cyclin-dependent kinases, and the cyclin-kinase inhibitors and with the elaboration by Weinert and Hartwell of the concept of cell cycle checkpoints. The current concept of the cell cycle and its regulation is illustrated in Figure 22.1.
▪ CYCLINS AND KINASES
Regulation of the complex processes that occur as a cell passes through the cycle is a result of a series of changes in the activity of intracellular enzymes known as cyclin-dependent kinases (Cdks). The active forms of these enzymes exist in protein complexes with a cell cycle phase-specific protein known as a cyclin. Transitions from one phase to the next in the cycle occur only if the enzymatic activity of a given kinase activates the proteins required for progression.
In mammals, cyclins A through H have been described. Each cyclin protein is synthesized at a discrete phase of the cycle: cyclin D and E in G1, cyclin A in S and G2, and cyclin B in G2 and M. Cyclin levels oscillate with phase of the cycle.
Seven Cdks have been described. Cdk levels are constant throughout the cell cycle, but their activity is regulated by cyclin-dependent activating kinases, the protein level of cyclin regulatory subunits, and association with Cdk inhibitors.
Molecular events in G1 prepare the cell for DNA synthesis. There is a stage in G1, known as the G1 restriction point, after which cells are committed to enter the S phase and no longer respond to growth conditions. Prior to this point,
cells may take several routes: They may progress, differentiate, senesce, or die, depending on external signals. Key players in the G1 restriction point include the protein of the retinoblastoma (Rb) gene, D-type cyclins, and Cdk4 and Cdk6, as well as Cdk inhibitors (Fig. 22.1).
cells may take several routes: They may progress, differentiate, senesce, or die, depending on external signals. Key players in the G1 restriction point include the protein of the retinoblastoma (Rb) gene, D-type cyclins, and Cdk4 and Cdk6, as well as Cdk inhibitors (Fig. 22.1).
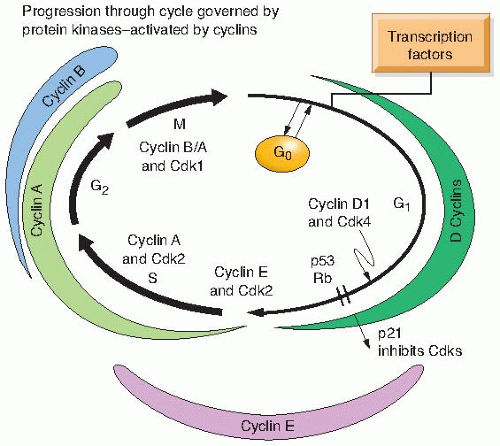 FIGURE 22.1 The current concept of the cell cycle and its regulation by protein kinases, activated by cyclins. |
If extracellular signals stimulate a cell to enter the cycle from quiescence, D-type cyclins are stimulated and continue through G1 and form a complex with Cdk4 or Cdk6. The activated cyclin-Cdk4 or cyclin-Cdk6 complex then phosphorylates the Rb protein, which releases it from E2F and its growth-suppressive function. E2F that is released from the Rb protein binds to the promoter of the cyclin E gene, resulting in increased cyclin E messenger ribonucleic acid (mRNA) and protein. There is more cyclin E available to bind Cdk2 and phosphorylate Rb, resulting in a positive feedback loop that is now refractory to mitogenic signals. Although numerous studies have documented the importance of all three D-type cyclins, two E-type cyclins, and Cdk2, Cdk4, and Cdk6, gene knockout studies in mice have indicated that all of these cyclins and their dependent kinases are not essential for normal cell cycle progression. However, the ability of cells to be transformed by oncogenes is dependent on G1 cyclins and their dependent kinases. The current thinking is that untrans-formed cells require a lower level of G1 cyclins to proliferate and differentiate, whereas transformation requires a quantitatively different level of G1 cyclins. Thus, if increased G1 cyclin activity is needed for transformation, then loss or diminished G1 cyclin activity could act to suppress tumor formation.
Once a cell has committed to entering S, it must begin the incredibly difficult task of accurately copying more than three billion bases of the genome; this feat is completed in a matter of a few hours. DNA polymerases are the enzymes involved in this copying process, which must be completed with high fidelity, aided by repair and misrepair genes that remove and replace mismatched DNA bases. Cyclin A is maximally expressed in S phase and enhances transition of the cell through this phase of the cycle.
After the cell has copied its entire genome, the next important task is to segregate the two copies of the DNA equally into the progeny cells. There is a gap (G2), however, between the end of all detectable DNA synthesis and the beginning of cell division at which the process of condensing and segregating the chromosomes begins. Events during this period are controlled by Cdk activity analogous to that occurring at the G1/S transition, but this time it is a complex of cyclins B and A with Cdk1.
▪ CHECKPOINT PATHWAYS
Events in the cell cycle must take place in a specific order, and it is the function of several checkpoint genes to ensure that the initiation of late events is delayed until earlier events are complete.
There are three principal places in the cell cycle at which checkpoints function:
G1/S checkpoint
S phase checkpoint
G2/M checkpoint
If DNA is damaged, normal cells stop progressing through the cycle and are arrested at one of these checkpoints, depending on their position in the cell cycle at the time at which the damage occurs (Fig. 22.2).
Cells with damaged DNA in G1 avoid replicating that damage by arresting at the G1/S interface, or if they have already passed the restriction point governed by phosphorylation of Rb, they will transiently arrest in the S phase. Avoiding the replication of damaged DNA and allowing time for repair prevent cell death and the accumulation of heritable mutations. The tumor suppressor gene p53 is critical in the pathway that leads to G1 arrest (Fig. 22.2). DNA damage initiates a chain of events: First, ataxia-telangiectasia mutated (ATM) autophosphorylates and releases an active monomer that can directly phosphorylate p53 and murine double minute 2 (Mdm2), the ubiquitin ligase that targets p53 for degradation. In addition, the checkpoint kinases (Chk)—also targets of ATM—can also phosphorylate p53 and Mdm2. Phosphorylation of both p53 and Mdm2 results in increased levels of p53 protein. Activated p53 enhances p21WAF1/CIPI gene expression, which results in a sustained inhibition of G1 cyclin/Cdks. G1 cyclin inhibition prevents phosphorylation of Rb and progression from G1 into S. Mutations in p53 (which are present in so many human tumors) clearly compromise this checkpoint function. A second more rapid but transient checkpoint is also induced by DNA damage through Chk1 phosphorylation of the Cdc25A phosphatase and the inhibition of cyclin E-Cdk2 and cyclin A-Cdk2 complexes. This later checkpoint works independently of p53 (Fig. 22.2).
Control of the S phase checkpoint is in part mediated by the Cdc25A phosphatase inhibiting Cdk2 activity and the loading of Cdc45 onto chromatin. Failure to load Cdc45 onto chromatin prevents the recruitment of DNA polymerase α and replicon initiation (Fig. 22.2). A second mechanism for S phase arrest is signaled by phosphorylation of Nijmegen breakage syndrome (NBS) by ATM. The importance of the S phase checkpoint is in protecting replication forks from trying to replicate through DNA strand breaks.
The arrest of cells in G2 following DNA damage is observed readily in mammalian cells and was studied by radiation biologists for decades before checkpoints were understood at the molecular level. The arrest occurs after the levels of cyclin A increase in quantity but before cyclin B increases. The function of this checkpoint in normal cells is to prevent cells with damaged chromosomes from attempting the complex process of mitosis; they are arrested in G2 to allow DNA repair to be completed. It follows, therefore, that cells lacking the G2 checkpoint are radiosensitive, because they cannot repair all of their damaged chromosomes before entering mitosis. At the molecular level, multiple kinase signaling pathways have been implicated in regulating this checkpoint (Fig. 22.2). For example, ATM and Chk target the Cdc25C phosphatase and prevent cyclin B/A-Cdk1 activation. In addition, other regulatory proteins have been implicated in G2 arrest, such as polo-like kinases, Brca1, and p53bp1. It appears that the G2 checkpoint is the most regulated of all checkpoints and probably the most important in preventing the inappropriate entry of damaged cells into mitosis. Consequently, targeting the inhibition of key components of the G2 checkpoint could increase radiosensitization.
The hallmark of cancer is a lack of the ability to respond to signals that normally would cause the cell to stop progressing through the cycle and dividing. Checkpoint proteins provide an important mechanism by which a cell can temporarily halt its transit through the cell cycle and attempt to restore chromosome integrity.
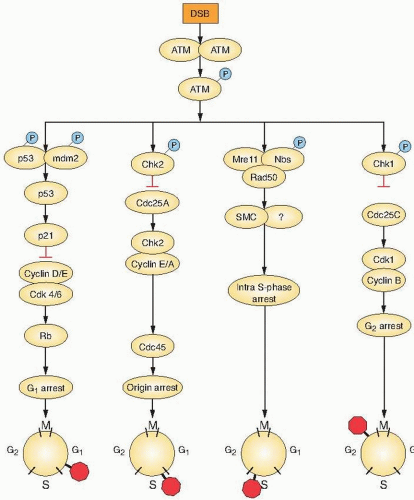 FIGURE 22.2 Diagram depicting the critical role of ATM and its downstream effectors in regulating the cell cycle. In response to DNA damage, ATM becomes activated and phosphorylates different key targets that will inhibit cell cycle progression in different phases of the cell cycle. In G1 phase, ATM phosphorylates p53 and Mdm2, resulting in increased p53 transcriptional activation of the inhibitor p21, which inhibits the cyclin D/E-Cdk4/6 complex. In late G1/early S phase, ATM phosphorylates Chk2 that in turn phosphorylates Cdc25A, a phosphatase that inhibits cyclin E/A-Cdk2 activity. In S phase, ATM phosphorylates NBS and SMC proteins, and transiently inhibits DNA synthesis. In G2 phase, ATM phosphorylates Chk1 that in turn phosphorylates Cdc25C, a phosphatase that inhibits cyclin B-Cdk1 activity. This diagram is included to reinforce the importance of ATM in inhibiting cell cycle progression in response to DNA damage. These interactions are dynamic and simplified and are, in reality, a great deal more complex with many additional accessory proteins. |
▪ QUANTITATIVE ASSESSMENT OF THE CONSTITUENT PARTS OF THE CELL CYCLE
Two relatively simple measurements can be made on a population of cells. First, it is possible to count the proportion of cells that are seen to be in mitosis; this quantity is called the mitotic index (MI). If it is assumed that all of the cells in the population are dividing and that all of the cells have the same mitotic cycle, then
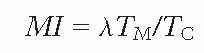
where TM is the length of mitosis (i.e., the time taken for cells to complete division) and TC is the total length of the mitotic cycle, or cell cycle.
The symbol λ is a correction factor to allow for the fact that cells cannot be distributed uniformly in time around the cycle because they double during mitosis (Fig. 22.3). The simplest assumption is that cells are distributed around the cycle exponentially in time, in which case λ has a value of 0.693. In any event, λ is a relatively small and unimportant correction factor.
The second relatively simple measurement requires that the cell population be fed for a brief time with a quantity of tritiated thymidine or 5-bromodeoxyuridine. In the jargon of cell kinetics, it is said to be flash-labeled. The cell population, whether on a petri dish or in a thin section cut from tissue, is then fixed, stained, and viewed through a microscope. A count is made of the proportion of labeled cells. This quantity is called the labeling index (LI).
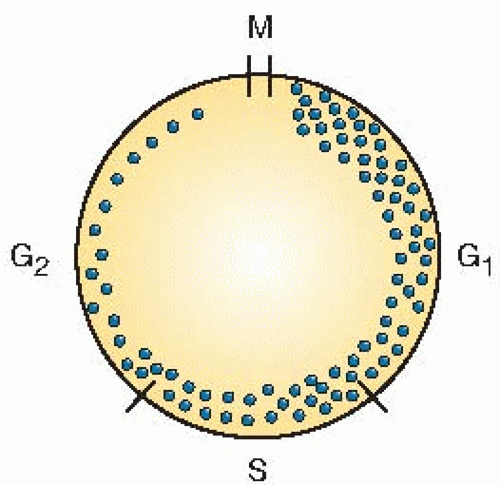 FIGURE 22.3 Diagram illustrating the fact that cells cannot be distributed uniformly in time around the cell cycle because they double in number during mitosis. The simplest assumption is that they are distributed as an exponential function of time. |
Given the assumption that all the cells are dividing with the same cell cycle, then
where TS is the duration of the DNA synthetic period and TC is the total cell cycle time.
In practice, these two quantities—the mitotic index and the labeling index—can be determined from a single specimen by counting the proportion of cells in mitosis and the proportion of cells that are labeled. This is a very important consideration in human studies in which it is usually not practical to obtain a large number of serial specimens of tumor or normal tissue material. Although these measurements yield ratios of the duration of mitosis and DNA synthesis as fractions of the total cell cycle, they do not give the absolute duration of any part of the cycle.
▪ THE PERCENT-LABELED MITOSES TECHNIQUE
A complete analysis of the cell cycle to obtain the length of each phase is only possible by labeling a cohort of cells in one phase of the cycle and observing the progress of this labeled cohort through a “window” in some other readily observable phase of the cycle. In practice, the easiest phase to label is S and the easiest to observe is M.
As stated previously, the labeling can be achieved by using either tritiated thymidine, identifiable by autoradiography, or bromodeoxyuridine, identifiable by a specific stain or antibody. The basis of the technique, therefore, is to feed the population of cells a label that is taken up in S and then to observe the appearance of that label in mitotic cells as they move around the cycle from S to M. To avoid confusion, the technique involving tritiated thymidine is described in detail, partly because it is the original and classic technique and partly because pictures of autoradiographs show up well in black and white. The technique works equally well if bromodeoxyuridine is used. Bromodeoxyuridine-containing DNA can be stained and shows up well in color under a microscope, but does not reproduce well in black and white.
The percent-labeled mitoses technique is laborious and time-consuming and requires a large number of serial samples. It is readily applicable in vitro, for which it is not difficult to obtain a large
number of parallel replicate samples. It may also be applied in vivo for determining the cell cycle parameters of normal tissue or tumors, provided a large number of sections from matched animals or tumors can be obtained at accurately timed intervals. The cell population first must be flashlabeled with tritiated thymidine. Theoretically, the labeled DNA precursor should be available to the cells for a negligibly short time; in practice, an exposure time of about 20 minutes is usually used. In in vitro, the thymidine is added to the growth medium; at the end of the flash-labeling period, it is simple to remove the radioactive medium and to add fresh medium. In in vivo, the tritiated thymidine is injected intraperitoneally; it clearly cannot be removed after 20 minutes, so the exposure time is terminated by the injection of a massive dose of “cold” (i.e., nonradioactive) thymidine.
number of parallel replicate samples. It may also be applied in vivo for determining the cell cycle parameters of normal tissue or tumors, provided a large number of sections from matched animals or tumors can be obtained at accurately timed intervals. The cell population first must be flashlabeled with tritiated thymidine. Theoretically, the labeled DNA precursor should be available to the cells for a negligibly short time; in practice, an exposure time of about 20 minutes is usually used. In in vitro, the thymidine is added to the growth medium; at the end of the flash-labeling period, it is simple to remove the radioactive medium and to add fresh medium. In in vivo, the tritiated thymidine is injected intraperitoneally; it clearly cannot be removed after 20 minutes, so the exposure time is terminated by the injection of a massive dose of “cold” (i.e., nonradioactive) thymidine.
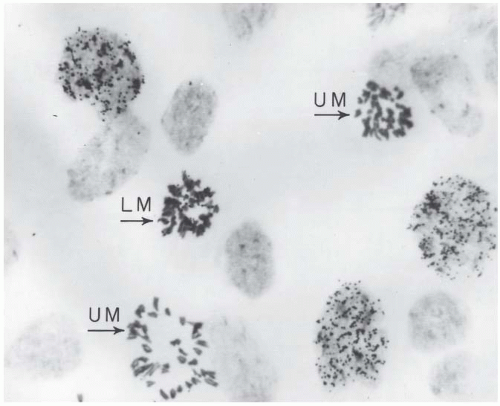 FIGURE 22.4 Photomicrograph of a preparation of mouse corneal cells. The cell preparation was flash-labeled some hours before with tritiated thymidine, which was taken up by cells in S phase. By the time the autoradiograph was made, the cell marked LM had moved around the cycle into mitosis; this is an example of a labeled mitotic figure. Other cells in mitosis are unlabeled (UM). (Courtesy of Dr. M. Fry.) |
During the period in which tritiated thymidine is available, cells in S phase take up the radioactive label. After the label is removed, cells progress through their cell cycles. At regular intervals, usually of 1 hour, a specimen of the cell population must be removed, fixed, and stained and an autoradiograph is then prepared. This is continued for a total time longer than the cell cycle of the population under study. For each sample, the percentage of mitotic cells that carry a radioactive label must then be counted; this is the percentage of labeled mitoses. A photomicrograph of a cell preparation is shown in Figure 22.4. This is a particularly laborious process because only 1% or 2% of the cells are in mitosis in any case, and only a fraction of these will be labeled.
The basis for this type of experiment, if applied to an idealized population of cells that all have identical cell cycles, is illustrated in Figure 22.5, a plot of the percentage of labeled mitoses as a function of time. The cells that are in S while the radioactive thymidine is available take up the label. This labeled cohort of cells then moves through the cell cycle (as indicated by the circles at the top of Fig. 22.5) after the pool of radioactive thymidine has been removed. Early samples contain no labeled mitotic figures, and the first labeled mitotic figure appears as
the leading edge of the cohort of labeled cells reaches M. This point in time is labeled b on the time axis of Figure 22.5; the position of the labeled cohort is indicated above on the circle, which is also marked b.
the leading edge of the cohort of labeled cells reaches M. This point in time is labeled b on the time axis of Figure 22.5; the position of the labeled cohort is indicated above on the circle, which is also marked b.
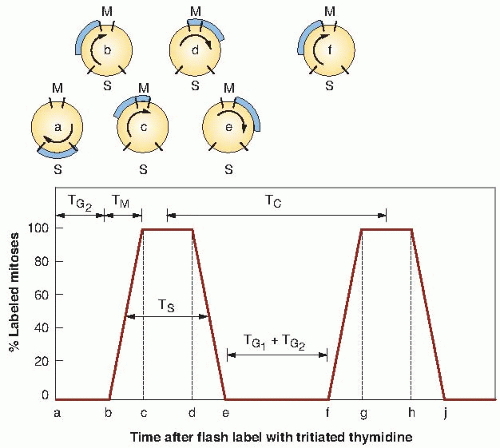 FIGURE 22.5 Percent-labeled mitoses curve for an idealized cell population in which all of the cells have identical mitotic cycle times. The cell population is flash-labeled with tritiated thymidine, which labels all cells in S. The proportion of labeled mitotic cells is counted as a function of time after labeling. The circles at the top of the figure indicate the position of the labeled cohort of cells as it progresses through the cycle. The length of the various phases (e.g., TG2, TM) of the cycle (TC) may be determined as indicated. |
The percentage of labeled mitotic figures increases rapidly as the leading edge of the labeled cohort of cells passes through the M phase; when it reaches the end of the M phase, all mitotic figures are labeled (position c in Fig. 22.5). For the next few hours, all mitotic figures continue to be labeled until the trailing edge of the labeled cohort of cells reaches the beginning of mitosis (position d ), after which the percentage of labeled mitoses rapidly falls and reaches zero when the trailing edge reaches the end of mitosis (position e). There is then a long interval during which no labeled mitotic figures are seen until the labeled cohort of cells goes around the entire cycle and comes up to mitosis again, after which the whole pattern of events is repeated.
All of the parameters of the cell cycle may be calculated from Figure 22.5. The time interval before the appearance of the first labeled mitosis, the length ab, is in fact the length of G2 or TG2. The time it takes for the percent-labeled mitoses curve to rise from 0% to 100% (bc) corresponds to the time necessary for the leading edge of the labeled cohort of cells to proceed through mitosis and is therefore equal to the length of mitosis, TM. The duration of DNA synthesis (TS) is the time taken for the cohort of labeled cells to pass the beginning of mitosis (bd ). Likewise, it is the time required for the labeled cohort to pass the end of mitosis (ce). In practice, TS usually is taken to be the width of the curve at the 50% level, as marked in Figure 22.5.
The total cycle (TC) is the distance between corresponding points on the first and second wave (bf, cg, dh, or ej ) or the distance between the centers of the two peaks as marked on the figure. The remaining quantity, TG1, usually is
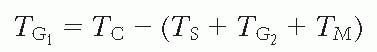
calculated by subtracting the sum of all the other phases of the cycle from the total cell cycle, or
calculated by subtracting the sum of all the other phases of the cycle from the total cell cycle, or
Experimental data are never as clear-cut as the idealized picture in Figure 22.5. Points such as b and e, at which the curve begins to rise and reaches zero, are poorly defined. A more typical experimental result is illustrated in Figure 22.6. The only points that can be defined with any certainty are the peaks of the curves and the 50% levels, and these may be used to give a rough estimate of the lengths of the various phases of the cycle. The S period (TS) is given approximately by the width of the first peak, from the 50% level on the ascending portion of the wave to the corresponding point on the descending curve. The total cell cycle, TC, is readily obtained as the time between successive peaks. In a separate experiment, the mitotic index may be counted, which is equal to λTM/TC; because TC is known, TM may be calculated. The time from flash labeling to the point at which the curve passes the 50% level in Figure 22.6 is TG2 + 0.5 TM; because TM already is known, TG2 may be calculated. The remaining quantity, TG1, is deduced by subtraction, because the total cycle time and all other phases are known.
A careful examination of an actual set of experimental data makes it plain that the first wave in the percent-labeled mitoses curve is not symmetric; the downswing is shallower than the upswing. This observation, coupled with the fact that the second peak is much smaller than the first, indicates that the population is made up of cells with a wide range of cycle times. In many instances, particularly if the population of cells involved is an in vivo specimen of a tumor or normal tissue, the spread of cell cycle times is so great that a second peak is barely discernible.
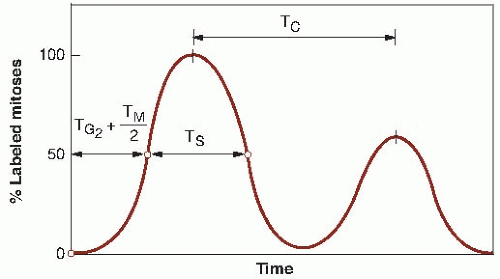 FIGURE 22.6
Get Clinical Tree app for offline access
Related posts:Stay updated, free articles. Join our Telegram channel
Full access? Get Clinical Tree


|