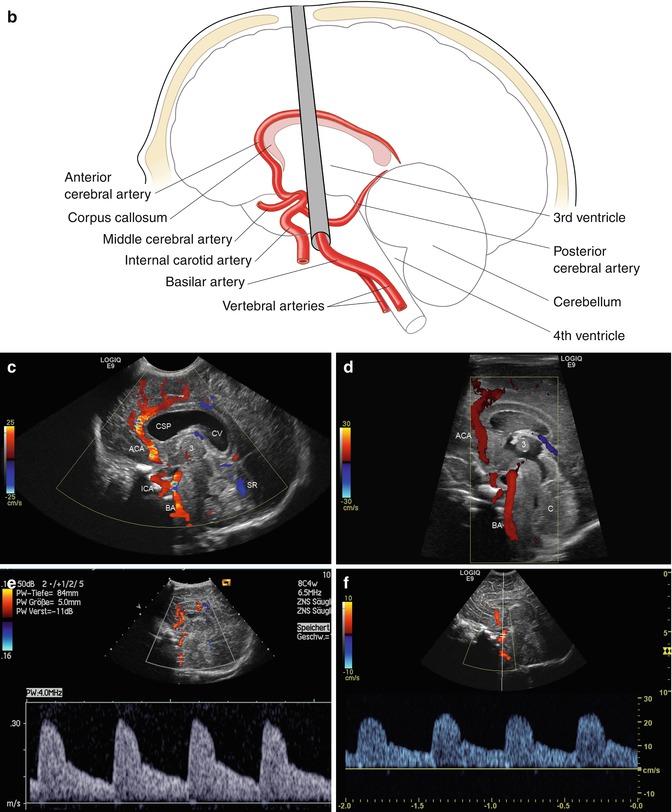
Fig. 2.1
(a) Anatomical specimen of a newborn brain through the midline. The basilar artery (BA) runs in front of the pons cerebri (P) and the anterior cerebral artery (ACA) in front of the 3rd ventricle (3). APC arteria pericallosa, CC corpus corporis callosi, CSP cavum septi pellucidi, GC genu corporis callosi, SC splenium corporis callosi, V vermis cerebelli. (b) Illustration of flow measurement of the flow in the basilar artery (sagittal section) (Drawing by Blankvisual, Thun, Switzerland). (c) Colour Doppler of the flow in the anterior cerebral artery and the basilar artery displayed in a midline sagittal section. ACA anterior cerebral artery, BA basilar artery, CSP cavum septi pellucidi, CV cavum vergae, ICA internal carotid artery, SR sinus rectus, 3 third ventricle. (d) Colour Doppler of the flow in the basilar artery (BA) displayed in a median sagittal section. 3 3rd ventricle, 4 4th ventricle. (e, f) Pulsed Doppler recording of the flow in the basilar artery. The sample volume is placed in the basilar artery in front of the pons. The Doppler spectrum shows systolic-diastolic forward flow typical of a low resistance artery of the brain
Both anterior cerebral arteries (ACA) run approximately in the midline in front of the third ventricle before they course around the genu of the corpus callosum (Figs. 2.1c and 2.2a–c). As both arteries are very close together, they usually cannot be differentiated from each other in sagittal sections. As the flow in the ACA is directed towards the transducer, both arteries are displayed red (Figs. 2.1c and 2.2b, c). The best position for the location of the sample volume within the ACA is just in front of the third ventricle (Fig. 2.2d, e). In this position the angle of incidence is very low which makes quantification of flow velocities in the arteries by spectral Doppler possible without angle correction (Fig. 2.2d).
In front of the genu of the corpus callosum, the artery turns backwards and runs as the pericallosal artery (PCA) around the corpus callosum (Fig. 2.2c). As the flow in the posterior part is directed away from the transducer, the artery is displayed blue (Fig. 2.2c). With spectral Doppler, the flow profile in the PCA is displayed below the baseline (Fig. 2.2f, g). Due to a very high angle of incidence, the flow velocities in the pericallosal artery cannot be quantified. Flow in the ACA should not be measured in the region of the genu of the corpus callosum, as the angle of incidence is not known. The angle varies within a few millimetres, and the exact angle of incidence is not known.


Fig. 2.2
(a) Illustration of flow measurement in the anterior cerebral artery (sagittal section) (Drawing by Blankvisual, Thun, Switzerland). (b, c) Colour Doppler of the cerebral arteries displayed in sagittal sections near the midline. The flow in all arteries runs directly towards the fontanelle and the transducer without significant angles of incidence which makes estimation of flow velocities possible. ACA anterior cerebral artery, APC pericallosal artery, BA basilar artery, ICA internal carotid artery, V vermis cerebelli, VCI vena cerebri interna, VG vena Galeni magna. (d, e) Doppler sonographic flow measurement in the anterior cerebral artery in front of the 3rd ventricle. Normal flow profile with a high diastolic amplitude. The box in the right upper corner shows the flow velocities and the resistance index. The time average maximal velocity is displayed blue; the time average velocity is displayed green within the flow spectrum. (f, g) Doppler sonographic flow measurement in the pericallosal artery: The artery is displayed blue over the corpus callosum. Pulsed Doppler recording displays the flow below the baseline as the flow runs away from the transducer
2.2.2 Parasagittal Sections
If the transducer is slightly angled from the midline in a parasagittal plane, the left or right internal carotid artery (ICA) can be shown at the base of the skull (Fig. 2.3a–c). All three parts of the internal carotid artery can be shown: the petrosal part, the cavernosal part and the cerebral part (Fig. 2.3d–e).
The petrosal part corresponds to the extracranial section of the vessel which is protected by the petrosal bone (Fig. 2.3d, e). This part cannot be compressed by an increased intracranial pressure.
The cavernosal part is the region where the vessel enters the intracranial space and passes through the sinus cavernosus (Fig. 2.3d, e).
The cerebral part is the intracranial section of the vessel (Fig. 2.3d, e).
The internal carotid artery is displayed red, as in all parts of the vessel the flow is directed towards the transducer. The angle of incidence in the petrosal and cerebral part approximates zero which makes quantification of flow velocities in both sections possible (Fig. 2.3f, g). As the angle of incidence in the cavernosal part is not exactly known, flow measurements cannot be performed in this section.
The petrosal part corresponds to the extracranial and the cerebral part to the intracranial section of the vessel. As the angle of incidence is higher in the cerebral part of the ICA, the flow velocities in the cerebral part are somewhat lower than in the petrosal part (Fig. 2.3g). A comparison of the flow velocities in both sections allows early detection of an increased intracranial pressure (page 115).


Fig. 2.3
(a) Illustration of flow measurement of the flow in the internal carotid artery (sagittal section) (Drawing by Blankvisual, Thun, Switzerland). (b, c) Colour Doppler of the internal carotid artery (parasagittal section). The image shows the complex course of the internal carotid artery with the petrosal, cavernosal and cerebral part. (d, e) Expanded image of the base of the skull shows the internal carotid artery with colour Doppler (d) and power Doppler (d). 1 petrosal part, 2 cavernosal part, 3 cerebral part. (f) Pulsed Doppler of the flow in the petrosal part of the internal carotid artery. Normal flow profile and flow velocities. (f, g) Pulsed Doppler flow measurement in the petrosal part (left side of the image) and the cerebral part (right side of the image) of the internal carotid artery. Systolic-diastolic forward flow. Due to a greater angle of incidence of the Doppler beam, the flow velocities intracranially (in the cerebral part) are lower than in the extracranial part (the petrosal part) of the internal cerebral artery
If the transducer is tilted a few degrees more to the side, the vascular supply of the basal ganglia can be shown (Fig. 2.4a–d). The thalamostriatic or lenticulo-striatic arteries course like the stretched fingers of a hand through the thalamus (Fig. 2.4a–d). Spectral Doppler shows a low resistance flow with very low flow velocities of only a few centimetres per second (Fig. 2.4e).
If the transducer is angled more laterally, the insular arteries can be shown in a section lateral to the latter view (Fig. 2.4f, g).


Fig. 2.4
(a) Colour Doppler of the flow in the lenticulo-striatic arteries (LAS) (parasagittal section). The LAS run like the expanded fingers of a hand within the basal ganglia. PCA posterior choroid artery. (b, c) Colour Doppler of the lenticulo-striatic arteries (LSA) of a preterm infant. PCA posterior choroidal artery, APC pericallosal artery, VCI vena cerebri int. (d) Power Doppler of the thalamostriatic arteries. (e) Pulsed Doppler recording of the flow in the thalamostriatic arteries. Spectral Doppler shows normal systolic-diastolic forward flow with very low flow velocities of 3 cm/s. (f, g) Colour Doppler of the flow in the insular arteries (transducer angled far to the side)
2.2.3 Coronal Sections
In coronal sections all greater intracranial arteries can be shown by CD: the anterior cerebral arteries, the internal carotid arteries, the middle cerebral arteries, the lenticulostriatic arteries, the basilar artery, the posterior cerebral arteries and the vertebral arteries. With exception of the middle cerebral arteries, all other arteries have a favourite angle of incidence below 20° which makes quantification of flow velocities with spectral Doppler possible.
Anterior coronal planes display the anterior cerebral arteries (ACA) between the frontal lobes (Fig. 2.5a, b). As the flow is directed towards the transducer, the arteries are displayed red (Fig. 2.5b). Bad lateral resolution of most sonographic equipment usually does not allow the separation between the left and right anterior cerebral arteries. Due to low angle of incidence, the quantification of flow velocities in the ACA is possible without angle correction (Fig. 2.5c–e).


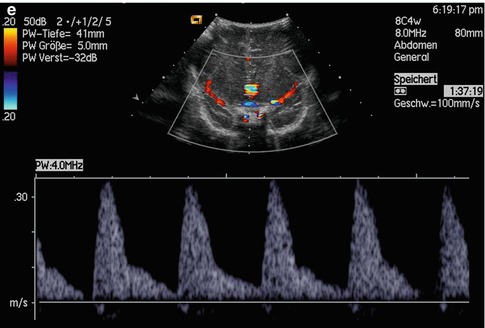
Fig. 2.5
(a) Illustration of flow measurement in the anterior cerebral artery in coronal sections (Drawing by Blankvisual, Thun, Switzerland). (b) Colour Doppler of the anterior cerebral artery in a coronal plane angled anteriorly. (c–e) Pulsed Doppler recordings of the flow in the anterior cerebral artery in coronal sections tilted anteriorly
Middle coronal planes show the course of both internal carotid arteries (ICA) as they transverse the base of the skull (Fig. 2.6a–d). Lateral to the echogenic sella, both carotid arteries can be shown. Three sections can be distinguished: the petrosal part, the cavernosal part and the cerebral part. Below the echogenic sella is the petrosal part, above the cerebral part (Fig. 2.6b–d). The cavernosal part cannot be shown simultaneously, as the artery leaves the plane anteriorly. The angle of incidence within the petrosal part is zero, whereas the cerebral part is met by a small angle of incidence between 20° and 30° (Fig. 2.6b–d). A comparison of the flow velocities extracranially (petrosal part) and intracranially (cerebral part) therefore shows slightly lower values intracranially (Fig. 2.6e, f).
Lateral to the cerebral part of the carotid arteries, the origin of both middle cerebral arteries (MCA) can be shown by CD (Fig. 2.6b, c). The angle of incidence is between 60° and 90° which makes flow measurements impossible. However, in the insular region the branches of the middle cerebral artery can be measured due to a very low angle of incidence (Fig. 2.6b).
Branches of the MCA are the lenticulostriate arteries which perfuse the basal ganglia and internal capsule. They can clearly be shown and measured with low flow settings (Fig. 2.6g, h).


Fig. 2.6
(a) Illustration of flow measurement in the internal carotid artery in coronal sections (Drawing by Blankvisual, Thun, Switzerland). (b, c) Colour Doppler of the flow in both internal carotid arteries (ICA) and their branches middle cerebral artery (MCA) and anterior cerebral artery (ACA). (d) Colour Doppler of the internal carotid arteries. PP pars petrosa, PC pars cerebralis, S sella. (e) Pulsed Doppler recording of the flow in the extracranial part of the internal carotid artery (petrosal part). (f) Pulsed Doppler recording of the flow in the intracranial part of the internal carotid artery (cerebral part). (g, h) Lenticulostriatic arteries (TSA) (median coronal section); MCA middle cerebral artery
If the transducer is slightly angled posteriorly, the basilar artery (BA) can be shown in a plane tangentially to the base of the skull (Fig. 2.7a, b, d). As the angle of incidence is minimal, quantification of flow velocities is possible (Fig. 2.7c).
The basilar artery originates from the confluence of both vertebral arteries (VA) which form a Y standing upside down (Fig. 2.7d, e). Flow within both vertebral arteries can be measured just beneath the confluence where the angle of incidence is low (20–30°) (Fig. 2.7g, h).
At the end of the basilar artery, both posterior cerebral arteries (PVC) originate (Fig. 2.7d, e). In contrast to all other intracranial arteries, these arteries are displayed blue, as the flow in the PCA runs away from the transducer towards the cerebellum (Fig. 2.7d). Due to a favourite angle of incidence, flow velocities in the PCA can be measured in all these arteries (Fig. 2.7f).


Fig. 2.7
(a) Illustration of flow measurement in the basilar artery in coronal section (Drawing by Blankvisual, Thun, Switzerland). (b, c) Colour and pulsed Doppler of the flow in the basilar artery (coronal section tilted posteriorly). The image additionally shows the cerebral part of the internal carotid arteries. (d, e) Vertebrobasilar confluence at the base of the skull. ACA anterior cerebral artery, BA basilar artery, PCA posterior cerebral artery, VAl left vertebral artery, VAr right vertebral artery. (f) Doppler sonographic flow measurement in one posterior cerebral artery in a coronal section angled slightly posteriorly. The sample volume of the pulsed Doppler device is placed in the posterior cerebral artery which is displayed blue. The Doppler spectrum shows a systolic-diastolic forward flow which is directed away from the transducer and displayed below the baseline. (g) Pulsed Doppler recording of the flow in one vertebral artery. (h) Doppler sonographic flow measurement in both vertebral arteries (right artery on the left side of the image, left artery on the right side of the image). Similar flow velocities in both arteries
2.2.4 Axial Sections
The flow in the middle cerebral artery cannot be measured in coronal or sagittal sections through the anterior fontanelle, as the angle of incidence is too high. To perform Doppler sonographic flow measurements in the middle cerebral arteries (MCA), axial sections are necessary.
The transducer is placed over the temporal bone just above the ear and slightly before it. The temporal bone is very thin and allows transmission of the ultrasonic beam even in older children and adults. Besides the foramen magnum and the orbits, it is the only access to the brain for ultrasound after closure of the fontanelles and sutures.
Besides the middle cerebral arteries, both anterior and posterior cerebral arteries and the anterior and posterior communicating arteries can be shown (Fig. 2.8a). This allows a complete visualisation of the circle of Willis (Fig. 2.8).
In infants the thin temporal bone allows the use of high-frequency transducers of 7 MHz. The thicker bone in older children and adolescents requires better penetration with lower frequencies up to 2 MHz.
The investigation begins with the visualisation of the cerebral peduncles which are displayed like an echo poor butterfly (Fig. 2.8a).
The middle cerebral arteries (MCA) originate several millimetres in front of the cerebral peduncles. The flow within the ipsilateral MCA is directed towards the transducer. The ipsilateral MCA is therefore displayed red, whereas the flow in the contralateral MCA is directed away from the transducer which is displayed blue (Fig. 2.8a). In both arteries the angle of incidence is below 30°. Therefore, quantification of flow velocities is possible without angle correction (Fig. 2.8c, d). With pulsed Doppler sonography, the flow in the ipsilateral MCA is displayed over the baseline (Fig. 2.8c), whereas the flow in the contralateral MCA is displayed below the baseline (Fig. 2.8d) as is directed away from the transducer.
The anterior cerebral arteries (ACA) originate several millimetres anterior of the MCA. The ipsilateral ACA is displayed blue as the flow runs away from the transducer, whereas the contralateral artery is displayed red as the flow is directed towards the transducer (Fig. 2.8a). With spectral Doppler the flow in the ipsilateral ACA is displayed below the baseline (Fig. 2.8b), whereas the flow in the contralateral ACA is displayed over the baseline.
Both posterior cerebral arteries run around the cerebral peduncles (Fig. 2.8a, e). Two segments, the P1 and P2 segment, can be differentiated (Fig. 2.8e). The flow in the P1 segment of the ipsilateral artery is displayed red as it is directed towards the transducer; the flow in the ipsilateral P2 segment is displayed blue as it runs away from the transducer (Fig. 2.8e). In the contralateral posterior cerebral artery, the P1 segment is displayed blue, as the flow runs away from the transducer, whereas the flow in the contralateral P2 segment is displayed red as it runs towards the transducer (Fig. 2.8a). Spectral Doppler shows an antegrade flow profile in the ipsilateral P1 segment and a retrograde flow profile in the P2 segment (Fig. 2.8f).
Due to small angles of incidence, flow velocities can be calculated within both MCA, ACA and the P1 segment of both PCA (Fig. 2.8b–d). To measure the flow in the P2 segment of the PCA, angle corrections have to be performed (Fig. 2.8f).

Fig. 2.8
(a) Colour Doppler of the flow in the circle of Willis in an axial section through the temporal bone. ACA anterior cerebral artery, MCA middle cerebral artery, PCA posterior cerebral artery, P 1 P1 segment, P 2 P2 segment, PC pedunculi cerebri. (b) Doppler sonographic flow in the ipsilateral anterior cerebral artery shows normal flow profile. The flow is directed away from the transducer and displayed blue and below the baseline. 1 anterior cerebral artery, 2 middle cerebral artery, 3 posterior cerebral artery. (c) Doppler sonographic flow in the ipsilateral middle cerebral artery shows normal flow profile. The flow is directed towards the transducer and therefore displayed above the baseline. 1 ipsilateral anterior cerebral artery, 2 ipsilateral middle cerebral artery, 3 contralateral anterior cerebral artery, 4 contralateral middle cerebral artery. (d) Doppler sonographic flow in the contralateral middle cerebral artery shows normal flow profile. The flow is directed away from the transducer and therefore displayed below the baseline. 1 ipsilateral anterior cerebral artery, 2 ipsilateral middle cerebral artery, 3 ipsilateral posterior cerebral artery, 4 contralateral anterior cerebral artery, 5 contralateral middle cerebral artery, 6 contralateral posterior cerebral artery. (e) Colour Doppler of the flow in the posterior cerebral artery (axial section). P 1 P1 segment, P 2 P2 segment, PC pedunculus cerebri. (f) Pulsed Doppler sonography of the flow in the P2 segment of the ipsilateral posterior cerebral artery. As the flow runs away from the transducer, it is displayed below the baseline
2.2.5 Flow Measurements
In all cerebral arteries a forward flow during systole and diastole, which is displayed above the baseline, can be shown. The diastolic forward flow is caused by the ‘Windkessel’ function of the aorta and the low peripheral resistance in the cerebral arteries. The flow profile is characterised by a steep systolic increase, a small systolic peak and a steep end-systolic decrease. The short end-systolic backflow in the aorta, caused by the closure of the aortic valve, leads to a shoulder in the declining part of the flow curve. During diastole a slow further decrease of the flow velocities is typical (Fig. 2.9).
The systolic forward flow is caused by the contraction of the left ventricle, whereas the diastolic flow is the result of the Windkessel function of the aorta and the low peripheral vascular resistance of the brain. Without the Windkessel function of the aorta, no blood would flow through the cerebral arteries during diastole. Each cardiac contraction would have to speed up the whole blood column from zero.
From the flow curve the peak systolic flow velocity (V s), the end-systolic flow velocity (V es) and the end-diastolic flow velocity (V ed) can be determined (Fig. 2.9). V s represents the peak of the flow curve, V es the shoulder in the declining part of the flow curve and V ed the end of the pulse cycle (Fig. 2.9).

Fig. 2.9
Estimation of flow velocities in the cerebral arteries. V s peak systolic flow velocity, V es end-systolic flow velocity, V ed end-diastolic flow velocity, TAV time average velocity (average of all flow velocities during the cardiac cycle; all flow velocities below the peak systolic flow velocities are considered), TAMX time average maximal velocity (mean of the peak systolic flow velocity)
Additionally the time average flow velocity (TAV) and the time average maximal velocity (TAMX) can be measured.
TAMX is identical with the area under the flow curve (AUC).
TAV considers all flow velocities below the maximal flow. The different grey points symbolise a cluster of erythrocytes which moves with the same velocity. The lighter the points are, the more erythrocytes move with that velocity; the darker the points are, the less erythrocytes move with that velocity. The time average flow velocity (TAV) is the mean of all flow velocities which are registered by spectral analysis. TAV is always lower than TAMX.
Especially TAV is important for the calculation of the volume flow and the estimation of the perfusion.
From the flow curve, two indices can be calculated: the resistance index and the pulsatility index. In contrast to the flow velocities, which are angle dependent, the indices are independent of the angle of incidence.
The resistance index (RI) was first described by Pourcelot. It is defined as follows:

The pulsatility index (PI) was defined by Gosling as follows:

V s is the peak systolic flow velocity.
V ed is the end-diastolic flow velocity.
V m is the mean flow velocity (TAMX).
It is identical with the area under the curve.
As the PI or RI is angle independent, many papers in the recent 20–30 years have used the indices. Different changes in the numerator or denominator however may lead to the same value.
We therefore prefer absolute flow velocities. The peak systolic flow velocity (V s) and the end-diastolic flow velocity (V ed) can easily be measured. The time average flow velocity (TAV) is estimated by most modern Doppler machines. It is very helpful for the calculation of the volume flow in different intracranial arteries.
2.2.6 Normal Flow Velocities in the Intracranial Arteries in Healthy Infants
Healthy premature infants, mature neonates and older infants show an antegrade flow during systole and diastole. Flow velocities in the cerebral arteries are influenced by a lot of parameters such as the vigilance, the rhythm of sleep and awake, the blood gases, gestational age, actual age and weight and other variables.
Dependency of the Flow Velocities on Alertness
The sleeping infant shows lower flow velocities in the intracranial arteries than the wake infant. The behavioural state influences blood flow velocities in stable preterm infants (Ramaekers et al. 1989). Polysomnographic investigations have shown that flow velocities in REM sleep are 28.6 % higher than in non-REM sleep.
From the clinical point of view, it is unrealistic to investigate only sleeping infants, as most infants wake up when they are transported and investigated. As flow velocities increase significantly if the infant is fighting against the investigator, flow velocities in crying or struggling infants should not be measured. In crying infants, blood pressure and intrathoracic pressure increase which leads to an increase of all flow velocities. If the child keeps the breath, especially diastolic flow velocities increase, which causes a dramatic decrease of the resistive index.
Sudden inspiration during hiccups may lead to a decrease of antegrade end-diastolic flow or to a short flow reverse.
Dependency of the Flow Velocities on Arterial pCO2
Within physiologic limits a linear relationship exists between the pCO2 and brain perfusion. Increasing pCO2 leads to an increase of brain perfusion. Below 20–25 mmHg pCO2, the linear regression line takes a curved course (Hansen et al. 1984). Below 20 mmHg a further decrease of the pCO2 causes only insignificant alterations of brain perfusion.
Regulation of brain perfusion is caused by alterations of the diameter of the small resistance arteries. The bigger arteries however have a relative constant diameter (Hilal 1974). An increase of the flow velocities in the bigger intracranial arteries corresponds to an increase of volume flow and perfusion.
Doppler sonography showed an increase of the flow velocities with increasing pCO2 (Markwalder et al. 1984). Diastolic forward flow was significantly reduced especially if pCO2 was very low. If pCO2 was below 30 mmHg, diastolic flow was often absent. Especially the end-diastolic flow velocity was very low (Fig. 2.10). Figure 2.10 shows the increase of the flow velocities in the anterior cerebral artery dependent on the level of the pCO2 in a preterm-born infant with a gestational age of 28 weeks. After transferral of the patient from the birth clinic to the neonatologic ward, a low pCO2 could be found. Continuous reduction of the respiratory parameters and increase of the pCO2 caused an increase of the flow velocities (Fig. 2.10). Diastolic flow velocities especially the end-systolic and end-diastolic velocities increased significantly more than the peak systolic flow velocity. The percentage of increase of the mean flow velocity/mmHg pCO2 was 6 %. Similar results were found by Markwalder et al. (1984) who investigated adults: They found an increase of brain perfusion of 3.4 ± 0.5 % per mmHg change of pCO2. Jorch et al. investigated 16 premature-born infants and newborns. They found an increase of mean flow velocity in the anterior cerebral artery of 6.5 % and in the internal carotid artery of 5.6 % per mmHg pCO2 changes (Jorch and Menge 1985).

Fig. 2.10
(a) Peak systolic (V s), end-systolic (V es) and end-diastolic (V ed) flow velocities in the cerebral arteries during increasing CO2 levels. Significant increase of the flow velocities with increasing CO2 levels. (b) Time average (TAV) and time average maximal (TAMX) flow velocities in the cerebral arteries during changing CO2 levels. Significant increase of the mean flow velocities with increasing. (Drawing by Blankvisual, Thun, Switzerland)
Based on the dependency of the blood velocities in brain arteries on the pCO2 level, the pCO2 has always been kept in mind when pathologic flow velocities and profiles are judged especially in ventilated preterm infant. Low pCO2 levels can lead to a dramatic decrease of the diastolic forward flow; therefore, hyperventilation has to be strictly avoided as it may reduce brain perfusion.
In neonatal asphyxia low flow velocities could be identified as a risk factor for intracranial haemorrhage (Deeg et al. 1987 c; 1990b). Hyperventi-lation causes a further decrease of the flow velocities. Brain perfusion may fall under a critical limit especially in the watershed regions of the germinal matrix and cause ischaemic lesions.
Hypercapnia on the other side may markedly increase flow velocities and brain perfusion. The small immature capillaries may rupture and cause intracranial bleeding. The increased incidence of intracranial bleeding in infants with pneumothorax can partially be explained by an increase of the pCO2 level (Deeg 1989 b).
2.2.6.1 Dependency of the Flow Velocities on Gestational Age and Actual Age
Flow velocities increase with increasing gestational age (Horgan et al. 1989). In comparison with neonates, the flow velocities of premature babies with a gestational age of 28 weeks are only half as high. Besides gestational age, the actual age of the infant plays an important role. With increasing age the flow velocities increase especially in the first months of life (Horgan et al. 1988) (Fig. 2.11). The increase of the flow velocities was greater in children with higher gestational age (Horgan et al. 1989). During the first month of life, flow velocities double in the anterior cerebral artery, the basilar artery and the internal carotid artery (Fig. 2.11a–c). If pathologic flow velocities are judged, gestational age and actual age have to be kept in mind.

Fig. 2.11
(a–c) Increase of the flow velocities in the cerebral arteries of a premature-born infant (28 weeks of gestation) in the first weeks of life. The peak systolic flow velocities in the internal carotid arteries are about 20 % higher than the flow velocities in the anterior cerebral and basilar artery. No significant differences between the arteries exist concerning the end-systolic and end-diastolic flow velocities. a peak systolic flow velocities, b end-systolic, c end-diastolic flow velocities
For the calculation of normal values in intracranial arteries, the corrected age was estimated as the sum of gestational age (weeks) and the postnatal age (weeks). In healthy premature-born infants and normal neonates, a linear increase of the flow velocities could be found in the anterior cerebral artery and the basilar and internal carotid artery (Deeg and Rupprecht 1988a, b; 1989). The increase within the first months of life is nearly linear. Then a slower further increase of the flow velocities till 5–6 years of age can be found (Bode and Wais 1988). The peak of the flow velocities can be found with 6 years of age (Bode and Wais 1988). Afterwards a slow linear decrease of the flow velocities to 70 % of the values measured at 6 years of age can be found during school age, adolescence and young adulthood (Bode and Wais 1988). With increasing age, flow velocities further decrease.
The increase of the flow velocities in neonatal period is caused by the increase of cardiac output in the first days of life. Cardiac output increases rapidly till 10th week of life, afterwards more slowly. Our Doppler sonographic flow measurements showed a twofold increase of the flow velocities within the first month of life (Deeg and Rupprecht 1987a, b, c; 1988; 1989).
Age dependencies of the peak systolic flow velocity (V s), the end-systolic flow velocity (V es), the end-diastolic flow velocity (V ed), the time average maximal velocity (TAMX) and the time average velocity (TAV) in the different arteries are shown in the Graphics 2.1, 2.2, and 2.3.


Graphic 2.1
Normal values of the flow velocities in the anterior cerebral artery in dependency of gestational age. Mean values and standard deviation. Vs peak systolic flow velocity, V es end-systolic flow velocity, V ed end-diastolic flow velocity, TAV time average velocity, TAMX time average maximal velocity
Graphic 2.2
Normal values of the flow velocities in the basilar artery in dependency of gestational age. Mean values and standard deviation. V s peak systolic flow velocity, V es end-systolic flow velocity, V ed end-diastolic flow velocity, TAV time average velocity, TAMX time average maximal velocity
Graphic 2.3
Normal values of the flow velocities in the internal carotid. artery in dependency of gestational age. Mean values and standard deviation. V s peak systolic flow velocity, V es end-systolic flow velocity, V ed end-diastolic flow velocity, TAV time average velocity, TAMX time average maximal velocity
There are no significant differences of the flow velocities of a single patient within the anterior and basilar artery. Peak systolic flow velocities (V s) in the internal carotid artery are about 20 % higher than in the anterior cerebral and basilar artery.
V es and V ed however are not significantly different in the three arteries.
Mean flow velocities (TAV and TAMX) however are different in each single artery. They are highest within the internal carotid artery and lowest in the basilar artery. Time average velocity (TAV) is 8 % higher in the anterior cerebral artery than in the basilar artery which is 8 % lower than in the internal carotid artery.
Time average maximal velocity (TAMX) is 11 % higher in the anterior cerebral artery and 16 % higher in the internal carotid artery than in the basilar artery (Table 2.1).
ICA | ACA | BA | |
|---|---|---|---|
n | 121 | 121 | 121 |
Gestational age (weeks) | 37.1 ± 3.1 | 37.1 ± 3.1 | 37.1 ± 3.1 |
Weight (g) | 2,190 ± 590 | 2,190 ± 590 | 2,200 ± 590 |
V s (cm/s) | 50 ± 15 | 42 ± 15 | 41 ± 16 |
V es (cm/s) | 19 ± 7 | 19 ± 8 | 18 ± 7 |
V ed (cm/s) | 11 ± 4 | 11 ± 5 | 11 ± 4 |
TAV (cm/s) | 14 ± 4 | 13 ± 5 | 12 ± 5 |
TAMX (cm/s) | 22 ± 6 | 21 ± 9 | 19 ± 7 |
RI | 0.77 ± 0.08 | 0.73 ± 0.08 | 0.72 ± 0.09 |
PI | 3.0 ± 0.8 | 2.7 ± 0.9 | 2.7 ± 0.7 |
2.2.6.2 Dependency of the Flow Velocities on Weight
Another factor that influences the flow velocities in intracranial arteries is the weight of the patient. Increasing weight causes an increase of the flow velocities. The highest values can be found in the internal carotid arteries, the lowest in the basilar artery.
The dependencies of the flow velocities in the different arteries on the weight are shown in the Graphic illustrations 2.4, 2.5, and 2.6.


Graphic 2.4
Normal values of the flow velocities in the anterior cerebral artery in dependency of weight. Mean values and standard deviation. V s peak systolic flow velocity, V es end-systolic flow velocity, V ed end-diastolic flow velocity, TAV time average velocity, TAMX time average maximal velocity
Graphic 2.5
Normal values of the flow velocities in the basilar artery in dependency of weight. Mean values and standard deviation. V s peak systolic flow velocity, V es end-systolic flow velocity, V ed end-diastolic flow velocity, TAV time average velocity, TAMX time average maximal velocity
Graphic 2.6
Normal values of the flow velocities in the internal carotid artery in dependency of weight. Mean values and standard deviation. V s peak systolic flow velocity, V es end-systolic flow velocity, V ed end-diastolic flow velocity, TAV time average velocity, TAMX time average maximal velocity
Comparison of the age dependency with the dependency on weight showed a much better correlation with age (Deeg 1989a, b). Positive correlation with weight is caused by an increase of weight with increasing age. As correlation with age is better than with weight, normal values in relation to age should be used.
2.2.6.3 Dependency of Resistive and Pulsatility Indices on Age and Weight
In contrast to the flow velocities, the resistive and the pulsatility indices are independent on age and weight. As peak systolic flow velocities and end-diastolic flow velocities increase simultaneously, the quotient does not change. Mean values and standard deviation of the indices are listed in Table 2.1. As the peak systolic flow velocity is higher in the internal carotid artery than in the anterior cerebral and basilar artery, the indices are also higher in the ICA.
The indices are independent on the angle of incidence. They can therefore be measured with continuous wave Doppler instruments too. A possible mistake in measurement of the angle eliminates automatically as it appears in the numerator and denominator of the quotient.
A comparison of our values for the resistive index with other published values shows good correlations (Table 2.2).
Clinical Value of the Flow Parameters
Neither the calculation of the resistive index or pulsatility index nor the measurement of flow velocities allows the measurement of brain perfusion. For clinical questions, however, the measurement of flow velocities is helpful. An increase or decrease of the flow velocities corresponds with an increase or decrease of brain perfusion as investigations by Greisen with Xenon-133 clearance and investigations by Hansen using microspheres have shown (Greisen et al. 1984; Hansen et al. 1984).
For the clinician a decrease of the flow velocities (especially the time average velocity) corresponds with a decrease of brain perfusion. This conclusion however is only right for the artery where the measurement was performed. Brain perfusion as a whole can be concluded if measurements are performed in both internal carotid arteries and the basilar artery. As the diameter of these arteries does not change, simultaneous decrease of the flow velocities in both internal carotid arteries and the basilar artery means a decrease of brain perfusion.
The interpretation of an increase of the flow velocities is more difficult. Different causes may lead to an increase: Besides an increase in blood pressure and cardiac output, stenosis in brain arteries or local compression in patients with brain swelling may be the reason. Failing autoregulation of brain perfusion in immature preterm infants may transmit fluctuations of blood pressure directly to the brain. In patients with normal intracranial pressure, an increase of the flow velocities can be interpreted as an increase in volume flow and perfusion.
An increase of the flow velocities can be caused by a reduction in vessel diameter. According to the haemodynamic law of Bernoulli, within a stenosis an increase of the flow velocities can be found. Within a wide range the decrease of the diameter is compensated by an increase of the flow velocities. Volume flow keeps constant. If the diameter further decreases (90 % stenosis), volume flow may fall, although the flow velocity increases.
Theoretically the volume flow Q can be calculated by the following equation:

Q is the volume flow in mm3/s (or ml/s).
A is the cross-sectional area of the vessel in mm2.
TAV is the time average flow velocity measured in m/s.
TAV can be measured by Doppler sonography. Theoretically A can be estimated from the diameter d of the vessel according to the following equation: A = (d/2)2 × π.
Unfortunately the diameter of the small intracranial arteries cannot be measured exactly. Therefore, Q cannot be calculated for sure. The diameters of the intracranial arteries in which the flow measurements are performed do not change significantly during physiologic and pathologic situations. Assuming a constant vessel diameter, volume flow Q is proportional to changes of TAV. Under most physiologic and pathologic situations, the vessel diameter does not change. From changes of TAV, changes of volume flow and possible perfusion can be concluded.
As flow velocities are dependent on age and weight, judgement of pathologic values is very difficult. If pathologic flow is judged, weight and age of the patient have to be taken into consideration.
Using resistive and pulsatility indices, these difficulties do not exist. Resistive and pulsatility indices are independent on age and weight. The constancy of these parameters seems to be an important advantage. As both indices are quotients, different alterations in numerator and denominator may lead to the same alterations of the index: An increase of the resistive index may be caused by an increase of the peak systolic flow velocity or a decrease of the end-diastolic flow velocity.
Assuming a constant vessel diameter, time average velocity and volume flow would increase in the first case and decrease in the second case.
Therefore the estimation of flow velocities has to be preferred to the quantification of the resistive or pulsatility index (Van de Bor and Walther 1991). Age and weight of the patients however have to be kept in mind.
The advantage of the resistive and pulsatility indices is that they are independent on the angle of incidence. They can therefore be quantified by CW Doppler too. They can also be measured by not experienced investigators. Possible failures in the estimation of the angle of incidence appear in the numerator and denominator of the quotient and can be cancelled.
Clear clinical questions, however, such as the interpretation of an increased intracranial pressure or the haemodynamic relevance of a patent ductus arteriosus Botalli, can be judged by the resistive index too.
Conclusion
The flow velocities in the intracranial arteries increase with gestational age, actual age and weight till the age of 6 years. Afterwards flow velocities slowly decrease till adolescence.
The increase is nearly linear in all larger intracranial arteries in neonatology and early infancy. Peak systolic and time average velocities are 10–20 % higher in the internal carotid arteries than in other large intracranial arteries. End-systolic and end-diastolic flow velocities are not significantly different in the other intracranial arteries.
In contrast to the flow velocities, the resistive indices and the pulsatility indices are independent of age and weight. Differences exist only within the different arteries.
2.3 Normal Anatomy of the Cerebral Veins
Most cerebral veins can be shown in sagittal and coronal sections through the anterior fontanelle by colour Doppler sonography as well as by sections through the mastoid fontanelle.
2.3.1 Sagittal Sections
The following veins can be shown in sagittal sections by colour-coded Doppler sonography: superior sagittal sinus, inferior sagittal sinus, straight sinus, internal cerebral vein and vein of Galen.
The superior sagittal sinus (SSS) can be displayed just beneath the fontanelle with high-resolution linear transducers of 10–14 MHz (Fig. 2.12a–c). Power Doppler shows the multiple feeding veins which supply the superior sagittal sinus (Fig. 2.12c, d, e). Due to the low flow velocities and high angle of incidence, sensitive flow settings with a low Nyquist limit have to be chosen. With sector transducers the flow in the occipital part of the SSS can be shown (Fig. 2.12f). Spectral Doppler shows continuous flow sometimes with alterations of the flow amplitude due to the pulse cycle and respiratory movements (Fig. 2.12g, h). As the angle of incidence is very high, flow velocities cannot be calculated.


Fig. 2.12
Graphic illustration of the great cerebral veins: CS confluens sinuum, CV cortical veins, IJV internal jugular vein, ISS inferior sagittal sinus, LS lateral sinus, SR straight sinus, SSS superior sagittal sinus, SS sigmoid sinus, VCI vena cerebri interna, VGM vena Galeni magna (Drawing by Blankvisual, Thun, Switzerland). (a–d) Colour Doppler sonography (a, b) and power Doppler (c–e) of the flow in the superior sagittal sinus and its tributaries (high-resolution linear transducer of 13 and 15 MHz). Despite of the bad angle of incidence, flow in the superior sagittal sinus and its tributaries can clearly be displayed. Low flow settings with low wall filter and low Nyquist limits have to be chosen. (f) Colour Doppler of the flow in the superior sagittal sinus in median sagittal sections. The flow is displayed blue as it is directed away from the transducer. The angle of incidence is low that makes measurement of flow velocities possible. (g, h) Pulsed Doppler recording of the flow in the superior sagittal sinus. The Doppler recording shows typical venous flow profile influenced by the cardiac cycle and by respiration. As the angle of incidence is unfavourable the flow indices can’t be quantified
The inferior sagittal sinus runs parallel to the superior sagittal sinus just above the corpus callosum together with the pericallosal artery (Fig. 2.13a, b). Colour Doppler displays the flow in the artery and the sinus blue (Fig. 2.13a, b). A differentiation between the artery and vein is only possible by spectral Doppler (Fig. 2.13c–e). As the flow is directed away from the transducer, the arterial flow curve as well as the venous flow curve are displayed below the baseline. Beneath the splenium corporis callosi, the vena Galeni magna is formed by the confluence of both internal cerebral veins with the basal veins of Rosenthal (Fig. 2.14).


Fig. 2.13
(a, b) Colour Doppler of the flow in the internal cerebral vein (VCI) and the inferior sagittal sinus (SSI). Above the splenium corporis callosi (SCC), the inferior sagittal sinus (SSI) is displayed blue. SS straight sinus. (c, d) Pulsed Doppler recording of the flow in the internal cerebral vein (ACA anterior cerebral artery, PCA pericallosal artery, SSI inferior sagittal sinus, VCI internal cerebral vein). (e) Pulsed Doppler of the flow in the pericallosal artery which runs adjacent to the inferior sagittal sinus around the corpus callosum. Only pulsed Doppler (and not colour Doppler) can distinguish between the vein and the artery
Posterior to the splenium of the corpus callosum, the vein of Galen and the inferior sagittal sinus flow into each other and form the straight sinus (Fig. 2.14b, c). From the internal cerebral veins to the straight sinus, the flow velocities increase (Fig. 2.14d–f). The flow profile may be continuous or show respiratory changes and changes due to the contractions of the right heart (Fig. 2.14f).


Fig. 2.14
(a) Magnet resonance angiogram of the venous drainage in median sagittal sections. SR straight sinus, SSS superior sagittal sinus, VCI internal cerebral vein, VG vein of Galen. (b, c) Colour Doppler of the flow in the internal cerebral vein (VCI), vein of Galen (VG) and the straight sinus (SR). C vermis cerebelli, 3 3rd ventricle. (d) Pulsed Doppler sonographic flow measurement in the internal cerebral vein shows continuous flow with a peak flow velocity of 10 cm/s. (e, f) Pulsed Doppler sonographic flow measurement in the straight sinus just behind the cerebellar vermis
The straight sinus runs in the midline above and posterior of the vermis cerebelli within the tentorium cerebelli.
The straight sinus ends at the occipital bone where the straight sinus flows together with the superior sagittal sinus and both transverse sinuses to form the confluence of the sinuses.
2.3.2 Coronal Sections
Coronal sections are important for the display of the deep venous drainage. The deep venous drainage runs over both internal cerebral veins. The internal cerebral veins drain the basal ganglia, the choroid plexus and the periventricular white matter (Fig. 2.15a).
The internal cerebral veins (VCI) can be shown in coronal sections angled posteriorly just beneath the midline (Fig. 2.15a–c). As lateral resolution is bad, it is not always possible to differentiate the left from the right internal cerebral vein. If the patient has a cavum vergae, both VCI can easier be differentiated (Fig. 2.15c). In the VCI a continuous flow with a broad flow spectrum and low flow velocities below 10 cm/s can be shown (Fig. 2.15d–f). In the neonatal period, the time average flow velocity varies between 3 and 3.5 cm/s (Taylor 1992a). Both VCI are formed by the confluence of the terminal veins, the choroidal veins and both lenticulostriatic veins. If the transducer is angled more posteriorly in the midline, the straight sinus can be shown by colour Doppler and measured by spectral Doppler (Fig. 2.15g). Spectral Doppler shows a continuous flow with a broad flow spectrum and flow velocities between 10 and 20 cm/s.


Fig. 2.15
(a) Magnet resonance angiography of the flow in the internal cerebral veins (VCI) in an axial section. (b, c) Colour Doppler of both internal cerebral veins (VCI) in a plane angled posteriorly. (d–f) Pulsed Doppler recordings of the flow in the internal cerebral veins. The peak flow velocities range from 5 to 10 cm/s. VCA li internal cerebral vein of the left side, VCA re internal cerebral vein of the right side. The flow velocities in both internal cerebral veins do not differ significantly. (g) Pulsed Doppler recording of the flow in the straight sinus (coronal section tilted posteriorly). Peak flow velocity of 20 cm/s
The terminal veins can be shown in coronal sections with high-resolution transducers of 7 MHz or greater. Ideally 13 MHz linear transducers are used (Fig. 2.16a–d). The terminal veins are displayed at the floor of the lateral ventricles (Fig. 2.16a–d). They drain the cerebral white matter by the way of multiple medullary veins (Fig. 2.16h). Other possibilities of medullary drainage are the subependymal veins which run in the roof of the lateral ventricles (Fig. 2.16h). In the terminal veins a continuous flow with broad flow spectrum and flow velocities between 2 and 4 cm/s can be shown (Fig. 2.16e–g).


Fig. 2.16
(a, b) Colour (a) and power Doppler (b) of the flow in the terminal veins (expanded coronal section through the body of both ventricles). The terminal veins (VT) run at the bottom of the frontal horns of both lateral ventricles (LV). (c, d) Colour Doppler of the flow in the terminal (VT) and subependymal veins (SEV). AP pericallosal artery, ATS thalamostriatic artery, VCI internal cerebral vein. (e–g) Pulsed Doppler of the flow in the terminal vein. Spectral Doppler shows a bandlike continuous forward flow with flow velocities between 2 and 4 cm/s. (h) High-resolution image of the flow in the medullary veins (MV) drained by the terminal veins (VT) at the bottom of the lateral ventricle and the subependymal veins (SV) at the roof of the lateral ventricle. The course of the medullary veins is trapezoidal
The choroidal veins and the lenticulostriatic veins can be shown laterally to the internal cerebral veins.
In posterior coronal sections the vein of Galen and the straight sinus can be shown in the midline. As the angle of incidence approximates zero, flow velocities can be measured (Fig. 2.15g).
With high-resolution linear transducers, the superior sagittal sinus can be shown in coronal sections as a triangular structure between both hemispheres (Fig. 2.17a). Colour-coded Doppler sonography reveals blood flow within the sinus (Fig. 2.17b–d). Due to a bad angle of incidence, flow velocities cannot be measured in coronal sections.


Fig. 2.17
(a) Coronal scan through the surface of the brain. The superior sagittal sinus is displayed as a triangular structure (asteris ks) just beneath the fontanelle. (b–d) Colour imaging of the flow within the superior sagittal sinus in coronal sections
In coronal sections tilted posteriorly, the transverse sinuses can be shown at the insertion of the tentorium cerebelli with the occipital bone (Fig. 2.18a). Pulsed Doppler shows a continuous flow with respiratory and cardiac modulation of the flow profile (Fig. 2.18b). As the angle of incidence is unfavourable, flow velocities cannot be measured.
The sinus cavernosus can be shown in middle coronal sections lateral to the basilar artery in the region of the internal carotid arteries (Fig. 2.18c). As the flow is directed away from the transducer, it is displayed blue (Fig. 2.18c). Spectral Doppler shows the flow profile below the baseline (Fig. 2.18d, e).


Fig. 2.18
(a) Coronal section tilted posteriorly shows both transverse sinuses at the lateral borders of both cerebellar hemispheres within the insertion of the cerebellar tentorium. (b) Pulsed Doppler of the flow in the transverse sinus. (c) Colour Doppler of the flow in the cavernous sinus in a coronal section tilted posteriorly. The flow in the sinus is displayed blue. BA basilar artery, SC sinus cavernosus. (d, e) Pulsed Doppler of the flow in the cavernous sinus in a coronal section angled posteriorly. The flow is displayed below the baseline. (f) Pulsed Doppler recording of the flow in the cavernous sinus in a sagittal section through the midline. The sinus is displayed to the right internal carotid artery. The flow is displayed below the baseline
2.3.3 Axial Sections
Axial sections through the mastoid fontanelle are helpful for visualisation and the determination of flow within the transverse sinuses (Buckley et al. 1997). 2D images show an echo-free area between the skin and the cerebellar hemisphere (Fig. 2.19a). With colour Doppler the flow within the transverse sinus can easily be shown (Fig. 2.19b). Spectral Doppler reveals a venous flow, with a broad flow spectrum. Fluctuations of the amplitude are caused by the atrial contractions and respiratory movements (Fig. 2.19c). Due to a bad angle of incidence, flow velocities should not be quantified.


Fig. 2.19
Imaging and flow measurements in the transverse sinus through the mastoid fontanelle. (a) Axial section shows an echo-free area between the skin, the occipital brain (OB) and the cerebellar hemispheres (C), the transverse sinus (arrows). (b) Colour Doppler of the flow in the transverse sinus (LS); C cerebellar hemisphere. (c) Pulsed Doppler recording of the flow within the transverse sinus. High flow velocities with a peak flow velocity of 50 cm/s
2.3.4 Flow Measurements and Normal Values
All large intracranial sinuses and most internal cerebral veins can be displayed by colour Doppler. If the angle of incidence is small, flow can be measured by spectral Doppler. For the quantification of flow, flow velocities should be measured. Velocities can only be quantified if the angle of incidence is below 30º. Due to a small angle of incidence, flow velocities can be measured in the following veins:
Sagittal section: superior sagittal sinus (occipital region), inferior sagittal sinus, internal cerebral veins and straight sinus
Coronal section: terminal vein, internal cerebral vein, vein of Galen and straight sinus
Three main flow velocity patterns could be observed by Winkler and Helmke (1989): bandlike (straight sinus 25 %, vein of Galen 59 % and basilar veins 63 %); sinusoid, synchronous with the arterial pulse (straight sinus 46 %, vein of Galen 27 % and basilar veins 29 %); and intermittent zero flow (straight sinus 3 %, vein of Galen 0 %, basilar veins 0 %) (Winkler and Helmke 1989).
In the majority of the smaller cerebral veins, a continuous flow with a broad flow spectrum can be found (Figs. 2.13c, d, 2.14d, e, 2.15d–g and 2.16e–g). In the small veins, no significant changes of the amplitude occur, whereas in the greater veins and within the sinuses, a sinusoid flow pattern with changes of the amplitude is typical (Figs. 2.12g, 2.13c, 2.14f, 2.18b, d–f and 2.19c). The sinusoid flow pattern is caused by either the changes of the venous pressure, the respiratory movements or the arterial pulse of adjacent arteries.
From the flow curve the peak and the time average flow velocities can be measured. The flow velocities in preterm infants are lower than in infants with a gestational age of 40 weeks. The flow velocities of cortical and subependymal veins are lowest, whereas the flow velocities in the greater veins and especially the sinuses are higher. Only few normal values of the flow velocities in the cerebral veins have been published in literature (Bezinque et al. 1995; Couture 2001a, b; Fenton et al. 1991; Pfannschmidt and Jorch 1989; Schneider 2004; Taylor 1992a, b; Winkler and Helmke 1989).
The highest peak flow velocities were measured in the superior sagittal sinus, the lowest in the terminal veins.
Bezinque et al. measured the flow in the superior sagittal sinus. They found higher values in term neonates (16.9 ± 17.3 cm/s) than in preterm infants (12.9 ± 10.5 cm/s) (Bezinque et al. 1995).
In the straight sinus, Winkler and Helmke (1989) found an average peak velocity of 13.2 cm/s, whereas Pfannschmidt and Jorch et al. (1989) measured 12.6 ± 7.8 cm/s.
In the great vein of Galen, peak flow velocities between 2.3 and 9.5 cm/s were measured (Fenton et al. 1991).
Couture measured the peak flow velocities in the internal cerebral veins:
The flow velocities in the terminal veins were measured by Schneider in preterm infants with a gestational age of 29 weeks and 36 weeks: The average peak velocity was 3.2 cm/s and 4.6 cm/s, respectively (Schneider 2004).
Time average flow velocities were published by Taylor (1992a, b). They are summarised in Table 2.3. The lowest values were found in the subependymal veins with 3 cm/s, the highest values in the superior sagittal sinus with 9.2 cm/s (Table 2.3) (Taylor 1992a, b).
Table 2.3
Time average flow velocities within the intracranial veins (according to Taylor)
Vein
Time average flow velocity (cm/s)
Right subependymal vein
3.0 ± 0.3
Left subependymal vein
3.0 ± 0.3
Right internal cerebral vein
3.4 ± 0.2
Left internal cerebral vein
3.2 ± 0.3
Inferior sagittal sinus
3.5 ± 0.3
Great vein of Galen
4.3 ± 0.7
Straight sinus
5.9 ± 1.0
Superior sagittal sinus
9.2 ± 1.1
2.4 Intracranial Haemorrhage
Intracranial haemorrhage is one of the most frequent pathologies of the brain in infants. It occurs more often in preterm infants than in term babies or older infants. Four main forms of haemorrhage can be distinguished:
Intracranial haemorrhage of preterm infants
Subdural and epidural haemorrhage
Subarachnoid haemorrhage
Subarachnoid haemorrhage
2.4.1 Intracranial Haemorrhage of Preterm Infants
Advances in modern neonatology have caused the survival of more and more preterm infants. Today even preterm infants, older than 22 or 23 weeks of gestation, can survive. However, many of extremely preterm babies suffer from intracranial haemorrhage and may be more or less severely neurologically handicapped.
Anatomical Background
The high incidence of intracranial haemorrhage is caused by some characteristics of the germinal matrix, an immature, metabolically highly active, and richly vascularised layer of neuroepithelial cells. The germinal matrix is very prominent between the 20th and 32nd gestational weeks. After the 30th gestational week, the germinal matrix begins to involute.
The proliferating neuroepithelial cells of the germinal matrix are localised in the lateral wall of side ventricles behind the foramen of Monro, lateral to the choroid plexus between the developing head of the caudate nucleus and the thalamus. The germinal matrix is metabolically highly active. The vessels which supply the germinal matrix are very prominent between the 22nd and 32nd weeks of gestation. The germinal matrix is perfused by a branch of the anterior cerebral artery, the Heubner’s artery, and small side branches of the lenticulostriate arteries. These vessels can be displayed by CCD in sagittal and coronal sections (Fig. 2.21). The size of Heubner’s artery indicates that a major quantity of blood flow from the anterior cerebral artery is determined for the perfusion of the metabolic active periventricular germinal matrix. After the 32nd week of gestation, involution of these vessels occurs simultaneously with involution of the germinal matrix.
The arterial network of the germinal matrix has special anatomical features: The vessels of the germinal matrix have a greater diameter, thinner walls, less defined basement membranes and less perivascular support than arteries of other brain regions (Gould et al. 1987; Ment 1995; Sotrel and Lorenzo 1989; Trommer et al. 1987).
Arterioles arising from Heubner’s artery, terminal branches of the lateral striate arteries and callosal penetrating arteries supply a capillary network and join a small vein. Some authors have reported arteriolar-to-venous shunts or arteriolar-to-arteriolar anastomoses (Nakamura et al. 1991; Pape and Wigglesworth 1979) without insertion of capillaries. Changes in blood pressure are directly transmitted to the venous drainage causing rupture of the small veins and subependymal haemorrhage which may rupture into the ventricle.
Frequency of Intracranial Haemorrhage
In dependency on the gestational age of the investigated preterm infants, intracranial haemorrhage could be found in 30–50 % of all investigated patients (Kirks et al. 1986). In older series of 742 infants born before the 32nd week of gestation, Kirks et al. found intracranial haemorrhages in 44 %. In 20 % grade I, in 10 % grade II, in 7 % grade III and in 7 % grade IV (classification of Papile) could be found (Kirks et al. 1986). Nowadays the frequency of intracranial haemorrhage is lower. Severe intracranial haemorrhage occurs more frequently in very immature babies with severe asphyxia born before 28th week of gestation with a birth weight under 1,000 g (Volpe 2008).
Time of Haemorrhage
Most intracranial haemorrhages (90 %) occur within the first 72 h of life. Fifty percent are diagnosed on the first day and 25 % on the second, and another 15 % are found on the third day (Szymonowicz and Yu 1984; Volpe 2008).
As 90 % of all intracranial haemorrhages occur within the first 72 h of life, the first sonographic investigation should be performed within the first and third day of life (Deeg 2005a). The first investigation should be performed as early as possible to distinguish prenatal from postnatal lesions. For forensic reasons this investigation should be performed and documented within the first day of life.
The second investigation should be performed after the vulnerable phase in which most bleedings occur, at the third day of life.
The third investigation should be performed at the end of the first week of life, to detect late bleedings and to evaluate beginning posthaemorrhagic ventricular dilatation. In special cases additional investigations can be performed, especially if the patient deteriorates or severe haemorrhage is diagnosed.
Pathophysiology
About 80–90 % of all intraventricular haemorrhages of preterm infants arise from the richly vascularised periventricular germinal matrix. As mentioned above the germinal matrix has relatively large vessels with only one endothelial layer. This makes them especially vulnerable to changes in blood pressure, acidosis, coagulation disorders, rapid volume expansion and especially hypoxaemic-ischaemic injury.
Possible mechanical causes are compression of the large draining sinuses and stretching of the capillaries during reanimation. Other reasons for the high incidence of intracranial haemorrhages are an increase of intracranial perfusion during apnoea (increase of pCO2 and decrease of pO2) and pneumothorax (increase of pCO2 and venous pressure), during endo-tracheal suction and rapid volume expansion. All these factors can cause rupture of the fragile capillaries and lead to intracranial haemorrhage.
A decrease of systemic blood pressure and cardiac output during longer-lasting arterial hypotension associated with asphyxia may cause a dramatic decrease of intracranial blood flow. This may cause ischaemic damage of the metabolic highly active periventricular germinal matrix.
On the other hand, many hypertensive crises during reperfusion (correction of acidosis and hypoxia) cause an increase of brain perfusion and rupture of intracranial arteries.
The main risk factors for the development of intracranial haemorrhage besides immaturity and asphyxia are hypo- or hyperperfusion of the brain and especially of the germinal matrix.
Most of the risk factors mentioned in Table 2.4 can lead to hypo- or hyperperfusion of the brain which can be measured by Doppler sonography. Hypoperfusion may cause ischaemic injury. Hyperperfusion later may cause rupture of the previously injured vessels of the germinal matrix.
Table 2.4
Possible risk factors for the development of intracranial haemorrhage
Prematurity (≤28 weeks) |
Low birth weight (<1,000 g) |
Immature vascular bed of the periventricular germinal matrix |
Asphyxia/ischaemia |
Hypercapnia/hypocapnia |
Missing autoregulation of brain perfusion (blood pressure-passive brain circulation) |
Decreased brain perfusion |
Low blood pressure |
Hypocapnia |
Low flow velocities in brain arteries |
Increased brain perfusion |
High blood pressure |
Rapid volume expansion |
Exchange transfusion |
Ligature of ductus |
Hypercapnia |
Pneumothorax (increased pCO2 and venous pressure) |
Endotracheal suctioning |
Cerebral seizures |
Longer handling of patient |
Increase venous pressure |
Difficult vaginal breech delivery |
Pneumothorax |
Problems with ventilation (obstruction of ventilation tube, increased PEEP, etc.) |
Asphyxia |
Coagulation disorders |
Fluctuating brain perfusion |
Breathing against ventilator |
Course of Intraventricular Haemorrhage
Eighty percent of all intracerebral haemorrhages rupture from the periventricular germinal matrix into the lateral ventricles. From the lateral ventricles, blood clots spread to the third and fourth ventricles and from there through the foramina of Luschka and Magendie into the occipital subarachnoid space. Within days or weeks, obliterative fibrosing arachnoiditis may develop which may cause posthaemorrhagic hydrocephalus (Volpe 2008).
In 15–25 % of all bleedings, the haemorrhage is complicated by haemorrhagic infarction of the brain parenchyma. The haemorrhagic infarction is located laterally to the side ventricle. Haemorrhagic infarction is usually associated with severe intraventricular haemorrhage on the same side. Haemorrhage to the brain parenchyma is not merely an expansion of blood from the ventricular space to the parenchyma as initially thought (Papile et al. 1978). Large amounts of intraventricular blood may compress the draining veins at the roof and bottom of the lateral ventricle. This causes obstruction of the drainage of the medullary veins, which form the terminal vein at the bottom of the lateral ventricle (Taylor 1995). The result is a haemorrhagic infarction within the corresponding cerebral hemisphere (see later).
2D Image
Ultrasonography of the brain is the imaging modality of choice for the diagnosis of intracranial haemorrhage (Deeg 2005a). Haemorrhage appears as increased echogenicity within the germinal matrix, the ventricular space and possibly in the parenchyma of the brain (Fig. 2.20). The physical basis for the echodense structure of intracranial bleeding is the dense network of fibrin mesh that reflects ultrasound (Volpe 2008).

Fig. 2.20
(a) Intracranial haemorrhage grade I: parasagittal section through the lateral ventricle and the germinal matrix. Blood clots in the region of the head of the nucleus caudatus and the germinal matrix. NC head of caudate nucleus, T thalamus. (b) Intracranial haemorrhage grade II in a premature girl of 25 weeks of gestation and a birth weight of 650 g: parasagittal section through the lateral ventricle. Blood clots fill 30–40 % of the lateral ventricle. (c, d) Intracranial haemorrhage grade III: parasagittal section through the lateral ventricle. Blood clots fill nearly the complete lateral ventricle. (e) Severe intracranial haemorrhage. Coronal section: The frontal horn on the left side of the image shows normal width without blood clots. The other ventricle is dilated and completely filled with blood clots. The blood in the ventricle compresses the terminal vein, which runs at the bottom of the lateral ventricle
Intracranial bleedings of premature babies can be categorised according to the location and amount of blood within the brain. Since the first report about the classification of ICH by Lu Ann Papile, a lot of other classifications have been described (Papile et al. 1978). All of these classifications are similar although they differ in some important parts. In our point of view, the grading system of Volpe and the suggestion of the paediatric section of the DEGUM are the best (Deeg et al. 1999a, b; Volpe 2008). They differentiate three grades of severity:
Grade I: germinal matrix haemorrhage
Grade II: small intraventricular haemorrhage which fills <50 % of the ventricular space
Grade III: severe intraventricular haemorrhage which fills >50 % of the ventricular space
This classification differs from the initial classification of Lu Ann Papile, which is most frequently used worldwide, in some points:
It does not include haemorrhage within the brain parenchyma (grade IV of Papile’s classification) and ventricular dilatation (a characteristic of grade III in Papile’s classification).
As ventricular dilatation and posthaemorrhagic hydrocephalus are consequences of severe intracranial bleeding, the classification of Volpe and the DEGUM does not include this in their grading system (Deeg et al. 1999a, b; Volpe 2008).
Parenchymal haemorrhage is not a simple extension of blood from the ventricular space to the parenchyma as Papile thought. It is a venous infarction which is caused by a blockade of the terminal veins at the bottom of the lateral ventricles and the subependymal veins at the roof of the ventricle. This causes a cessation of the outflow from the medullary veins and leads to a haemorrhagic infarction (see later).
As mentioned earlier, 90 % of all bleedings originate from the germinal matrix. If the bleeding does not rupture through the ependymal walls and is confined to the germinal matrix, it is classified as grade I haemorrhage (Fig. 2.20a).
Grade I haemorrhages may rupture through the ependymal walls. If blood empties into the lateral ventricles, it may cause moderate (grade II) or severe (grade III) intraventricular haemorrhage.
If less than 50 % of ventricular space is filled with blood clots, grade II is diagnosed (Fig. 2.20b).
If more than 50 % of the ventricular space is filled with blood, grade III is diagnosed (Fig. 2.20c–e).
Parenchymal haemorrhage is an own category, more similar to periventricular leucomalacia than to intraventricular haemorrhage (see Sect. 2.4.2).
Doppler Sonography
Most haemorrhages originate from the germinal matrix which is supplied by small branches of the anterior cerebral and the middle cerebral artery. From the anterior cerebral artery the Heubner’s artery and from the middle cerebral artery lenticulostriatic branches and choroidal branches originate. With colour-coded Doppler sonography, these arteries can be displayed in parasagittal and coronal sections (Fig. 2.21a–d). With spectral Doppler flow velocities can be measured (Fig. 2.21e, f). Perfusion changes in these arteries may cause intracranial haemorrhage. Therefore, flow measurements in the anterior or middle cerebral artery or their branches should be performed to study the evolution of intracranial haemorrhage.


Fig. 2.21
(a) Colour-coded Doppler sonography of the perfusion of the germinal matrix. The parasagittal section shows the anterior cerebral artery (ACA) and a branch of the ACA, the Heubner’s artery (HA), which perfuses the germinal matrix. Besides HA perfusion of the germinal matrix runs by the lenticulostriatic artery (LSA), a branch of the middle cerebral artery. ICA internal cerebral artery. (b, c) Colour-coded Doppler sonography of the thalamostriatic arteries (parasagittal sections through the basal ganglia in two premature-born infants). (d) Colour Doppler of the flow within Heubner’s artery (HA) in a parasagittal section. SC cavernous sinus, ICA internal carotid artery. (e, f) Measurement of flow within Heubner’s artery. The Doppler spectrum shows a pulsatile flow with very low flow velocities, a long acceleration time and a low acceleration slope
Risk Factor: Low Blood Flow Velocities
We found very low flow velocities in the anterior cerebral artery to be a major risk factor for the development of severe intracranial haemorrhage (Deeg et al. 1990a, b). Low birth weight infants with very low flow velocities at the initial investigation developed significantly more often severe intracranial haemorrhage (grade III or haemorrhagic infarction) than infants with higher flow velocities (Deeg et al. 1990a, b) (Fig. 2.22) (Table 2.5).


Fig. 2.22
(a) Flow measurement in the anterior cerebral artery of an infant born with a birth weight of 600 g. Very low flow velocities (peak systolic flow velocity 11 cm/s) and missing end-diastolic flow. (b) Flow measurement in the anterior cerebral artery of preterm infant with intracranial haemorrhage. Very low flow velocities (peak systolic flow velocity 15 cm/s)
Other authors found that an ‘end-diastolic block’ in cerebral circulation may predict intraventricular haemorrhage in hypotensive extremely low birth weight infants (Julkunen et al. 2008). They found that infants with an absent diastolic flow and an associated low mean arterial pressure (MAP) <30 mmHg developed more often intraventricular haemorrhage than in infants with MAP >30 mmHg. Absent diastolic flow was due to a haemodynamic-relevant ductus arteriosus Botalli. The authors conclude that an end-diastolic block in the cerebral circulation, together with a MAP of ≤30 mmHg or less and the presence of PDA during the first 4 days of life, might be associated with IVH in extremely low birth weight infants (Julkunen et al. 2008).
Low flow velocities may lead to low perfusion of the germinal matrix and cause ischaemic injury. During reperfusion high velocities and perfusion may occur. Especially during manipulation (endotracheal suction, etc.), hypoxaemic-ischaemic injured arteries may rupture and cause intracranial haemorrhage.
The demonstration of low flow velocities may be a significant risk factor for the development of severe intracranial haemorrhage (Table 2.5). Therefore routine measurement of blood flow velocities in the anterior cerebral arteries after birth is recommended to detect patients at risk for the development of ICH. As low pCO2 levels cause a further reduction of the flow velocities, hypocapnia should be avoided. We recommend a pCO2 level of ventilated preterm infants at the upper normal range of 45 mmHg to prevent an iatrogenic fall of brain perfusion.
After intracranial haemorrhage a significant further decrease of the flow velocities could be shown (Fig. 2.23). This may be caused by intravascular blood loss and a temporarily increase of intracranial pressure.

Fig. 2.23
Graphic illustration of the flow velocities within the anterior cerebral artery of a premature infant. Very low flow velocities initially. Normalisation of the flow velocities till day 3. A second asphyxiated event on day 3 caused a dramatic decrease of the flow velocities. After the second asphyxia, severe haemorrhage occurred. V s peak systolic flow velocity, V es end-systolic flow velocity, V ed end-diastolic flow velocity, TAMX time average maximal flow velocity, TAV time average flow velocity (From Deeg 2005b)
Severe intracranial haemorrhage may lead to a significant reduction of intravascular volume and cardiac output. Due to missing autoregulation of brain perfusion, perfusion may fall under a critical limit and cause further ischaemic lesions. Using Xe-133 clearance or positron emission tomography (PET), Lou and Volpe could show that low cerebral perfusion is a risk factor for the development of intracranial haemorrhage (Lou et al. 1979; Volpe et al. 1983). In mature newborns who suffered from severe intracranial hemorrhage significant lower flow velocities could be found in comparison with a healthy control group (Table 2.6).
Risk Factor: Missing Autoregulation
Immature preterm infants born with a gestational age of 30 weeks or younger are not able to regulate their brain perfusion such as older infants or adults. These patients cannot maintain a stable cerebral perfusion over a large range of blood pressure. Typical is a pressure-passive cerebral circulation. If blood pressure increases, flow velocities simultaneously increase which causes an increase of blood flow to the brain; if blood pressure decreases, brain perfusion may drop under a critical limit (Lightburn et al. 2009). As mentioned earlier fluctuating blood pressure may lead to fluctuating brain flow, which is associated with a higher incidence of severe intracranial haemorrhage. Tsuji and co-workers showed that 47 % of patients with impaired cerebrovascular autoregulation developed IVH, whereas only 13 % of patients with intact autoregulation developed these lesions (Tsuji et al. 2000).
Risk Factor: Fluctuating Blood Flow Velocities
Perlman and co-workers showed in a prospective study that fluctuating blood flow velocities are an important risk factor for the development of intracranial haemorrhage in ventilated preterm infants (Perlman et al. 1983). Perlman and co-workers measured blood flow velocities in the anterior cerebral arteries within the first hours of life. Patients with stable flow profiles did not develop severe intracranial haemorrhage.
Fluctuating flow was characterised by a continuous change in systolic and diastolic peaks form beat to beat (Fig. 2.24), whereas stable flow profiles resulted in stable peaks in systole and diastole measured by Doppler sonography.

Fig. 2.24
(a, b) Fluctuating blood flow in the anterior (a) and internal carotid artery (b) as a sign of missing autoregulation of cerebral perfusion. The Doppler spectrum shows marked fluctuations of blood flow within the arteries. Fluctuating blood flow is a risk factor for the development of intracranial haemorrhage
There was a good correlation of fluctuating flow velocities with fluctuating blood pressure. Due to missing autoregulation of brain perfusion, alterations of blood pressure are directly transmitted to the brain. Low blood pressure causes low flow velocities and possibly low perfusion and vice versa.
If fluctuations of flow velocities were below 10 %, no statistically significant difference in the severity of ICH could be found (Miall-Allen et al. 1989). This is in accordance with the earlier results of Perlman and co-workers, who found no increase of the severity of ICH in a group of patients with only minimal fluctuations <10 % (Perlman et al. 1983).
As fluctuating flow velocities are a significant risk factor for the development of ICH, fluctuations should be avoided. Perlman et al. conducted another study where they treated a group of patients with pancuronium bromide. Perlman and co-workers paralysed 72 premature ventilated infants in the first 72 h of life. In this group, in which the incidence of intraventricular haemorrhage was expected to be 90–100 %, only 7 % of the paralysed infants developed ICH (Perlman et al. 1985). They induced stable blood pressure and stable blood flow velocities within the cerebral arteries. In comparison with the untreated control group, they found a significant decrease of severe intracranial haemorrhage. Therefore, they suggests that all ventilated very preterm infants should be treated with pancuronium. Other medications such as pethidine have similar effects and can be used especially in the first 72 h where the majority of intracranial haemorrhage occurs (Miall-Allen and Whitelaw 1987). It has to be evaluated in greater prospective studies if other sedative or analgesic drugs, such as fentanyl, are as effective.
2.4.2 Periventricular Haemorrhagic Infarction of Preterm Infants
Severe intraventricular haemorrhage may be complicated by bleeding into brain parenchyma. Approximately 15–20 % of all preterm infants with a gestational age below 28 weeks and a birth weight below 1,000 g exhibit a parenchymal lesion (Volpe 2008). It is usually localised just dorsal and lateral to the external angle of the lateral ventricle (Fig. 2.25) (Volpe 2008).

Fig. 2.25
Haemorrhagic infarction of the brain parenchyma in preterm infants. (a) Coronal scan through the dilated lateral ventricles. The lateral ventricle on the ride side of the image is completely filled with blood clots. Lateral to the lateral ventricle, a trapezoidal-shaped increase of echogenicity, characteristic of haemorrhagic infarction of the white matter of the brain, can be shown. (b) Coronal scan through the dilated lateral ventricles (expanded image) at day 4. Both lateral ventricles are completely filled with blood clots. Lateral to the lateral ventricles increased of echogenicities, characteristic of haemorrhagic infarction of the white matter of the brain, can be shown. (c, d) Parasagittal section through the lateral ventricle. Blood clots fill nearly 90 % of the ventricle. Above the roof of the lateral ventricle (c) and the occipital horn (d), haemorrhagic infarction of the periventricular white matter of the parietal brain can be shown. (e) Parasagittal section through the white matter in a premature infant 10 weeks after haemorrhagic infarction of the parietal brain. Two-thirds of the blood clots have resolved. In the region of the haemorrhagic infarction, a porencephalic cyst has developed
Parenchymal haemorrhage is strikingly asymmetric. In the largest series the lesion was exclusively unilateral in about two thirds of the infants (Guzzetta and Shackelford 1986). The lesion may be localised; in about one half of the infants, the lesion was extensive and involved the periventricular white matter from the frontal to the parieto-occipital region (Volpe 2008). In the vast majority of patients, parenchymal haemorrhages are associated with gross intraventricular bleeding (Bassan et al. 2006). Parenchymal bleeding usually could be shown on the side with the lager amount of intraventricular haemorrhage. Usually intraventricular bleeding developed and progressed before parenchymal bleeding occurred (Volpe 2008). These data suggest that severe intraventricular haemorrhage leads to obstruction of the terminal and subependymal veins and impedes blood flow from the medullary veins. Parenchymal bleeding therefore is a venous infarction and not a simple expansion of blood from the ventricular space to the parenchyma (Volpe 2008).
In most classifications of intracranial haemorrhage of preterm infants, including the first of Papile, bleeding within brain parenchyma is included as grade IV haemorrhage (Papile et al. 1978). Papile and co-workers thought that blood penetrates from the ventricular cavity into the brain parenchyma. Newer investigations however have shown that no merely extension of blood from the lateral ventricles to the parenchyma occurs (Gould et al. 1987; McMenamin et al. 1984; Takashima et al. 1986; Volpe et al. 1983).
Therefore Volpe and others excluded grade IV haemorrhage from the grading system (Volpe 2008; Deeg et al. 1999a, b). Microscopic studies of the periventricular haemorrhagic necrosis showed that the lesion is a haemorrhagic infarction (Gould et al. 1987; McMenamin et al. 1984; Takashima et al. 1986; Volpe et al. 1983).
An MRI study has shown intravascular thrombi and periventricular haemorrhage along the course of the medullary veins within the area of infarction (Counsell et al. 1999).
2D Image
Haemorrhagic infarction usually occurs unilaterally, over and laterally to the side ventricle in association with severe intracranial haemorrhage (usually grade III) (Fig. 2.25a–d). The bleeding can be shown in coronal and parasagittal sections through the brain (Fig. 2.25). Initially the haemorrhage appears echogenic before cystic transformation occurs after 2–3 weeks (Fig. 2.25e) (Deeg 2005a).
The bleeding may be localised or it may extend from the frontal to the occipital lobe. Haemorrhagic infarction usually occurs associated with severe ipsilateral intraventricular bleedings which have led already to dilatation of the corresponding ventricle. Blood clots within the expanded ventricle may compress terminal veins, which run at the bottom of both lateral ventricles.
Doppler Sonography
As mentioned previously periventricular haemorrhage is in its purest form a haemorrhagic infarction. The haemorrhagic component of the infarction tends to be most concentrated near the ventricular angle where the medullary veins, which drain the periventricular white matter, become confluent and ultimately join the terminal vein in the subependymal region (Takashima et al. 1986; Volpe 1998).
In coronal sections the lesion appears as a unilateral, asymmetric, globular, crescentic or triangular-shaped echodensity, radiating from the external angle of the lateral ventricle. On parasagittal projections, the full extension of the lesion is visualised best. It may be classified as localised (involving only the frontal, parietal or parieto-occipital region) or extensive (extending from frontal to the parieto-occipital region) (Volpe 1998). Eighty percent of parenchymal lesions were observed in association with a large intraventricular haemorrhage. The haemorrhagic lesion invariably occurred on the same side of the larger amount of intraventricular blood (Volpe 1998). The haemorrhagic infarction usually developed and progressed after the occurrence of a severe intraventricular haemorrhage (Volpe 1998).
Large intraventricular haemorrhages may impede the venous drainage from the medullary veins. Colour Doppler and especially power Doppler can display venous drainage of the periventricular white matter (Figs. 2.26 and 2.27). If high-resolution transducers are used, even smaller medullary veins which drain the periventricular white matter can be shown (Fig. 2.26). Medullary veins gather at the lateral border of the side ventricle and form the subependymal veins which run at the roof and bottom of the lateral ventricle (Fig. 2.27). The largest of the draining veins is the terminal vein, which runs at the bottom of the ventricle (Fig. 2.27a). With good ultrasound equipment (high-resolution transducers, high sensitivity of colour Doppler), these veins can easily be shown (Fig. 2.27). In moderate intraventricular haemorrhages colour Doppler displays the veins within the echogenicity (Fig. 2.28a).


Fig. 2.26
(a–c) Drainage of the white matter of the brain shown by colour Doppler sonography (a, b) and power Doppler (c). High-resolution coronal section through the lateral ventricles. Colour Doppler shows several medullary veins above the lateral ventricles. The veins flow together above the ventricles. Drainage is performed by subependymal veins at the roof of the lateral ventricle and the terminal vein at the bottom of the lateral ventricle. (d) Pulsed Doppler recording of the flow in the medullary veins. The flow profile shows a bandlike continuous flow with low flow velocities of 2–3 cm/s
Fig. 2.27
(a, b) Colour Doppler of the flow in the terminal vein. The draining terminal veins (VT) run at the bottom of the lateral ventricles. (c) Pulsed Doppler recording of flow within the terminal vein at the bottom of the lateral ventricle in a preterm infant. Continuous flow with a flow velocity of 7–8 cm/s
With pulsed Doppler sonography, a continuous flow with low flow velocities of 2–4 cm/s can be found (Figs. 2.27c and 2.28b, c).
Severe intraventricular haemorrhages may compress the terminal vein and impede the drainage of the medullary veins. According to the Bernoulli equation, flow velocities initially increase within the vein (Fig. 2.28c). A further increase of the compression may lead to complete cessation of blood flow in the terminal and subependymal veins and cause haemorrhagic infarction of the periventricular region.


Fig. 2.28
Doppler sonography of the flow in the terminal veins in patients with intracranial haemorrhage. (a) Colour Doppler of the flow in the subependymal (SEV) and terminal veins (VT) in a patient with grad III intracranial haemorrhage. The image shows displacement and compression of the veins by the haemorrhage. (b) Flow measurement in the terminal vein of a premature infant with grade II haemorrhage: pulsatile flow with a peak flow velocity of 3 cm/s. (c) Flow measurement in the terminal vein of a premature infant with grade III haemorrhage: pulsatile flow with a peak flow velocity of 10 cm/s. (d) Colour Doppler of the flow in the terminal veins of a premature infant of 25 weeks of gestation and a birth weight of 650 g at day 10. The terminal vein at the bottom of the not dilated lateral ventricle can be displayed blue. On the other side with severe intraventricular haemorrhage, the terminal vein cannot be shown due to compression of the vessel. Haemorrhagic infarction develops in the adjacent white matter
2.4.3 Subdural and Epidural Haemorrhage
Subdural and epidural haemorrhages are usually caused by traumatic injury. They may also occur after difficult delivery or traumatic injury in infancy and later childhood. Rare causes of subdural or epidural haemorrhages are coagulation disorders such as thrombocytopenia, haemophilia or disseminated intravascular coagulation associated with severe infections.
Subdural haemorrhages usually are caused by rupture of the bridging veins or tears within the large cerebral sinuses. In neonates subdural haemorrhage may be caused by tentorial laceration and rupture of the straight sinus, transverse sinus, the great vein of Galen and infratentorial veins (Fig. 2.29) (Volpe 2008).

Fig. 2.29
Subdural hematoma of a newborn after precipitate vaginal delivery. (a) Coronal 2D image on day 1 shows midline shift to the left side of the image (arrows), due to a space-occupying subdural haemorrhage (SDE) (slightly increased echogenicity of the left hemisphere) (right side of image). (b) Transcranial sonography through the temporal bone shows a large subdural hematoma of 1.13 cm (cursers). The crescent shape of the subdural hematoma differentiates it from an epidural hematoma
Epidural haemorrhages most often are the result of a tear in branches of the middle meningeal artery. Epidural haemorrhages however may also originate from major veins or venous sinuses. Epidural haemorrhages are often associated with skull fractures which cross cerebral sutures.
Subdural haemorrhages are localised between the surface of the brain and the dura, whereas epidural haemorrhages are localised between the dura and the periost of the inner surface of the skull.
Rupture of greater intracranial arteries may cause rapid deterioration of the condition of the child with transtentorial herniation of the brain, whereas lesions of smaller cerebral veins often are associated with only minimal symptoms, which may occur after days or weeks.
2D Image
Fresh extracerebral haemorrhages can be shown as echogenic space-occupying lesions between the hypoechoic brain and the echogenic skull (Figs. 2.29 and 2.30). Older intracranial haemorrhages get more and more hypoechoic or echo-free (Fig. 2.31).


Fig. 2.30
(a) Coronal scan immediately after surgical evacuation of the hematoma. The image still shows midline shift to the right. The echogenicity of the left hemisphere is increased. Additionally increased echogenicity can be seen above the tentorium (arrows). (b) Colour Doppler of the flow in intracranial vessels. Increased vascularisation of the basal ganglia on the right side of the image in comparison with the left side
Fig. 2.31
(a) Coronal section on day 16 shows slightly dilated lateral ventricles and diffuse increased echogenicity of the left hemisphere. Due to dilatation of the extracerebral fluid spaces, midline shift is still present. Additional fluid can be shown above the tentorial notch (arrows). (b, c) Parasagittal (b) and midline sagittal (c) section through the left hemisphere. Large occipital subdural haemorrhage which displaces the vermis cerebelli and the occipital brain
Epidural haemorrhages have a convex, lentiform appearance, whereas subdural haemorrhages are crescent shaped.
The distinction between sub- and epidural haemorrhage is only academic. More important is the amount of blood, which may displace intracranial structures and cause cerebral herniation.
If the fontanelle is open, conventional sagittal or coronal sections can be performed (Figs. 2.29, 2.30, 2.31 and 2.33). If the fontanelle is already very small or closed, transcranial ultrasonography through the intact temporal bone can be performed (Fig. 2.29b). Depending on the age of the patient, a low transmission frequency (<3 MHz) should be chosen. In older patients over 6 years, sometimes low-frequency transducers of 2 MHz with better penetration have to be used for transcranial sonography.


Fig. 2.32
(a) Doppler sonographic flow measurement in the basilar artery at day 16. Normal flow profile and normal flow velocities. (b) Flow measurements in the extracranial (ICAe) and intracranial (ICAi) section of the left internal carotid artery. Significant increase of the flow velocities intracranially (right side of spectrum) compared with the extracranial flow velocities (left side of image). The increase of the flow velocities intracranially is an important indicator of increased intracranial pressure
Fig. 2.33
(a, b) Large subdural haemorrhage frontoparietal in a preterm infant with disseminated intravascular coagulation due to sepsis (a). Midline shift to the left caused by a large right-sided haemorrhage (b). Additionally a haemorrhage or abscess within the cerebellum can be shown (arrows)
The first aim of 2D ultrasound is the detection and location of a suspected haemorrhage.
The second aim is the estimation of the amount of the haemorrhage.
The third aim is the detection of signs of compression or displacement of normal structures: Larger haemorrhages may cause compression of adjacent normal cerebral structures and midline shift and transtentorial herniation.
The fourth aim is to detect signs of increased intracranial pressure: A greater haemorrhage leads to an increase of intracranial pressure and a compression of cerebral vessels, which can be detected by spectral Doppler.
Doppler Sonography
Doppler sonographic flow measurements should be performed in all patients with intracranial haemorrhage. As shown previously these measurements can be performed in the anterior cerebral, the internal carotid arteries and the basilar artery by the transfontanellar approach. If the transtemporal approach is used, additionally both middle cerebral arteries and the anterior and posterior cerebral arteries can be measured.
Larger haemorrhages may lead to a compression of the intracranial arteries especially in the neighbourhood of the bleeding.
Major haemorrhages may cause a significant increase of the intracranial pressure which may further compress the other intracranial vessels. This may lead to alterations of the diastolic amplitude in all intracranial arteries.
The most sensitive method for the detection of increased intracranial pressure is the comparison of the flow velocities in the intra- and extracranial part of the internal carotid artery (Deeg et al. 2001). In normal infants intracranial flow velocities do not differ significantly from extracranial flow velocities. In patients with increased intracranial pressure, the cerebral part of the artery is compressed, whereas the extracranial part is protected by the petrosal bone. According to the Bernoulli equation in a compressed vessel, the flow velocities increase. An increase of the peak systolic velocity within the cerebral part of the internal carotid artery in comparison with the petrosal part is the most sensitive sign of an increased intracranial pressure (Fig. 2.32b).
A significant increase of the intracranial pressure first may lead to an increase of all intracranial flow velocities. A further increase leads to a decrease of the diastolic amplitude, whereas the systolic peak further increases or is unchanged. In severe haemorrhage the end-diastolic flow may be absent or even retrograde. In these cases intracranial pressure is severely elevated. If the end-diastolic flow velocity is zero, the intracranial pressure corresponds to the diastolic blood pressure which can be measured non-invasively. In the case of retrograde diastolic flow, intracranial pressure exceeds the diastolic blood pressure (Fig. 2.34).

Fig. 2.34
(a–c) Doppler sonographic flow measurement in the internal carotid (a, b) and basilar artery (c) shows retrograde diastolic flow due to a massive increase of the intracranial pressure. The intracranial pressure exceeds the diastolic blood pressure
As mentioned previously severe subdural haemorrhage may also be caused by disseminated intravascular coagulation. In these cases a midline shift can be found (Fig. 2.33b). The increase of intracranial volume is caused by a significant amount of blood which may lead to herniation of intracranial structures. Significant increase of the intracranial pressure leads to compression of the intracranial arteries. Flow measurements may show a significant decrease of the diastolic flow or even negative flow in all intracranial arteries (Fig. 2.34). Diastolic zero flow or even backflow is a bad prognostic sign, as cerebral perfusion may fall under a critical limit (Fig. 2.34). Most of these patients die, due to longer-lasting bad cerebral perfusion and following severe brain injury.
If diastolic backflow is found in cerebral arteries, haemodynamic causes of diastolic backflow (especially a leakage of the aortic Windkessel) have to be excluded. To rule out haemodynamic causes of diastolic backflow, flow measurements in extracranial arteries such as the celiac trunk or renal arteries should be performed. Normal flow in the extracerebral arteries such as the celiac trunk excludes a significant leakage of the aortic Windkessel. In all other cases a thorough echocardiographic investigation has to be performed to exclude congenital cardiac malformations with a defect in the aortic Windkessel.
Please note: A patient with significant intracranial haemorrhage and decreased diastolic blood flow velocities does not need a thorough Doppler sonographic investigation but a rapid neurosurgical intervention! The haemorrhage must immediately be surgically evacuated, bleeding stopped and raised intracranial pressure decreased, to prevent irreversible brain damage and severe handicap.
2.4.4 Subarachnoid Haemorrhage
Primary subarachnoid haemorrhage refers to a bleeding within the subarachnoid space. Subarachnoid haemorrhage is not secondary to the extension of blood from the intracerebral, subdural, epidural, cerebellar or intraventricular space. It is usually not the consequence of bleeding from a tumour, coagulation disorder or vascular malformation (Volpe 2008).
Subarachnoid haemorrhage is more frequent in the premature infant than in the term neonate. It is almost always benign.
Many of subarachnoid haemorrhages relate to trauma or circulatory events associated with prematurity.
Infants typically do well. They show no neurological signs or come to evaluation with minimal symptoms, such as seizures.
In seldom cases with massive subarachnoid haemorrhage, patients exhibit massive deterioration with sometimes fatal course (Figs. 2.35 and 2.36).


Fig. 2.35
Subarachnoid haemorrhage. (a) Subarachnoid haemorrhage in a 2-week-old patient with occlusion of the ipsilateral internal carotid artery. Focal increased echogenicity of the left hemisphere. In the parietal region, the gyri and sulci cannot clearly be delineated. (b, c) Sagittal (b) and coronal (c) scan of a whiplash shaken infant with subarachnoid haemorrhage. Diffuse increased echogenicity frontobasal due to subarachnoid haemorrhage. Sulci and gyri frontobasal cannot clearly be differentiated. (d, e) Pulsed Doppler sonographic flow measurement in the anterior cerebral artery (d) and the internal carotid artery (e) shows systolic forward flow and diastolic backflow due to increased intracranial pressure
Fig. 2.36
(a, b) Coronal scan of the brain several weeks after the injury (same patient as in Fig. 2.35). Multiple porencephalic cysts especially in the frontobasal region, which initially were displayed echogenic. Severe dilatation of the ventricular system. (a) Coronal section through the midline, (b) coronal section tilted anteriorly
2D Ultrasound
Detection of subarachnoid haemorrhage by ultrasound is difficult. As the periphery of the brain is echogenic, haemorrhages can often not be differentiated from the brain surface for sure. Thorough examination however may detect subarachnoid haemorrhage by increased echogenicity of the corresponding brain surface (Fig. 2.35a, b). Greater haemorrhages may distend the Sylvian fissure in the individual case.
In fatal cases, further investigations by two-dimensional ultrasound show hypoxaemic-ischaemic lesions in the region where initially subarachnoid haemorrhage could be shown (Figs. 2.35 and 2.36).
Table 2.5
Flow velocities in the anterior cerebral arteries of 8 prematurely born infants with intracranial haemorrhage in comparison with a control group of the same age and weight
Intracranial haemorrhage | Control group | p | |
|---|---|---|---|
Gestational age (w) | 32 ± 6 | 33 ± 5 | |
Age at investigation (d) | 3 ± 1.9 | 3.3 ± 1.7 | |
Weight (g) | 1,653 ± 114 | 1,828 ± 1,072 | |
V s (cm/s) | 26 ± 12 | 41 ± 17 | ≤0.01 |
V es (cm/s) | 11 ± 5 | 21 ± 10 | ≤0.05 |
V ed (cm/s) | 5 ± 3 | 13 ± 7 | ≤0.05 |
RI | 0.80 ± 0.12 | 0.69 ± 0.05 | ≤0.05 |
Table 2.6
Flow velocities in the anterior cerebral arteries of 5 mature newborns with intracranial haemorrhage in comparison with a control group of the same age and weight
Intracranial haemorrhage | Control group | p | |
|---|---|---|---|
Gestational age (w) | 40 ± 0.7 | 40 ± 0.4 | |
Age at investigation (d) | 2.4 ± 2.3 | 2.6 ± 1.9 | |
Weight (g) | 3,550 ± 247 | 3,574 ± 230 | |
V s (cm/s) | 47 ± 13 | 60 ± 14 | ≤0.05 |
V es (cm/s) | 17 ± 3 | 30 ± 11 | ≤0.05 |
V ed (cm/s) | 6 ± 5 | 18 ± 8 | ≤0.05 |
RI | 0.86 ± 0.09 | 0.70 ± 0.09 | ≤0.05 |
Doppler Sonography
Small amounts of blood will not change blood flow and blood flow velocities. Greater amounts of subarachnoid blood may influence flow profiles and flow velocities. Due to vasospasm an increase of the flow velocities can initially be found, which may be caused by subarachnoid blood. In severe cases even decreased diastolic amplitude and a decrease of the end-systolic and end-diastolic flow velocities can be found (Fig. 2.35d, e). Prognosis in these cases is very bad. Severe hypoxaemic-ischaemic lesions adjacent to the initial bleeding can be found (Fig. 2.36).
2.5 Pericerebral Fluid Collection
The pericerebral extraaxial fluid compartment in the normal newborn infant varies between 0 and 3.3 mm with a mean of 1.6 mm (Frankel et al. 1998). Small amounts of extraaxial pericerebral fluid, up to 3.3 mm in width, are common and normal in neonates (Frankel et al. 1998). Infants with macrocephaly often exhibit wider extracerebral cerebrospinal fluid spaces. The aim of the sonographer is to distinguish benign dilatation from pathologic dilatation. The dilatation of the extraaxial spaces with normal-sized ventricles and no other brain anomalies is termed ‘benign infantile hydrocephalus’. Besides benign dilatation, pathologic dilatations may be caused by subdural hygroma, subdural effusion or abscess formation, due to meningitis and subdural haematoma. In the latter cases increased intracranial pressure has to be excluded.
Apart from 2D imaging, the various Doppler techniques are very helpful for the differentiation.
2D Image
Imaging of the entire extracerebral space is difficult, as sector transducers exhibit only a small part of the brain surface. Therefore, transcranial sonography from the transtemporal approach has to be used (see later). To exclude high parietal dilatation of the outer cerebrospinal fluid spaces, a high-resolution linear transducer of more than 10 MHz is helpful. With this equipment pericerebral fluid can easily be shown (Figs. 2.37 and 2.38). Besides the surface of the brain, the superior sagittal sinus can be displayed. In pathologic dilatations differentiation between dilatation of the subarachnoid and subdural space can be performed (Figs. 2.38 and 2.39).


Fig. 2.37
(a, b) Benign dilatation of the outer cerebrospinal fluid spaces in a macrocephalic infant. Coronal scan shows the surface of the brain and dilatation of the extraaxial cerebrospinal fluid spaces. (c) Measurement of the extracerebral fluid spaces: 1 and 5 cranio-cortical width, 2 and 4 sinu-cortical width, 3 width of interhemispheric fissure. (d–f) Colour Doppler of benign dilatation of the outer cerebrospinal fluid spaces. (d, e) coronal section; (f) sagittal section. Benign dilatations are characterised by multiple bridging veins (arrows), which transverse the dilated extraaxial cerebrospinal fluid. (g) Pulsed Doppler of the flow in a bridging vessel demonstrates continuous venous flow, characterising the vessel as a vein
Fig. 2.38
(a–c) Severe dilatation of the subdural space, due to floating blood, characterised by multiple fine swirling echoes. The gyri and sulci are flat, due to increased intracranial pressure. (a, b) coronal section; (c) sagittal section. (d) Power Doppler of the flow in the bridging veins in a whiplash shaken infant. Normal bridging veins on the left side of the image. No bridging veins on the right side of the image. Dilatation of the subdural and subarachnoid space. A arachnoid, D dura mater
Fig. 2.39
(a, b) Dilatation of the outer cerebrospinal fluid space in a whiplash shaken infant (a, coronal scan; b, parasagittal scan). The dilatation shows internal echoes (erythrocytes). Severe lacerations at the border zone between the grey and white matter have caused subcortical cavitations. These cavitations are characteristic of a whiplash shaken accident. (c) Colour Doppler shows no bridging veins which cross the outer cerebrospinal fluid space. Due to the subdural haemorrhage, bridging veins are pressed onto the surface of the brain. (d) Expanded coronal scan through the brain surface shows dilated extracerebral fluid spaces. D dura mater, ↓ epidural space, * subdural space, ← subarachnoid haemorrhage. (e) Pulsed Doppler of the flow in the internal carotid artery shows increased flow with peak systolic flow velocities of 1.5 m/s due to increased intracranial pressure. Flow measurements in the intracranial arteries in patients with subdural effusion. The flow profiles show decrease of the diastolic flow. (f) Flow measurements in the anterior cerebral artery. (g) Simultaneous measurement of flow in the intracranial (right flow profile) and extracranial part (left flow profile) of the internal carotid artery. Normal decrease of the flow from extracranial (ICAe) to intracranial (ICAi)
Benign dilatations are always echo-free, whereas pathologic dilatations often contain internal echoes such as blood or pus (Figs. 2.37a, 2.38a and 2.39a). Benign dilatations often are V shaped, whereas pathologic dilatations with increased intracranial pressure are U shaped (Figs. 2.37, 2.38 and 2.39). In these cases the cerebral gyri and sulci are compressed and appear flattened (Fig. 2.38). In benign dilatations the sulci are wide and the gyri are normal shaped (Fig. 2.37). The ventricles are normal or prominent sized, and the echogenic pia-arachnoidea line is normal sized (Chen et al. 1996).
Libicher and Tröger measured normal values of the subarachnoid spaces of healthy neonates. They found upper limits of the sinu-cortical width of 3 mm, the cranio-cortical width of 4 mm and the interhemispheric width of 6 mm (Libicher and Tröger 1992).
Doppler Sonography
Superficial cortical veins under normal circumstances lie on the cortical surface in close approximation to the underlying pia and overlying arachnoid and dura membranes. At the convexity of the brain, these veins converge and penetrate the arachnoid and dura to reach the superior sagittal sinus (Figs. 2.37d–g). Pericerebral fluid collections may occur in two spaces: the subarachnoid and the subdural space. If these spaces are enlarged, the superficial cortical vessels may be stretched or displaced, depending on the affected space. The different Doppler techniques are helpful for the visualisation of these vessels, especially the veins.
Colour or power Doppler has to be distinguished from spectral Doppler. With the help of colour or spectral Doppler, bridging vessels, especially veins, can be shown with high-resolution linear transducers of 10–14 MHz (Figs. 2.37d–g, 2.38d and 2.39c). In parietal coronal sections through the open fontanelle, benign dilatations are characterised by several vessels which cross the echo-free pericerebral fluid space (Fig. 2.37b, d–g, f). This is called the positive cortical vein sign (Chen et al. 1996; Rupprecht et al. 1996).
Pathologic dilatations such as subdural effusions, hygroma or haematomas are characterised by bridging vessels which do not cross the cerebrospinal fluid (Figs. 2.38d, 2.39c and 2.40c). In contrast to infants with benign dilatations, the vessels are compressed to the brain surface by inward movement of the arachnoid (negative cortical vein sign) (Fig. 2.39c) (Chen et al. 1996; Rupprecht et al. 1996).

Fig. 2.40
Whiplash shaken infant. (a) coronal; (b) sagittal section through the brain surface. The images show dilated extracerebral fluid spaces. 1 epidural space, 2 subdural space, 3 subarachnoid space. Increase echogenicity of the subarachnoid space due to subarachnoid haemorrhage. The subdural space (2) is echo-free. The epidural space is also echogenic due to haemorrhage. (c) Colour Doppler shows no bridging veins which cross the dilated extracerebral spaces. Some residual veins are pressed on the surface of the brain
The displaced cortical veins, medial to the hygroma, penetrate the dura near the superior sagittal sinus before entering it.
The shaken infant syndrome in young infants is caused by a rupture of the bridging veins. The space between the arachnoid and dura is dilated due to subdural haemorrhage (Fig. 2.39c, d). Within the dilatation multiple swirling internal echoes, caused by erythrocytes, can be shown (Fig. 2.38a–c). Characteristic of the shaken infant syndrome are echo-free areas at the border zone between the grey and white matter (Fig. 2.39a, b). The contusional tears occur most frequently in the orbital, temporal and parietal region (Jaspan et al. 1992). They are caused by different physical characteristics of the grey and white matter: The relatively fixed grey matter (bridging veins) glides over the relatively gelatinous white matter. During shaking repetitive acceleration-deceleration forces in the sagittal plane occur and cause contusional tears (Fig. 2.39a, b).
Larger amounts of pathologic dilatations lead to an increase of the intracranial pressure which can be detected by pulsed Doppler.
Pulsed Doppler
Increased intracranial pressure may influence blood flow in all intracranial arteries. As the brain is an organ which contains more than 90 % water, pressure is transmitted to all arteries. If flow is influenced, all arteries may show similar changes.
First, diastolic flow may be increased especially if pressure is only slightly increased.
Second, a further increase of intracranial pressure may lead to a decrease of the diastolic amplitude and especially the end-systolic or end-diastolic flow velocities (Fig. 2.39f, g). This causes a decrease of the resistive index.
If flow measurements are performed simultaneously in the extracranial and intracranial part of the internal carotid artery, no significant changes can be found in healthy infants (see later). In patients with increased intracranial pressure, flow velocities increase intracranially, according to the Bernoulli equation. In our experience, this is the earliest and the most sensitive sign for the detection of a beginning increase of the intracranial pressure (Fig. 2.39g). The increase can already be found in patients with normal flow profiles and flow velocities.
2.6 Hydrocephalus
Besides intracranial haemorrhage, ventricular dilatation is the second most frequent indication for cerebral sonography in infancy. The most frequent causes of ventricular dilatation are congenital hydrocephalus, especially the different Chiari malformations, posthaemorrhagic hydrocephalus, postmeningitic hydrocephalus and hydrocephalus associated with brain tumours. In all these cases, the ventricular dilatation is caused by a blockage of the cerebrospinal fluid flow, whereas hypersecretory hydrocephalus is very rare. It can only be found in patients with plexus papilloma or plexus carcinoma.
Obstructive hydrocephalus and hypersecretory hydrocephalus may cause rapid increase of ventricular dilatation and intracranial pressure with compression of the adjacent brain tissue. Brain vessels may be compressed too. This may influence blood flow in intracranial arteries and veins.
2D Image
The aim of 2D imaging is the diagnosis of ventricular dilatation.
Ultrasonography should answer the question of the possible aetiology of hydrocephalus.
A prenatally diagnosed hydrocephalus mostly is caused by developmental malformations of the brain such as the different Chiari malformations, disorders of migration, agenesis of the corpus callosum, etc., whereas prenatal meningoencephalitis and intracranial haemorrhage rarely occur.
Immature premature-born infants may develop severe intracranial haemorrhage. After grade III haemorrhage often progressive posthaemorrhagic ventricular dilatation occurs.
Bacterial meningitis may cause postmeningitic hydrocephalus. Other rare causes of hydrocephalus are intracranial tumours which may obstruct the physiologic cerebrospinal fluid pathways or cause abundant production of cerebrospinal fluid.
Most ventricular dilatations are caused by obstruction, whereas hypersecretory hydrocephalus is only caused by the rare plexus papilloma or carcinoma.
In cases of obstructive hydrocephalus, 2D ultrasonography has to analyse what parts of the ventricular system are dilated (Figs. 2.41, 2.42, 2.43, 2.44 and 2.45).

Fig. 2.41


Sagittal scan of developing posthaemorrhagic hydrocephalus. (a) Eighty percent of the ventricular lumen is filled with blood clots. Initially the lateral ventricle is only slightly dilated. (b) At day 16 dilatation of the occipital, frontal and temporal horns. The parasagittal sections through the lateral ventricles show old blot clots in the temporal and occipital horn and in the region of the germinal matrix. After several weeks the clots resolve (b). (c) At day 35 severe dilatation of the entire lateral ventricle. Old blood clot in the occipital horn and the trigonum of the lateral ventricle
Related posts:
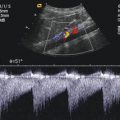
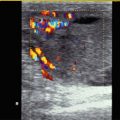
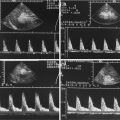
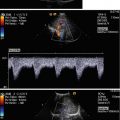
Stay updated, free articles. Join our Telegram channel
Full access? Get Clinical Tree
