Fig. 23.1
Examples of intracranial hemorrhage on CT. Unenhanced CT image showing focal hyperdensity from deep basal ganglia intracranial hemorrhage (a) and lobar intracranial hemorrhage (b) in a different patient. Note dissection into the lateral ventricles (arrow in a) and subsequent hydrocephalus
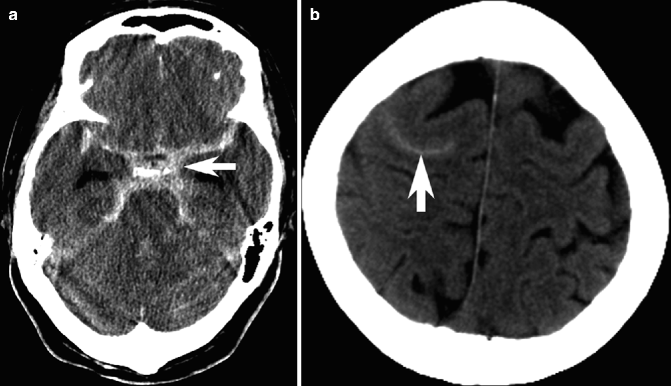
Fig. 23.2
Examples of subarachnoid hemorrhage on CT. Unenhanced CT image shows diffuse hyperdensity in the basal cisterns (arrow, a) in a patient with SAH from a ruptured aneurysm. In another patient, focal SAH in the vertex was caused by cerebral venous thrombosis (arrow in b, see also Sect. 23.7)
23.2.2 Hemorrhage on MRI
23.2.2.1 Intracranial Hemorrhage on T1- and T2-Weighted Images
The MRI appearance of hemorrhage is strongly dependent on the type of pulse sequence used (T1- or T2-weighted, conventional or fast spin echo, inversion recovery or gradient echo), the field strength of the magnet, as well as the magnetic state of blood products, which is dependent on the age of the hemorrhage (Gomori et al. 1985) (Fig. 23.3). In the hyperacute hematoma (encountered within minutes to hours), oxyhemoglobin is isointense on T1-weighted images and slightly hyperintense on T2-weighted images, but the more commonly encountered acute hematoma (hours to days) is comprised of intracellular deoxyhemoglobin and methemoglobin within intact red blood cells, appearing hypointense on T2-weighted images. There is usually a transient rim of edema surrounding the hematoma.
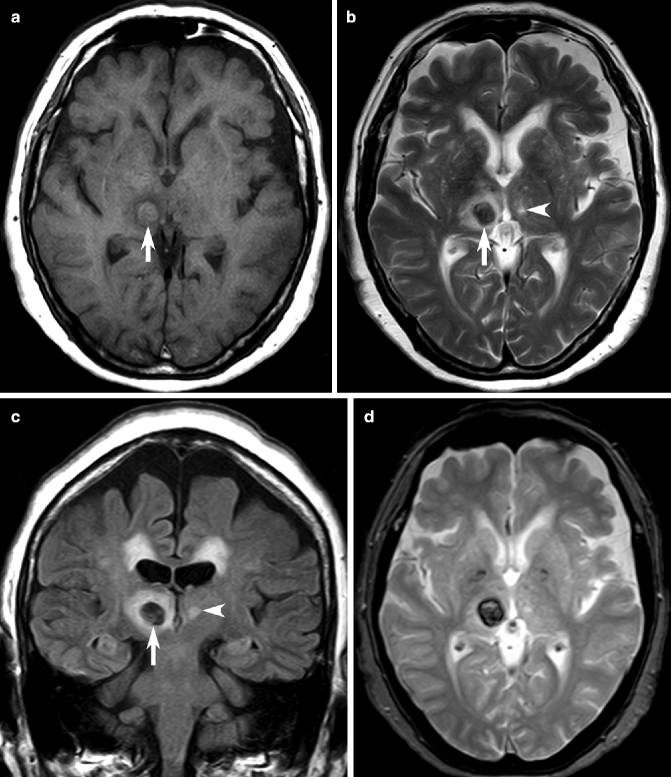

Fig. 23.3
Intracranial hemorrhage on MRI. Axial T1-weighted MRI showing isointense hematoma (arrow, a), which is hypointense on T2-weighted (b) and FLAIR (c) images, with a small rim of high signal cerebral edema. Note the presence of small, old lacunar infarctions (arrowheads). On a GRE MRI (d), the hematoma shows low signal with a complete ring
Lysed red blood cells in the subacute (days to weeks) hematoma cause increased signal on T1-weighted images from extracellular methemoglobin, typically starting from the outer rim and extending inward over time. In the chronic stage (weeks to months), phagocytosis results in accumulation of particulate iron in the form of hemosiderin and ferritin, visible as low signal areas on MRI. These breakdown products begin by forming a hypointense edge around the resolving hematoma and often persist for many years. In general, fast spin-echo imaging is slightly less sensitive in the detection of hemorrhage compared to conventional spin-echo images.
23.2.2.2 Hemorrhage on FLAIR and GRE Images and Role in SAH
FLAIR is a strongly T2-weighted pulse sequence, and hence, the signal characteristics of intracerebral hematomas are similar to spin-echo T2-weighted images. FLAIR is very sensitive to hyperintense SAH, especially in the posterior fossa, base of skull, and the ventricles (Noguchi et al. 1995) (Fig. 23.4). CSF pulsation artifacts are a significant pitfall.
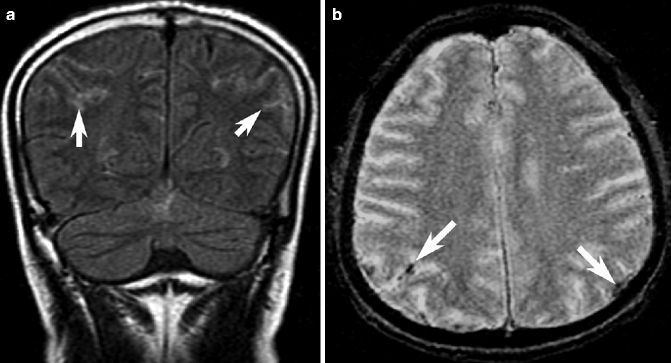

Fig. 23.4
Subarachnoid hemorrhage on MRI. Coronal FLAIR MRI shows high signal intensity in the sulcal subarachnoid space (arrows, a) bilaterally. On GRE MRI, SAH is detected as focal hypointensity (arrow, b)
Hematomas appear hypointense on T2*-weighted gradient recalled echo (GRE) images, which are extremely sensitive to the effects of static magnetic field inhomogeneities produced by paramagnetic blood products. Hence, even small focal areas of microbleeding (MB) can be detected on GRE images: the so-called blooming effect due to the hypointense area being larger than the actual hemosiderin deposit (see Sect. 23.2.3.3) (Greenberg et al. 2009). GRE is also very sensitive to small amounts of hypointense SAH, especially in the ventricles or as superficial siderosis on the surfaces of the gyrus at the cerebral vertex. The higher oxygen partial pressure within the CSF delays conversion of blood products in a variable and less predictable way compared with hematoma in the brain parenchyma (Grossman et al. 1986). Although detection of acute SAH and hemorrhagic stroke is possible with MRI, CT is still the diagnostic procedure of choice (Irimia et al. 2011).
23.2.3 Cerebrovascular Causes of Intracranial Hemorrhage
23.2.3.1 Hypertensive Hematoma
Hypertension is the presumed cause of the majority of intracranial hemorrhages, typically those deep in the basal ganglia, thalamus, pons, or the dentate nucleus of the cerebellum. Deep hemorrhages in hypertensive patients are often due to hypertension, whereas lobar hemorrhages in non-hypertensive elderly patients are often due to cerebral amyloid angiopathy (CAA) (Broderick et al. 2007). Although angiography is indicated in most young patients with suspicious features of calcification, abnormal vessels or blood in unusual locations, the yield declines in elderly hypertensives with deep hematoma, and it is rarely performed unless clinical suspicion is high (Broderick et al. 2007).
23.2.3.2 Cerebral Amyloid Angiopathy
CAA is an important cause of nontraumatic hemorrhagic stroke in the elderly population, responsible for 15–20 % of intracranial hemorrhage in normotensive patients, such frequency increasing with age. CAA, which is associated with accumulation of the misfolded amyloid beta-protein (similar to senile plaques in Alzheimer’s disease) in vessel walls (Vinters 1987), typically causes multifocal lobar (especially frontal lobes) hemorrhages, MBs, superficial siderosis, and very rarely focal amyloidoma (Vonsattel et al. 1991). The hematoma caused by CAA is typically located peripherally in the cerebral lobes and less commonly involves the brainstem, cerebellum, or the basal ganglia (which are characteristic of hypertensive hemorrhage). CAA-associated bleeding from leptomeningeal vessels can also sometimes be detected as superficial siderosis, which is hemosiderin deposition in the subarachnoid space, visible as gyral hypointensity on GRE or susceptibility-weighted MRI. A combination of multifocal MBs, lobar hemorrhages of different ages, associated with superficial siderosis, is typical of CAA (see Fig. 24.11 in Chap. 24).
23.2.3.3 Cerebral Microbleeds
Microbleeds are defined as small “dot-like” round or ovoid (but not linear) hypointense brain lesions on GRE or susceptibility-weighted images, sometimes not visualized on other pulse sequences (Greenberg et al. 2009). The prevalence of these MBs is generally higher with age, in patients of Asian ethnicity, and with intracranial hemorrhage or ischemic stroke compared to populations without cerebrovascular disease (Koennecke 2006). Two common associations of MBs in the elderly include CAA and hypertension, but other causes of multiple small collections of hemosiderin should also be considered in the differential diagnosis, including traumatic injury, cerebral autosomal dominant arteriopathy with subcortical infarcts and leukoencephalopathy, and multiple cavernoma (Hegde et al. 2012). CAA-related MBs tend to be lobar and are typically located in the cortical gray matter or in the border zone between gray matter and white matter.
The clinical implications of subclinical MBs are being actively investigated for both hemorrhage risk stratification and dementia. CAA may be associated with a higher rate of recurrent hemorrhage approaching 10 % per year (O’Donnell et al. 2000; Greenberg et al. 1993). Although lobar MBs are strongly linked to dementia in patients with Alzheimer disease, both types of MBs frequently coexist on MRI (see Chap. 24).
23.2.3.4 Iatrogenic Causes of Hematoma and Bleeding Diathesis
Spontaneous intracranial hemorrhage is a rare (around 0.3 % incidence) but deadly complication of thrombolytic therapy for acute myocardial infarction with a poor prognosis (up to 50 % mortality) (Vinters 1987). Age, hypertension, prior stroke, amyloid angiopathy, leukoaraiosis, and dementia may predict a higher risk of hemorrhage in patients treated with thrombolysis or warfarin after myocardial infarction (Vonsattel et al. 1991). Thrombocytopenia, hemophilia, leukemia, liver disease, fibrinolysis, disseminated intravascular coagulation associated with sepsis, and other rare diseases also predispose to intracranial hemorrhage (Wijdicks et al. 1994).
23.2.3.5 AVM and Cavernous Angioma
Vascular malformations include AVM and occult vascular malformations: those not demonstrated by angiography include cavernous angiomas, capillary telangiectasias, and venous malformations (Rigamonti et al. 1987). AVMs can cause hemorrhage in the cerebral hemispheres, and the nidus, dilated feeding arteries, and draining veins may be seen; signal loss on MRI in the nidus is due to a combination of hemorrhage, rapidly flowing blood, or calcification (Anonymous 1979). They are seldom seen in the elderly, being typically diagnosed before the age 40.
Cavernous angiomas are low-flow vascular malformations without enlarged feeding arteries or draining veins but are often incidentally detected on MRI (Robinson et al. 1993). On CT, they are nonspecific with focal hyperdensity containing blood or calcium with indistinct margins, but on MRI, they have a characteristic well-circumscribed, lobulated “popcorn” appearance with heterogeneous signal intensity on both T1- and T2-weighted sequences and peripheral ring of hemosiderin hypointensity representing recurrent hemorrhage in various stages of evolution, (Hegde et al. 2012) (Fig. 23.5). Multiple, small cavernous angiomas may be seen in the familial form of cavernoma (typically become symptomatic between the third and fifth decades), which may be difficult to distinguish from CAA and other causes of developmental venous angiomas on MRI alone (Brunereau et al. 2000).
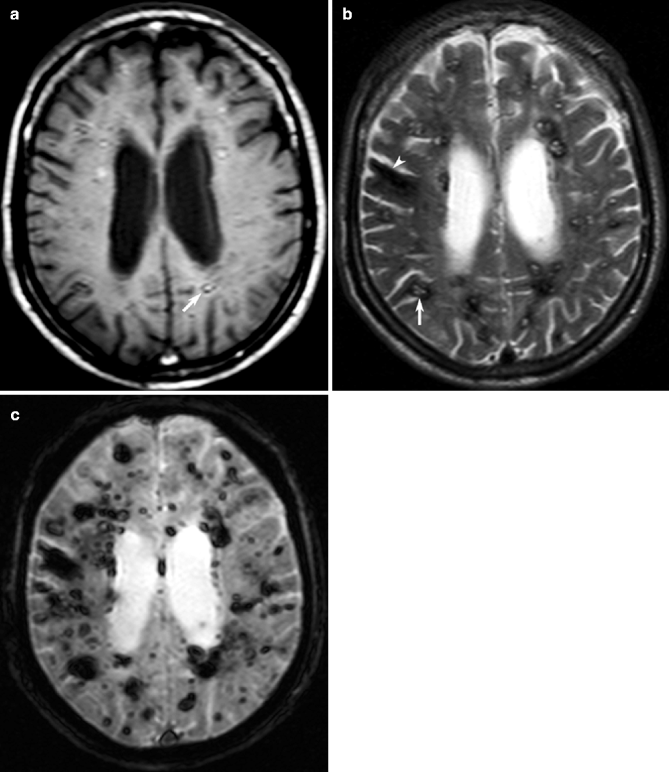

Fig. 23.5
Multiple cavernous angiomas on MRI. Axial T1- (a) and T2- weighted (b) MRI showing multiple bilateral cavernous angiomas as hyperintensities surrounded by a hypointense rims (arrows) and hypointense areas of intracranial hemorrhage (arrowhead), respectively. Corresponding T2*-weighted GRE MRI (c) is more sensitive to the full extent of multiple tiny cavernous angiomas and hemorrhage (See also Hegde et al. 2012)
Developmental venous angiomas are clusters of deep medullary veins draining centripetally into a normal but prominent vein that does not cause intracranial hemorrhage. Developmental venous angiomas are incidental findings seen on contrast-enhanced MRI and do not require angiographic investigation nor surgical resection; however, these angiomas are associated with cavernous malformations and improve diagnostic confidence of the latter (Abe et al. 1998).
23.2.3.6 Neoplasia and Other Causes of Spontaneous Intracranial Hemorrhage
Bleeding into preexisting brain tumors accounts for 10 % of all brain hemorrhages, but only 1–2 % of primary (glioblastoma multiforme, oligodendroglioma, and ependymoma) or metastatic (melanoma, choriocarcinoma, bronchogenic, renal cell, and thyroid carcinomas) tumors present as intracranial hemorrhage (Atlas et al. 1987). Imaging red flags suggesting neoplasia include multifocal, heterogeneous stages of signal evolution present simultaneously, high signal intensity on T1-weighted images originating centrally within the hematoma, absent or incomplete hemosiderin rim, persistent and extensive perilesional edema, and contrast enhancement (see Chap. 22). In some cases, the hematoma may obliterate evidence of the neoplasm. Hypertensive hemorrhage is almost never multiple, and multiple hematomas are more likely due to bleeding diathesis, metastatic tumors, sepsis, CAA, cerebral venous thrombosis (see Sect. 23.7), or trauma.
23.3 Neuroimaging in Ischemic Stroke
23.3.1 Ischemic Infarction on CT
Decreased attenuation from edema secondary to cerebral infarction is the most important sign in cerebral ischemia, and is typically evident by 24 h, although early signs may be detected as early as a few hours after ictus. However, CT has low sensitivity to cerebral infarction, especially small ones, and is also hampered by beam-hardening artifacts in the posterior fossa. Nevertheless, supporting signs such as loss of the gray matter-white matter differentiation (particularly the edge of the lentiform nucleus), insular ribbon sign, mass effect (effacement of sulci and ventricles), and the dense vessel (classically the MCA) signs might be helpful for detection (Fig. 23.6) (Schuknecht et al. 1990). MRI has a higher sensitivity than conventional CT for the detection of small lesions, infarction within the first hours of stroke onset, lesions in the posterior fossa, and documentation of vessel occlusion and brain edema (Irimia et al. 2011).
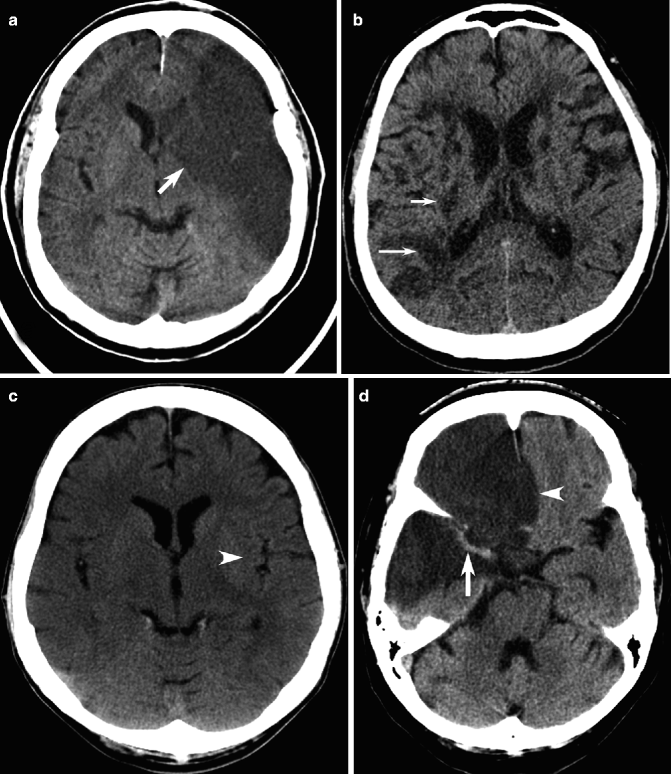

Fig. 23.6
Examples of ischemic infarction on CT. Unenhanced CT image shows decreased density due to infarction of the entire left MCA territory (arrow, a). In another typical elderly patient, there are multifocal recent subcortical infarcts in the right MCA territory (arrows, b), on a background of other low-density chronic infarcts in both cerebral hemispheres. Right MCA acute infarction in a different patient manifests as subtle decreased density, blurring of the gray matter-white matter junction, especially at the lateral edge of the right lentiform nucleus (c), compared to the normal appearance of the left lentiform nucleus edge (arrowhead). Dense MCA sign (arrow) and subfalcine herniation (arrowhead) may also be detected in patients with extensive cerebral infarction (d)
23.3.2 Ischemic Infarction on MRI
23.3.2.1 Acute Infarction on Diffusion-Weighted Images
Diffusion-weighted MRI has an extremely high sensitivity and is the potential gold standard to detect acute infarction that correlates to both final infarct volume on follow-up imaging and neurologic outcome (Sorensen et al. 1996). Although there have been rare exceptions, the volume of DWI abnormality can be accepted as the infarct core that is not salvageable with reperfusion treatment (Fiehler et al. 2002). Hyperintensity on DWI (with restricted, i.e., decreased ADC) outlines the boundaries of cytotoxic edema in acute infarction with extremely high signal-to-noise ratio (Fig. 23.7) and can conspicuously depict brain lesions that are responsible for eponymous clinical neurological syndromes (such as Wallenberg syndrome, internuclear ophthalmoplegia syndrome) (Fig. 23.8). False-negative studies are rare in DWI, usually very small lacunar brainstem or deep gray nuclei infarctions (Lovblad et al. 1998).
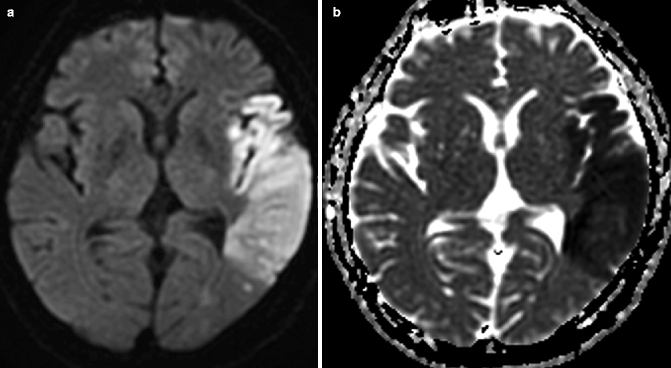
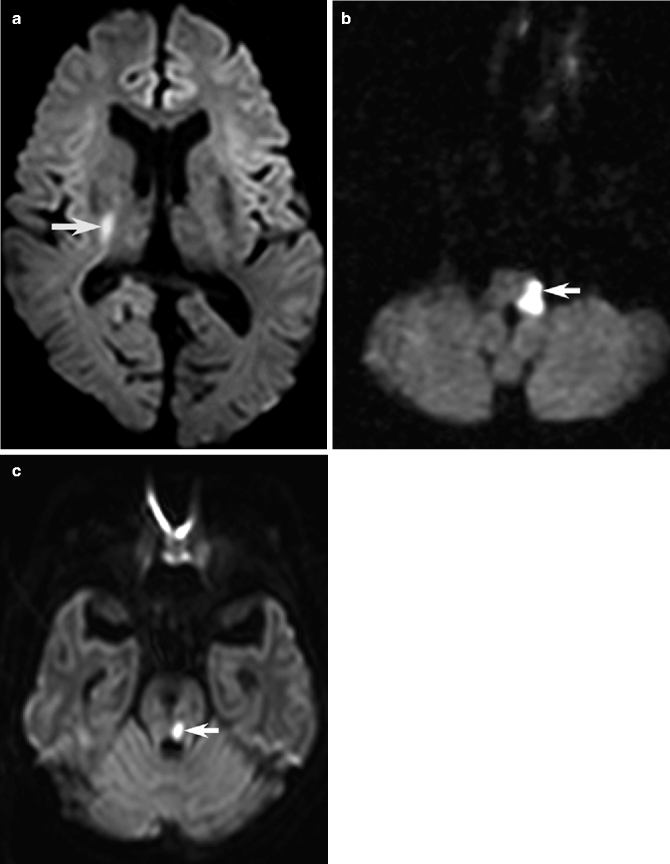

Fig. 23.7
Acute ischemic infarction on diffusion-weighted MRI. Axial DWI, (a) showing large hyperintense cortical left MCA infarction. The infarct is seen as an area of decreased apparent ADC in the hypointense region on the corresponding ADC map (b)

Fig. 23.8
Examples of acute ischemic infarction responsible for clinical neurological syndromes. Axial DWI showing hyperintense acute lacunar infarctions of the right posterior limb internal capsule causing pure motor stroke (arrow, a), left lateral medulla causing lateral medullary syndrome (arrow, b), and left midbrain responsible for internuclear ophthalmoplegia (arrow, c)
The biophysical basis of signal on DWI is complex: in acute severe ischemia, Na+/K+ ATPase pump failure causing net movement of water from the extracellular to the intracellular compartment, where diffusion/movement is relatively restricted, results in cytotoxic edema within minutes (Mintorovitch et al. 1994). After the acute phase of decreasing ADC to its nadir at 1–4 days, the ADC rises and pseudonormalizes to transient equivalence to normal brain tissue (although the tissue is infarcted), typically at 1–2 weeks, and keeps rising until the ADC is elevated in the chronic stage (Schlaug et al. 1997). The time course of ADC change is influenced by many different factors including infarct type, patient age (slower in the elderly), and treatment with recombinant tissue plasminogen activator (rt-PA) (Copen et al. 2001). Since the signal intensity on DWI depends on ADC as well as the T2 information inherent in the b = 0 echo-planar image, net hyperintensity on the DWI images may be due to low ADC or T2 effects: the “T2 shine-through.” Hence, false-positive studies from subacute or chronic infarction can be avoided by reviewing the pure ADC maps (which are obtained by logarithmic subtraction off the b = 0 from high b value DWI image) (Mintorovitch et al. 1994).
23.3.2.2 Acute Infarction and Abnormal Vessels on Conventional MRI
By 24 h, T2-weighted images demonstrate infarcted tissue as hyperintensity due to overall increase in tissue water but have limited sensitivity in the hyperacute period (Yuh et al. 1991). Furthermore, volume averaging with normally hyperintense CSF signal may obscure small cortical and periventricular lesions. Fluid-attenuated inversion recovery (FLAIR) suppresses CSF signal and overcomes these problems (Fig. 23.9), but since it is highly T2 weighted, sensitivity is still low in the first 6 h (Perkins et al. 2001).
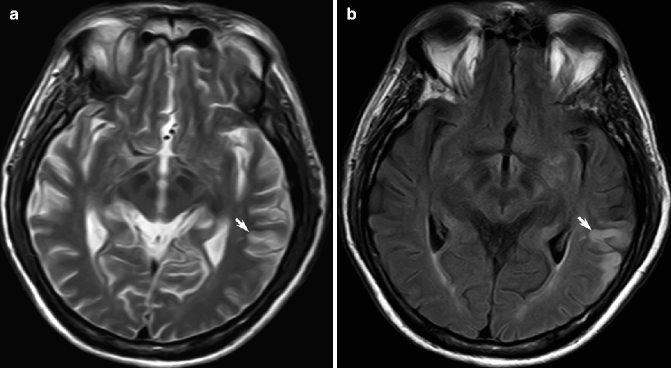

Fig. 23.9
Acute ischemic infarction on FLAIR MRI. On T2-weighted MRI, the small acute partial left MCA infarction may be appreciated as a focus of subtle cortical hyperintensity (arrow, a); the lesion is better delineated as a wedged-shaped hyperintensity on corresponding FLAIR image (arrow, b)
When the imaging appearance of cerebral infarction is atypical or when diagnosis is in doubt, the appearance of intracranial vasculature on conventional MRI may be helpful. On spin-echo T1- and T2-weighted images, loss of the normal signal void in occluded vessels may be helpful (Fig. 23.10a). The susceptibility vessel sign (of low signal intensity) is the equivalent of the dense vessel sign on CT or T2*-weighted images (Flacke et al. 2000) (Fig. 23.10b), but abnormal visibility of leptomeningeal and transcerebral vessels has also been described (Hermier et al. 2005). The latter finding may represent slow-flowing collateral arteries, which may also be detected as hyperintensities on FLAIR (due to the high contrast between hyperintense vessels and hypointense CSF) (Lee et al. 2009) and the “ivy sign” on gadolinium-enhanced T1-weighted images (which should not be mistaken for leptomeningitis) (Yoon et al. 2002) (Fig. 23.10c).
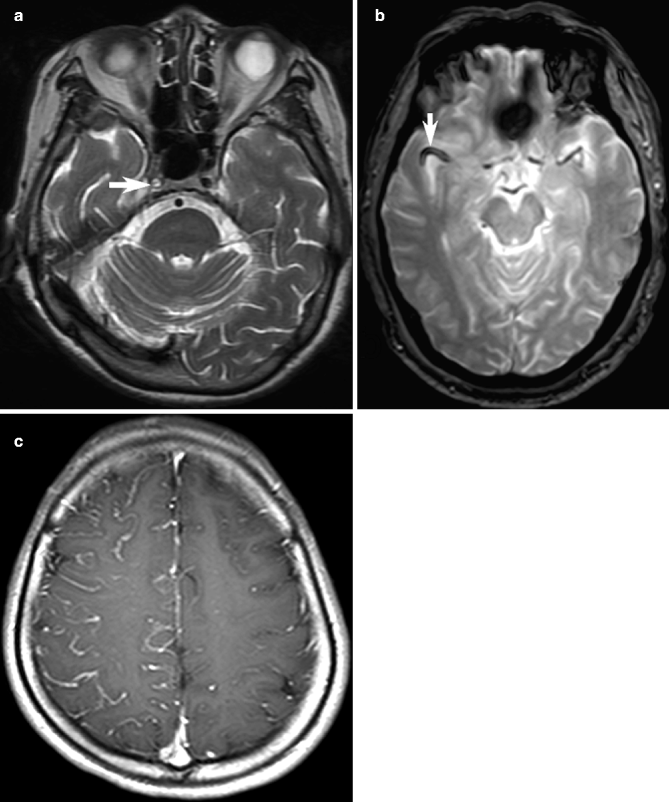

Fig. 23.10
Examples of abnormal blood vessels in acute ischemia on MRI. Loss of the normal signal void in occluded right internal carotid artery (arrow, a), with replacement by high signal thrombus, may be detected on conventional T2-weighted images. On T2*-weighted GRE image in a different patient, low signal intensity in the right MCA (arrow, b) corresponding to occlusion on MR angiography (not shown) may represent the susceptibility vessel sign. In another patient, slow-flowing right cerebral leptomeningeal collateral arteries may be seen as the “ivy sign” on contrast-enhanced T1-weighted images (c)
23.3.2.3 Subacute and Chronic Infarction
Brain swelling, effacement of ventricles, sulci and cisterns, midline shift, and brain herniation, are maximal at 3–5 days. Abnormal parenchymal enhancement, usually of the infarct periphery (Fig. 23.11a), is seen typically at 1 week and lasts up to 8 weeks but may be as early as 2 days due to reperfusion or good collateral circulation. In ambiguous cases, mass effect and contrast enhancement may be mistaken for neoplasm, and conversely, enhancing tumor can be wrongly dismissed as enhancing subacute stroke; follow-up imaging or advanced techniques such as perfusion and spectroscopy might be helpful in these patients (see Chap. 22).
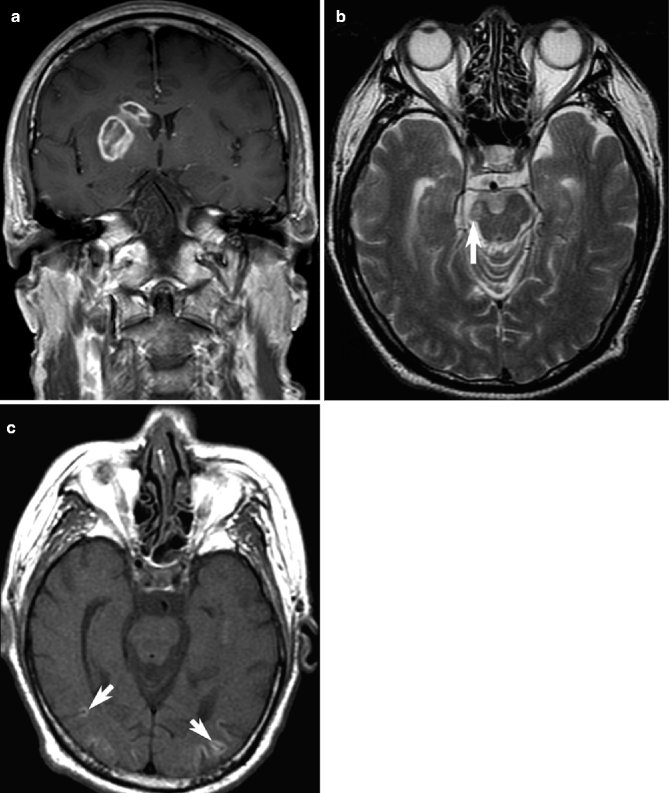

Fig. 23.11
Examples of late ischemic infarction on MRI. On contrast-enhanced axial T1-weighted images, a subacute right basal ganglia infarct may exhibit peripheral enhancement (a). Volume loss and hyperintensity of the right cortical spinal tract are seen on T2-weighted images in another patient (arrow, b), representing Wallerian degeneration after ipsilateral MCA infarction (not shown). In this patient, T1-weighted images show bilateral cortical gyral hyperintensity with overlying parenchymal volume loss representing cortical laminar necrosis (arrows, c)
In the late chronic phase of infarcted tissue, macrophages remove necrotic brain tissue and leave behind a cystic cavity with a high water content which is more sharply defined. The hyperintensity on DWI and FLAIR images resolves, but T2-weighted images remain hyperintense, with hypointensity on T1-weighted images. In patients with large chronic infarctions, there is tissue loss with ventricular, sulcal, and cisternal enlargement, and Wallerian degeneration of the ipsilateral cortical spinal tract may be seen as volume loss and hyperintensity on T2-weighted images (Fig. 23.11b). Cortical laminar necrosis (which represents selective neuronal death with lipid-rich macrophages without hemorrhage or calcification as a result of encephalopathy, status epilepticus, and hypoxic or hypoglycemic damage) may be seen as gyral hyperintensity on T1-weighted images and overlying parenchymal volume loss (Siskas et al. 2003) (Fig. 23.11c).
In elderly patients with multiple small hyperintense lesions in the subcortical white matter on T2-weighted images, it may be difficult to distinguish the recent infarction that might be responsible for current clinical symptoms from the other chronic lesions except on DWI (Singer et al. 1998) (Fig. 23.12). Leukoaraiosis, characterized by patchy or confluent periventricular and subcortical hypodensities on CT and hyperintensity on T2-weighted and FLAIR MRI, can be seen in up to 44 % of patients with stroke or TIA (Koton et al. 2009) and is likely to be a result of age-related degeneration of brain vasculature structure and disruption of local perfusion (Mitchell 2008; Qin et al. 2008). The degree of leukoaraiosis correlates with the risk of recurrent stroke and may be associated with cerebral MBs and dementia (Fu et al. 2005).
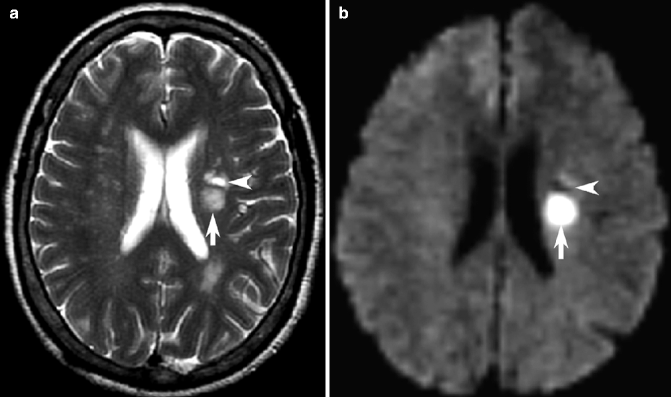

Fig. 23.12
Acute versus chronic infarction on DWI. Axial T2-weighted MRI (a) and corresponding DWI (b) showing two small lesions in the left subcortical white matter, both hyperintense on T2-weighted image but only the acute, posterior infarct is acute and hyperintense on DWI (arrows) while the anterior hypointense lesion on DWI represents chronic infarction (arrowheads)
23.3.2.4 Increased Sensitivity of DWI and the Definition of TIA
The classic 24-h definition of transient ischemic attack (TIA) based on duration of symptoms does not accurately demarcate patients with and without tissue infarction and may be misleading in that up to one third of individuals with traditionally defined TIA of transient events lasting less than 24 h actually exhibit recent infarction on DWI (Kidwell et al. 1999). Hence, it has been proposed that TIA should be a tissue-based, rather than time-based, definition and that all TIA patients should undergo neuroimaging evaluation within 24 h of symptom onset, preferably with DWI (Easton et al. 2009). Recent epidemiological studies have also detected incidental asymptomatic brain infarcts on population-based MRI studies, suggesting that the burden of cerebrovascular disease, particularly of silent strokes in the elderly, may be underestimated (Vernooij et al. 2007).
23.3.3 Hemorrhagic Transformation of Ischemic Infarction
Cerebral infarction caused by embolism, hypertensive patients, and anticoagulant or thrombolytic therapy appears to have a higher risk of hemorrhagic transformation. After intra-arterial thrombolysis, independent predictors include a high National Institutes of Health Stroke Scale score, longer time to recanalization, lower platelet count, and higher glucose level (Kidwell et al. 2002). Imaging features that may predict increased risk include infarcts greater than one third of the MCA territory on CT (von Kummer et al. 1997), larger volume on DWI, early parenchymal enhancement (Vo et al. 2003), very low cerebral blood volume, and permeability measurements on perfusion studies (Schaefer et al. 2003).
23.3.3.1 Hemorrhagic Transformation on CT and Conventional MRI
Hemorrhagic transformation may vary from clinically insignificant small petechiae to larger, symptomatic parenchymal hematoma. Reperfusion into the damaged infarct core following clot lysis leads to blood-brain barrier damage and extravasation that are visible on CT or GRE images, which have increased sensitivity especially to small amounts of paramagnetic blood breakdown products in the cortical gyrus (Fig. 23.13a). Hemorrhagic transformation of ischemic stroke may be difficult to distinguish from primary hemorrhagic stroke but typically occurs at the edge of a single arterial territory and usually shows more heterogeneity in signal or density. T1-weighted images detect methemoglobin in larger hematomas (Fig. 23.13b) but have lower resolution for small petechiae.
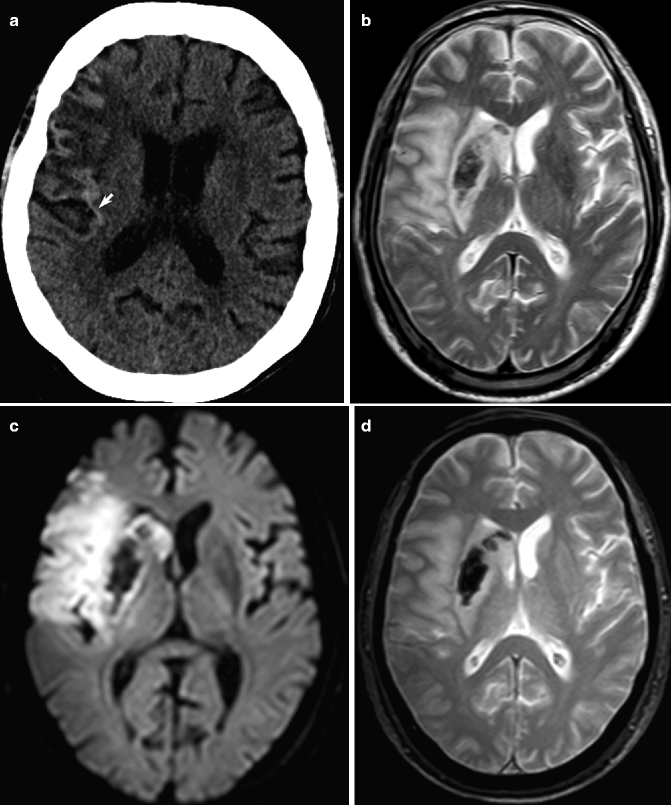

Fig. 23.13
Hemorrhagic transformation of ischemic infarction. Unenhanced CT shows increased density in the cortical gyrus (arrow, a), representing focal hemorrhagic transformation in part of the low-density right MCA territory infarction. On T2-weighted (b), GRE (c), and DWI (d) images, hemorrhagic transformation can be seen as central low density in the putamen
23.3.3.2 Hemorrhagic Transformation on DWI
The signal intensity on DWI is affected by the combination of the ADC value (from the heavily diffusion-sensitive b = 1,000 component) and the T2 and magnetic susceptibility effect (from the T2 and T2* weighting of the b = 0 echo-planar image component). Hematomas show a variety of signal intensities on DWI at various stages of acuity (Kang et al. 2001), and hyperintense hemorrhage can have similar signal intensity to acute infarction on DWI and ADC maps, requiring conventional MRI to differentiate them (Atlas et al. 2000). The T2* weighting of the b = 0 image (Fig. 23.13c–f) can better detect focal hypointense hemorrhagic transformation within an area of infarction compared to T2-weighted and FLAIR images but is still less sensitive to blood products than GRE images (Lin et al. 2001). This “T2 blackout” effect of focal hemorrhage also makes ADC calculation challenging (Silvera et al. 2005).
23.4 Vascular Imaging for Cerebrovascular Disease
23.4.1 MR Angiography in Cerebral Ischemia
MR angiography can be carried out with or without contrast injection, and hence, time-of-flight (TOF) and phase-contrast methods may be helpful for elderly patients with renal failure who might be at risk for nephrogenic systemic fibrosis (Kuo et al. 2007). In TOF-MR angiography, data are acquired in a series of overlapping thin sections suppressing stationary tissue signal and processed with a maximum intensity projection (MIP) algorithm, in which the brightest pixels represent inflow enhancement of flowing blood. Phase-contrast MR angiography is sensitive to velocity-dependent phase shifts subtracting stationary background tissue and uses velocity encoding to select for fast, intermediate, or slow flow. In contrast-enhanced MR angiography, a concentrated bolus of gadolinium contrast media is injected through an arm vein, and T1 shortening within the artery combined with techniques, such as bolus tracking or continuous fluoroscopic time-resolved techniques, closely approximates the appearance of the classic x-ray DSA standard. Three-dimensional TOF-MR angiography studies (which are less susceptible to flow-related artifacts than two-dimensional TOF due to smaller voxel size) may require 5–10 min, compared to the 10–30 s needed for contrast-enhanced MR angiography; the latter has the advantage of reduced patient movement, fewer artifacts, and improved signal-to-noise ratio (Nederkoorn et al. 2003).
Unenhanced TOF-MR angiography techniques are suitable for detecting intracranial stenoses and occlusions (Fig. 23.14a), and contrast-enhanced MR angiography, which does not overestimate the degree of stenosis, is ideal for imaging extracranial vessels (Bash et al. 2005) (Fig. 23.14c). Craniocervical arterial dissections can be detected with contrast-enhanced MR angiography plus a fat-saturated unenhanced T1-weighted MRI to depict a hyperintense subacute mural hematoma within a few days after ictus (Gelal et al. 2004). Vascular irregularity, narrowing, flow gaps, and cutoff may be seen in steno-occlusive cerebrovascular disease, with varying reconstitution of vascular signal downstream. However, not all patients will suffer complete infarction of the brain territory supplied by the occluded artery, due to the protective effect of collateral perfusion and other factors (Roberts et al. 1993). Collateral circulation is represented by alternative routes, most crucially the large caliber artery-to-artery anastomoses at the circle of Willis, but also including leptomeningeal anastomosis and those from the external carotid artery to ICA branches (Fig. 23.14, see also Sect. 23.6.1.3). The dynamic variability of the collateral status in each individual results in different morphologic and clinical outcomes even in patients with the same site of occlusion.
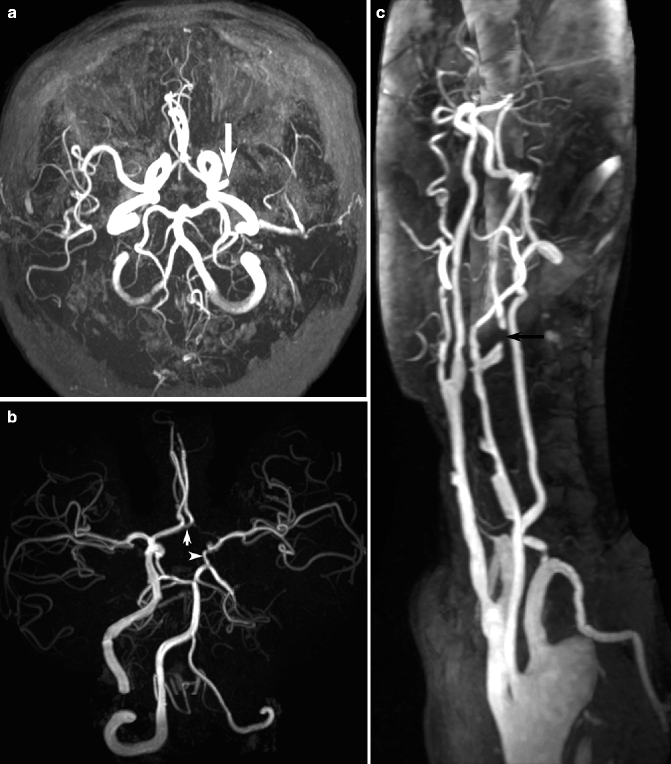

Fig. 23.14
Examples of MR angiography in cerebral ischemia. MIP of unenhanced time-of-flight intracranial MR angiography demonstrating left MCA occlusion (arrow, a). In a different patient with left ICA occlusion, Willisian collateral circulation via the anterior communicating artery to the left ACA (arrow, b) and posterior communicating artery to the left MCA (arrowhead, b) is visible. Contrast-enhanced neck MR angiography in another patient demonstrates critical stenosis of the left ICA (arrow, c) as well as multifocal atherosclerotic stenoses in the common carotid artery bilaterally and the left VA
23.4.2 CT Angiography in Cerebral Ischemia
For conventional CT stroke imaging, intravenous iodinated contrast agent is unnecessary, but once hemorrhage is excluded, multimodal evaluation of acute ischemic stroke is possible using contrast-enhanced CT angiography and CT perfusion (see Sect. 23.9.2). CT angiography can demonstrate stenosis and occlusion from atherothrombotic or embolic disease. As post-processing software improves and the number of detectors increases in multidetector CT scanners, better spatial resolution and throughput speed result in CT angiography images superior to MR angiography and rapidly approach that of DSA (Bash et al. 2005) (Fig. 23.15).
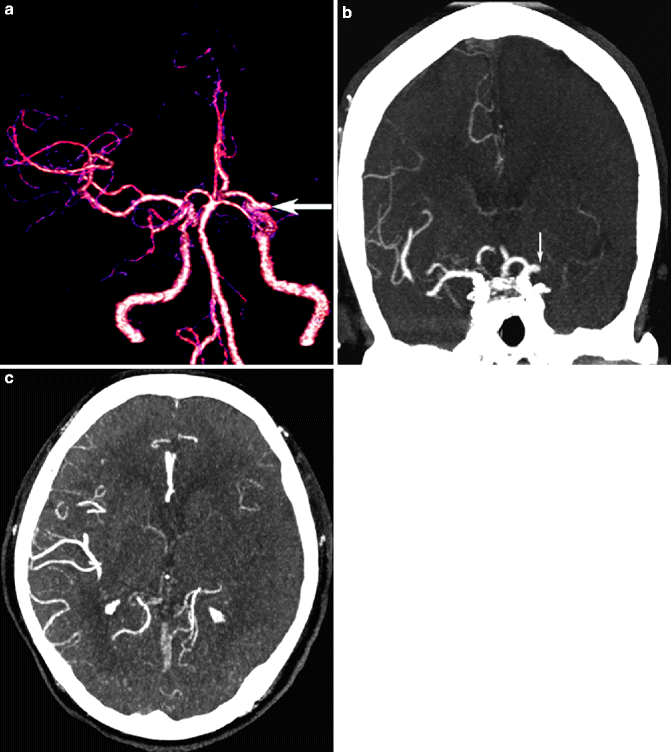
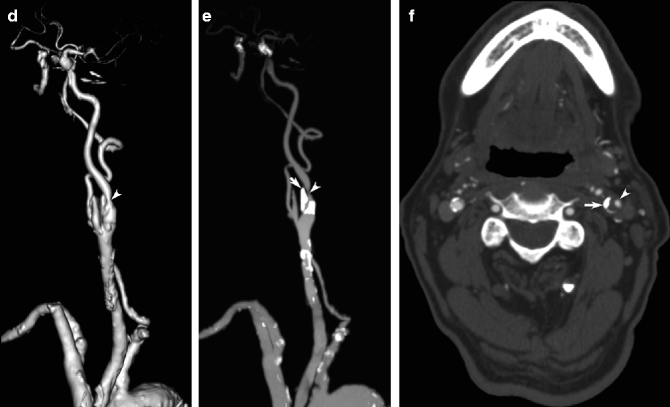


Fig. 23.15
Examples of CT angiography in cerebral ischemia. Intracranial CT angiography data may be presented as 3D shaded-surface display images to depict left MCA occlusion (arrow, a) or multi-planar reconstruction images in axial, sagittal, and coronal planes (arrow, b); CT angiography source images also demonstrate the ischemic left MCA territory with relative paucity of vascular enhancement (c). Extracranial CT angiography can demonstrate ICA stenosis on shaded-surface image (arrowhead, d), but the MIP image (e) and CT angiography source images (f) provide information about plaque density in the vessel wall (arrows) in addition to residual flow in the vessel lumen (arrowheads)
Unfortunately, CT angiography is still hampered by being a static image of vascular anatomy and has a false-positive rate for occlusion when heavy atheromatous calcifications are present (Walker et al. 2002). On the other hand, assessment of the morphological features and density of atherosclerotic plaque may be helpful to determine increased stroke risk (U-King-Im et al. 2009). CT angiography source images have also been explored as an alternative marker for infarct core and leptomeningeal collateral vessels (Wintermark et al. 2008).
23.4.3 Ultrasonography and Digital Subtraction Angiography
Doppler ultrasonography and transcranial Doppler are alternative, noninvasive, nonionizing methods of vascular imaging without the benefit of anatomical information about the brain parenchyma. Duplex sonography combines pulse-wave Doppler spectrum analysis and B-mode sonography; these methods can identify increased velocity of blood flow across a stenotic lesion (increased peak systolic velocity and end-diastolic velocity or increased ratios of ICA to common carotid artery peak systolic velocity) and display morphological features of the plaque and arterial wall (Moneta et al. 1993) (Fig. 23.16). Power Doppler imaging color-codes blood flow according to the amplitude of the Doppler signal. However, although duplex sonography is safe, inexpensive, and a useful screening tool, it overestimates the severity of stenosis and should not be used as the sole method for a definitive diagnosis (Latchaw et al. 2009). Transcranial Doppler can detect intracranial flow velocities, the direction of collateral flow, vessel occlusion, the presence of emboli, vascular reactivity, and cerebral vasospasm after SAH in the MCA, ACA, carotid siphon, vertebral artery, basilar artery, and the ophthalmic artery at the base of the brain. However, Doppler is limited to patients with suitable bony windows in the skull; it is improved by using contrast material such as saline with bubbles (Newell and Aaslid 1992).
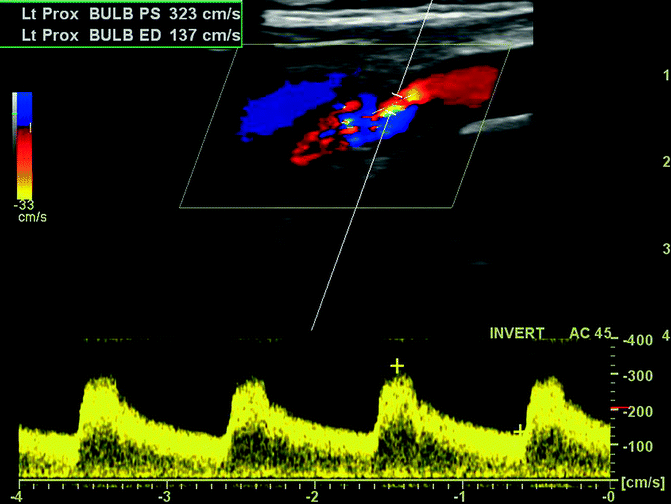

Fig. 23.16
Doppler ultrasonography. Longitudinal Doppler ultrasound of the left carotid bifurcation including color-coded directional blood flow and waveform showing increased flow velocity (presystolic velocity 323 cm/s, end-diastolic 137 cm/s) with turbulence across a 80–99 % proximal ICA stenosis (cursor) (Image courtesy of Dr. Chua Hoe Chin)
DSA provides valuable information about collateral flow, perfusion status, and other occult vascular lesions that may affect patient management and remains the most accurate technique to diagnose AVM, vasculitis, and dissection and to evaluate the degree of stenosis to determine eligibility for carotid endarterectomy or carotid angioplasty and stenting (Barr 2004). However, invasive DSA is associated with a small (<1 %) risk of serious complications, such as stroke or death, and when there is concordance of noninvasive methods, may not be necessary (Irimia et al. 2011).
23.4.4 SAH and Imaging Intracranial Aneurysm
The incidence of SAH increases with age, reaching 78 per 100,000 in the eighth decade of life; there is a female preponderance in nearly all ages (Sacco et al. 1984). MR angiography and CT angiography are both very useful for the diagnosis or screening of cerebral aneurysms larger than 5 mm, and CT angiography may be as sensitive and specific as DSA for their detection and characterization (Preda et al. 1998; Irimia et al. 2011). CT angiography is also less invasive and less resource-intensive, especially in out-of-hours on-call situations, replacing DSA as a first-line screening tool that can be performed immediately after acute SAH is detected on unenhanced CT (Fig. 23.17). Some post-processing of 3D volumetric renderings may be necessary to visualize the complex relationships of individual arteries to eliminate false positive caused by infundibula and vascular turns, since unlike DSA, selective arterial injection is not possible.
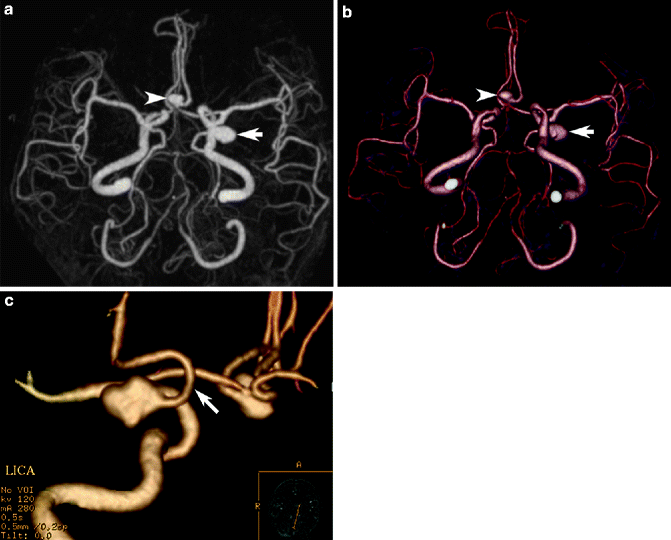

Fig. 23.17
CT angiography in cerebral aneurysm. MIP (a) and shaded-surface display (b) images of contrast-enhanced CT angiography showing ruptured posterior communicating artery aneurysm (arrows) causing SAH (not shown). Careful assessment is necessary to avoid missing second, unruptured anterior communicating artery aneurysm (arrowheads). Image post-processing may be helpful to assess the relationship of the aneurysm to the posterior communicating artery (arrow, c)
MR angiography can reliably detect aneurysms >3 mm, but sensitivity declines with size; thus, TOF and phase-contrast studies without contrast injection can be an excellent method for surveillance of incidental asymptomatic small aneurysms (annual rupture risk of 0.5–2 % compared to 4 % for symptomatic) and follow-up of patients after treatment (Locksley 1996; White et al. 2000) (Fig. 23.18). Aneurysm assessment should include demonstrating the location (typically at vessel bifurcations), number (multiple in 12–31 %, often with mirror occurrence), size, morphology, and the architecture of the neck in relation to the parent artery. MRI is also ideal for assessing the curvilinear laminated thrombi of different ages and signal intensity in giant (>2.5 cm maximum diameter) aneurysms (Atlas et al. 1987). Peripheral aneurysms are rare and may suggest mycotic infectious, traumatic, or neoplastic causes; besides the typical saccular (or berry) aneurysms, fusiform, atherosclerotic, and flow-related (associated with AVM) aneurysms may be seen.
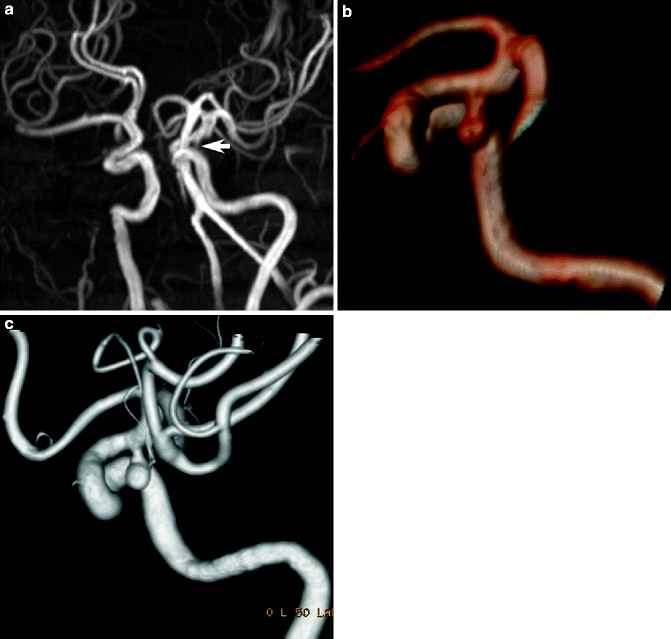

Fig. 23.18
MR angiography in cerebral aneurysm. MIP image (a) in TOF-MR angiography showing a poorly visualized asymptomatic left distal internal carotid artery aneurysm pointing inferiorly (arrow). Post-processing of the shaded-surface display image (b) to remove overlapping vessels reveals the aneurysm neck and configuration in a manner similar to corresponding 3D volumetric reconstructed DSA image (c)
23.5 Stroke Subtype and Patterns of Ischemic Stroke
Knowledge of cerebrovascular anatomy of the extra and intracranial arteries, as well as the topographical vascular supply of the brain parenchyma, is helpful to match DWI and MR angiography findings. The choice of investigation, management, prognosis (better in small-vessel infarct), and risk of recurrence (higher in cardioembolic infarct) differ according to the etiology of ischemic stroke; differentiating the stroke subtype is important to identify subgroups of patients who would benefit from acute interventions and secondary prevention treatments, as well as to accurately classify patients for multicenter research trials and databases. A frequently used system is the TOAST classification (Adams et al. 1993), wherein cerebral infarction may be divided into several subtypes: (1) large-artery/atherothrombotic infarct (15 %); (2) cardiac/aortic embolic infarct (57 %); (3) small-vessel lacunar infarct (25 %); and (4) other (3 %, including arterial dissection, arteritis, coagulopathy, and venous sinus occlusion) or undetermined causes (Smith et al. 2009


Stay updated, free articles. Join our Telegram channel

Full access? Get Clinical Tree


