Fig. 4.1
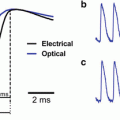
Alternatives for combined imaging using two-indicators. (a) (Left) Ideal absorption and emission spectra of two indicators with separate absorption spectra and overlapping emission spectra. Arrows indicated by “ex” and “em” are positioned over ideal excitation and emission. Rectangles indicated by “d” are in position of ideal dichroic mirrors. (Right) Optical arrangements for excitation and recording of fluorescence using either one or two light sources. (b) (Left) Same as (a) but for two indicators with overlapping absorption spectra and separate emission spectra. (Right) Optical arrangements for excitation and recording of fluorescence using either one or two light detection systems. (c) (Left) Same as (a) and (b) but for two indicators with separate absorption and emission spectra. (Right) Optical arrangements for excitation and recording of fluorescence using either one or two light sources and light detection systems
The optimization of recording signals from two indicators depends on the availability of probes with narrow excitation and emission bands. This is not the case for the available fast voltage sensitive dyes. Most of the styryl voltage dyes are characterized by a broad excitation spectrum in the visible range and a broad emission spectrum in the red-IR region (Fluhler et al. 1985). Figure 4.2 shows the absorption and emission spectra of the hydrophobic voltage-sensitive dye di-8-ANEPPS which are similar to those of di-4-ANEPPS and of the water soluble indicators JPW-1114 (di-2-ANEPEQ) and JPW-3028 (di-1-ANEPEQ) all based on the same chromophore. Similar spectral properties are also shared by many of the commonly used “RH” dyes such as RH-795, RH-237, RH-421 and RH-414. With these dyes, well separated spectra are difficult to obtain using commercially available Ca2+ indicators excited in the visible spectral range. Nevertheless, the combined recordings are still possible due to a large Stokes shift of charge-shift voltage probes (~150 nm). In addition, more efficient combined recordings can be achieved using Ca2+ indicators excited in the UV spectral range.
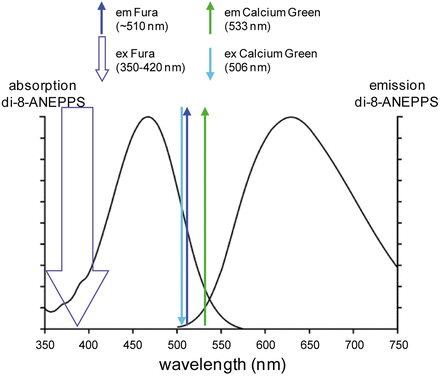

Fig. 4.2
Absorption and emission spectra of di-8 ANEPPS in combination with the ideal absorption and emission of Calcium Green and Fura calcium indicators. Left and right curves are the absorption and emission spectra as reported by Invitrogen—Molecular Probes. The thick downward arrow represents the excitation of the ratiometric indicator Fura. The thin downward arrows represent the excitation peak of Calcium Green. The upward arrows represent the emission peaks of the two indicators
Both voltage dyes and Ca2+ indicators can be loaded into cells either by extracellular bath application of the indicator or by intracellular injection using either a patch-electrode or a sharp microelectrode. For extracellular loading, Ca2+ dyes are commercially available in membrane-permeant AM-ester form. Once in the cell, the acetyl-ester is hydrolyzed by the endogenous esterases and the released free indicator remains in the cytoplasm (Yuste 2000). For intracellular loading, Ca2+ indicators are available as water-soluble potassium salts. When injected into cells from a patch electrode, the dye can quickly equilibrate in the cytosol at a given concentration permitting quantitative estimate of Ca2+ signals (Eilers and Konnerth 2000). In general, intracellular loading of the Ca2+ indicator is done in conjunction with the intracellular loading of the voltage sensitive dye. It is also possible to load the cell with the voltage sensitive dye first and include the Ca2+ indicator in the pipette used for re-patching the labeled cell. In this protocol, Vm imaging is carried out first, immediately after re-patching, during which time the cell is loaded with the Ca2+ indicator from the recording pipette.
3 Combining Vm and Ca2+ Imaging
3.1 Combining Vm and Ca2+ Imaging in Sequential Way
Commonly used voltage sensitive dyes such as di-4-ANEPPS, di-8-ANEPPS and Di-2-ANEPEQ (JPW-1114) have wide excitation spectrum in the blue/green region and wide emission spectrum in the red/IR region (Fig. 4.2). If combined with Fluo, Calcium Green or Oregon Green Ca2+ indicators, both dyes can be excited by a blue wavelength (which, however, is not optimal for the voltage-sensitive dye) and green (Ca2+) and red (Vm) fluorescence can be recorded separately. Voltage sensitive dye excitation is optimal at 532 nm (Canepari et al. 2010). Thus, if combined with UV-excitable Fura indicators, the voltage-sensitive dye can be excited at its optimal visible wavelength and, as with the previous combination, the two emission signals can be recorded separately.
Although both types of combinations allow simultaneous measurement of Vm and Ca2+ fluorescence, many studies were initially performed through sequential recordings of the two optical signals. Combined Vm and Ca2+ imaging from individual neurons using blue-excitable/green-emitting Ca2+ indicators has been also used in several other studies. In the barrel cortex, the high-affinity indicator Oregon Green BAPTA-1 was combined with the voltage sensitive dye JPW-1114 in recordings from individual neurons and with the voltage indicator RH-1691 in in vitro and in vivo network recordings (Berger et al. 2007). In prefrontal cortical neurons, dendritic recordings were obtained combining JPW-1114 either with the high-affinity Ca2+ indicator Calcium Green-1 or with the low-affinity Ca2+ indicator Fluo-5F (Milojkovic et al. 2007).
The use of UV-excitable Fura indicators minimizes the spectral overlap with the voltage-sensitive dye. Additionally, the voltage-sensitive dye is not excited during Ca2+-imaging preventing a substantial photodynamic damage that can occur during relatively long recording periods (Canepari et al. 2008). UV-excitable Fura indicators with different equilibrium constants (Kd) are commercially available (see Table 4.1). This permits the choice of the most suitable indicator for the measurement of either the Ca2+ influx (high-affinity indicator) or the change in intracellular free Ca2+ concentration (low-affinity indicator).
Table 4.1
Dissociation constants and buffering capacities of Fura dyes
Dye | Kd (μM) | K dye (300 μM) | K dye (1 mM) |
|---|---|---|---|
Fura-2 | 0.224a | ~1,300 | ~4,500 |
Fura-5F | 0.4a | ~750 | ~2,500 |
Bis-fura-2 | 0.525a | ~570 | ~1,900 |
Fura-4F | 0.77a | ~390 | ~1,300 |
Fura-6F | 5.3a | ~57 | ~190 |
Fura-FF | 10b | ~30 | ~100 |
Mag-fura-2 | 25c–40d | ~7.5–12 | ~25–40 |
In contrast to the indicators excited in the visible range, Fura indicators allow ratiometric measurements. When excited above their isosbestic wavelength (~360 nm), the changes of fluorescence associated with an increase in Ca2+ concentration are negative. Imaging above the isosbestic wavelength has several advantages. First, the resting fluorescence, which corresponds to nominally 0 Ca2+, is significantly higher than with dyes that increase their fluorescence with Ca2+. Second, the achievable imaging contrast is high because healthy cells are characterized by very low resting Ca2+, and the dye in adjacent structures, exposed to millimolar Ca2+ concentrations, is essentially not fluorescent. Third, since the dynamic range of the fluorescence is ~1 after subtraction of fluorescence at saturating Ca2+, these measurements allow a better quantitative estimation of the Ca2+ signals. An example of Vm and Ca2+ optical signals recorded sequentially from the two indicators in three different regions on the dendritic tree of a Purkinje neuron stained by JPW-1114 and Fura-FF is illustrated in Fig. 4.3. Using an excitation band of 387 ± 5 nm for Fura-FF (Fig. 4.3a), the Ca2+ increase associated with a climbing fibre excitatory postsynaptic potential (EPSP) corresponds to a negative ΔF/F0 (Fig. 4.3b). Sequential Vm and Ca2+ recording using Fura Ca2+ indicators has been done in CA1 hippocampal pyramidal neurons (Canepari et al. 2007), in prefrontal cortex layer-5 pyramidal neurons (Milojkovic et al. 2007) and in cerebellar Purkinje neurons (Canepari and Vogt 2008). Sequential recording (as well as signal averaging) is meaningful only if repeated application of the same stimulation protocol results in the same response. This requirement must be confirmed experimentally by comparing individual recordings as shown in Fig. 4.3c. In this example, the Vm and the Ca2+ optical signals were recorded from a dendritic location on a cerebellar Purkinje neuron in response to four repetitions of climbing fibre activation separated by 1 min. The results showed that signals were practically identical in four individual trials (gray traces) permitting the correlation of Vm and Ca2+ optical signals recorded sequentially in response to the same stimulus.
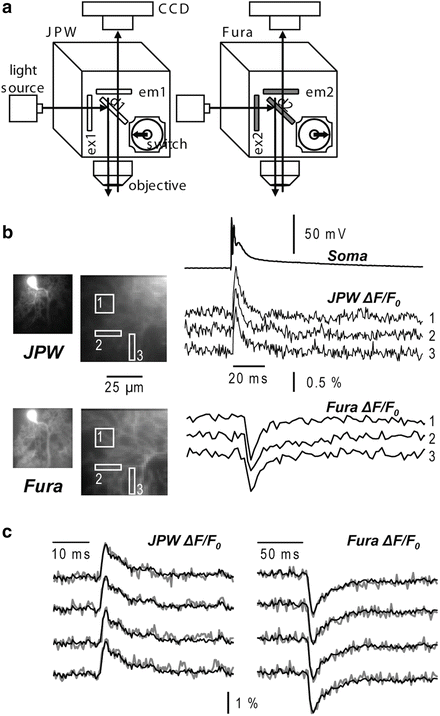

Fig. 4.3
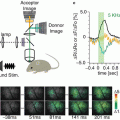
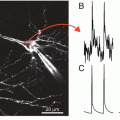
Combining Vm and Ca2+ imaging using JPW-1114 and a UV excitable Ca2+ indicator. (a) Schematic of the imaging apparatus for sequential Vm and Ca2+ imaging using a Fura indicator. Filters for voltage-sensitive dye (JPW): ex1 = 525 ± 25 nm, d1 > 570 nm and em1 > 610 nm. Filters for Ca2+ indicator (Fura): ex2 = 387 ± 6 nm, d1 > 470 nm and em1 = 510 ± 42 nm. (b) Vm and Ca2+ fractional changes of fluorescence from cerebellar Purkinje neuron dendrites related to a climbing fibre EPSP recorded from the locations 1–3 reported in the fluorescence images on the left. Somatic recording of the climbing fibre EPSP is the upper trace. (c) Individual Vm (left) and Ca2+ (right) fractional changes of fluorescence (gray traces) related to a climbing fibre EPSP. Superimposed black traces are the averages of the four trials
An important aspect of combined Vm and Ca2+ imaging is the interpretation of Ca2+ optical signals, which depends on how much the Ca2+ indicator perturbs the physiological Ca2+ homeostasis. The buffering capacity of a Ca2+ indicator, K dye , defined as the ratio between the dye-bound Ca2+ and the free Ca2+ in the presence of the indicator depends on the dissociation constant and on the concentration of the indicator (Table 4.1). The perturbation of the physiological Ca2+ introduced by the Ca2+ indicator can be evaluated by comparing the parameter K dye with the endogenous buffering capacity of the cell (K cell ). The interpretation of Ca2+ optical signals is simplified when K dye is either much larger or much smaller than K cell , i.e. when most of Ca2+ binds to the indicator or when the fraction of Ca2+ bound to the indicator is negligible compared to the total Ca2+ (Canepari et al. 2008). Without addressing in detail the issue of calibration of Ca2+ optical signals (Neher 2000) in this volume focused on Vm imaging, we will note that, in the first case, the ΔF/F0 signal associated with Ca2+ increase is approximately linear with the total intracellular Ca2+ signal. In the second case, the time course of the ratio (F − Fmin)/(Fmax − F), where Fmin and Fmax are the fluorescence intensities at 0 and saturating Ca2+ respectively, is linear with the physiological intracellular free Ca2+ concentration change (Δ[Ca2+]i). In many instances, Ca2+ signals are due to Ca2+ influx through a Ca2+ channel in the plasma membrane. The contribution to the change in membrane potential due to the Ca2+ influx depends on the Ca2+ permeability of the channel relative to its permeability to other ions, in particular to Na+ and K+. This is different for VGCCs, AMPA receptors, NMDA receptors and other Ca2+ permeable pores such as transient receptor potential (TRP) channels. Vice-versa, because opening or unblocking of Ca2+ channels often depends, in a non-linear manner, on the local membrane potential, the Ca2+ influx is often, but not always, larger when the voltage related depolarizing optical signal is larger (Canepari et al. 2007). Because this bi-directional relationship is complex, the analysis of Vm and Ca2+ signals from multiple sites on individual neurons is not straightforward and requires careful interpretation.
A notable application of combined Vm and Ca2+ imaging is the study of synaptic plasticity where the supra-linear Ca2+ signal plays an important role. The supra-linear Ca2+ signal occurs when two stimulation protocols are combined to evoke the coincident activity (pairing protocol) which results in a Ca2+ signal that is larger than the sum of the two Ca2+ signals associated with the application of individual stimulation protocols. A supra-linear Ca2+ signal is always caused by a supra-linear Δ[Ca2+]i, but not necessarily by a supra-linear Ca2+ influx through the plasma membrane. Indeed, the supra-linear Ca2+ signal might be caused by Ca2+ release from internal stores or by the saturation of the endogenous Ca2+ buffer. However, in the latter case, if the buffering capacity of the dye dominates over the endogenous buffering capacity of the cell and the dye is not saturated, the presence of the indicator will cancel the supra-linear Δ[Ca2+]i and no Ca2+ dependent ΔF/F0 will be observed. Thus, in these conditions, detection of supra-linear Ca2+ dependent ΔF/F0 signals which are not due to Ca2+ release from internal stores always corresponds to a supra-linear Ca2+ influx and it must always correlate with an increase in the depolarizing Vm signal. In contrast, if the buffering of the dye is negligible compared to the endogenous buffering of the cell, a supra-linear Δ[Ca2+]i signal that is due to the saturation of the endogenous Ca2+ buffer can be measured reliably. The two different types of supra-linear Ca2+ signals not involving Ca2+ release from stores are illustrated by the two following examples.
In measurements from CA1 hippocampal pyramidal neurons (Canepari et al. 2007), cells were loaded with the voltage-sensitive dye JPW-3028 and 300 μM Bis-Fura-2. The purpose of these experiments was to analyze, over large regions of the dendritic tree, the Vm and Ca2+ optical signals associated with back-propagating action potentials, with excitatory postsynaptic potentials (EPSPs) and with pairing of these two membrane potential transients using an LTP induction protocol. Pyramidal neurons in the CA1 region are characterized by relatively low endogenous buffering capacity in the dendrites (~100) and even lower buffering capacity (~20) in the spines (Sabatini et al. 2002). Thus, the buffering capacity of 300 μM Bis-Fura-2 (Kd ~500 in the presence of Mg2+, see Table 4.1) is ~6 times larger than the buffering capacity of the dendrite and ~30 times larger than the buffering capacity of the spine. Ca2+ signals associated either with back-propagating action potentials or with EPSPs were mediated by Ca2+ influx through voltage-gated Ca2+ channels and/or through NMDA receptors. As shown in Fig. 4.4a, the pairing of the two stimulating protocols elicited a supra-linear Ca2+ signal. In the presence of the NMDA receptor blocker AP-5, since the measurements were done using a non-saturating concentration of a high-affinity indicator, the supra-linear Ca2+ signal must have been caused by supra-linear Ca2+ influx mediated by recruitment of additional VGCCs. In agreement with this expectation, at each site where a supra-linear Ca2+ signal was observed, the Vm related optical signal during the pairing protocol had a larger peak depolarization compared to the signals associated with unpaired stimulations (Fig. 4.4a).
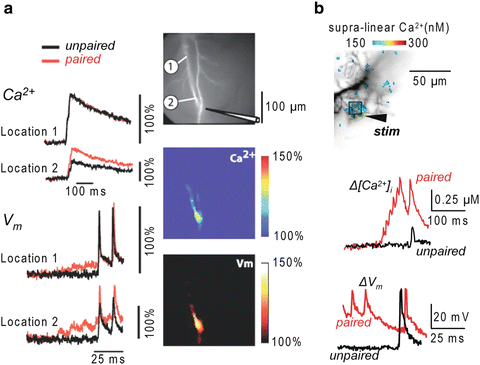

Fig. 4.4
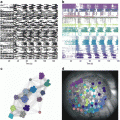
Combining Vm and Ca2+ imaging using high- and low-affinity Fura indicators. (a) (Left) Ca2+ and Vm fractional changes of fluorescence corresponding to back-propagating action potentials (bAPs) and paired EPSP–bAP signals from two locations on the dendritic tree of a CA1 hippocampal pyramidal neuron. Signals are superimposed to reveal the region-specific increase in peak depolarization during paired activity. (Right) Fluorescence image of the dendritic arbor of three hippocampal pyramidal neurons. The stimulating electrode is indicated schematically. (Middle and bottom panels) Color-coded spatial maps of the Ca2+ signal and of the Vm signal during paired activity respectively; signals were scaled using the signals in unpaired conditions. Experiments are in the presence of the NMDA receptor blocker AP-5. Supra-linear Ca2+ correlated with larger depolarization. Reproduced from Canepari et al. 2007 with the permission of Wiley-Blackwell. (b) (Top) Recorded dendrites of a cerebellar Purkinje neuron; supra-linear Δ[Ca2+]i from the difference between Δ[Ca2+]i associated with the pairing protocol and Δ[Ca2+]i associated with the unpaired PF-EPSPs and CF-EPSP in color-coded scale. (Bottom) Δ[Ca2+]i and ΔV m from the region square region depicted above associated with one unpaired (black traces) and one paired CF-EPSP. Supra-linear Ca2+ is not associated with larger depolarization. Modified from Canepari and Vogt 2008
In measurements from cerebellar Purkinje neurons (Canepari and Vogt 2008), cells were loaded with 1 mM of the Ca2+ indicator Fura-FF and with the voltage sensitive dye JPW-1114. Purkinje neurons have an exceptionally high dendritic K cell estimated at ~2,000 (Fierro and Llano 1996). Therefore, the addition of a low affinity Ca2+ indicator such as Fura-FF (Kd ~10), even at millimolar concentrations, does not significantly alter the physiological homeostasis and it is possible to record changes in free intracellular Ca2+ concentration (Δ[Ca2+]i signals Canepari et al. 2008). In this particular preparation, it was possible to calibrate Vm signals in terms of membrane potential. As shown in Fig. 4.4b, pairing the stimulation of the large climbing fibre synaptic potential with local parallel fibres stimulation generated a local dendritic supra-linear Δ[Ca2+]i signal which was independent of Ca2+ release from stores (Brenowitz and Regehr 2005). Although the Δ[Ca2+]i signal originated from Ca2+ influx through VGCCs, in Purkinje neurons, in contrast to CA1 pyramidal neurons, the Vm signal during the pairing protocol did not have larger peak depolarization compared to the Vm signals associated with unpaired stimulations (Fig. 4.4b). In this case the Ca2+ influx associated with the climbing fibre synaptic potential was the same in paired and unpaired conditions. The corresponding Δ[Ca2+]i signal, however, was larger following paired stimulation because the Ca2+ influx associated with the parallel fibre stimulation locally and transiently saturated the endogenous Ca2+ buffer (Canepari and Vogt 2008). This supra-linear Ca2+ signal could be correctly interpreted only when recorded using a low-affinity indicator. When the cell was injected with 10 mM Bis-Fura-2, K dye became ~10 times larger than K cell and supra-linear Ca2+ signals were abolished (Canepari and Vogt 2008).
3.2 Simultaneous Vm and Ca2+ Imaging
Sequential Vm and Ca2+ imaging produce valid results if identical responses are evoked in repetitive measurements. Many physiological processes, however, are stochastic, showing large trial-to-trial variability. In these cases, the study of the time variability contains important biological information and simultaneous Vm and Ca2+ optical measurement is required. Simultaneous Vm and Ca2+ imaging was initially achieved using the Ca2+ indicator Calcium Orange, which has excitation peak at ~550 nm and emission peak at ~580 nm (Sinha et al. 1995; Sinha and Saggau 1999), or with blue-excitable indicators (Bullen et al. 1997; Bullen and Saggau 1998). These possibilities may have, however, some inherent problems. First, the small overlap between the emission spectra of the two dyes may produce a “bleeding” of the Vm signal into the Ca2+ recording channel that contaminates the signal. In some situations, such emission cross talk can be mathematically corrected (Sinha et al. 1995). Second, while Vm recordings of synaptic or action potentials can be often achieved within short time, the complete time-course of the corresponding Ca2+ signal may require longer acquisition intervals (Canepari and Vogt 2008). In this case, the voltage sensitive dye is exposed to high intensity light for a longer time than what would be required for the Vm measurement alone, increasing both bleaching of the dye and phototoxicity. Simultaneous Vm and Ca2+ imaging was also performed using the combination of an absorption voltage sensitive dye with a fluorescent Ca2+ indicator. Using bath application of the absorption dye RH-482 and a low-affinity Ca2+ indicator Magnesium Green, Sabatini and Regehr could correlate the Ca2+ signal underlying synaptic release with the excitation of pre-synaptic terminals in cerebellar synapses (Sabatini and Regehr 1996; Sabatini and Regehr 1997). In these experiments, simultaneous Ca2+ and Vm measurements were done by using excitation light wavelength of ~500 nm and recording simultaneously fluorescence from the Ca2+ indicator Magnesium Green and the transmitted light from voltage-sensitive dye RH-482 at 710 nm from a single location with two photodiodes. The important limitation of this approach is that the absorption measurements from multiple sites on individual neurons are substantially less sensitive compared to fluorescence measurements (Antic and Zecevic 1995). In the above example, extensive temporal and spatial signal averaging over a large region of the cerebellar slice, which could be obtained with absorption signals, permitted signal detection from presynaptic terminals (Sabatini and Regehr 1997).
Stay updated, free articles. Join our Telegram channel

Full access? Get Clinical Tree


