Conventional MR imaging refers to techniques that are readily available and widely used in the diagnosis and monitoring of individuals with multiple sclerosis (MS). MR imaging is helpful in establishing an early diagnosis of MS after a single clinical event consistent with demyelination. A standardized imaging protocol is invaluable for diagnosis and monitoring disease evolution and response to treatment over time. The characteristic lesions of MS are varied and not always evident at the earliest stages of the disease. Furthermore, MR imaging is highly sensitive for detecting these lesions but remains pathologically nonspecific. Careful communication among clinicians and radiologists will optimize the interpretation of important abnormalities on MR imaging.
Multiple sclerosis (MS) is a common disease and is the leading cause of nontraumatic disability in young adults. Most patients have a relapsing and remitting disease course (RRMS) characterized by acute exacerbations of inflammatory demyelination (attacks or relapses), including optic neuritis, transverse myelitis, and brainstem syndromes. A small proportion will present with a slowly evolving neurologic syndrome, typically a progressive myelopathy or cerebellar syndrome (primary progressive MS [PPMS]). Establishing an early and accurate diagnosis of MS allows for the initiation of therapies that can prevent future attacks of central nervous system (CNS) inflammation and potentially impact long-term disability. No single test is diagnostic for MS, including MR imaging of the brain, which, although extremely sensitive for detecting lesions typical of MS, lacks pathologic specificity. Where MR imaging technology is available, it would be rare for an individual with MS or suspected MS not to undergo brain and possibly spinal MR imaging as part of their diagnostic work-up or routine follow-up.
Conventional MR imaging refers to techniques routinely used in clinical practice, including T1 (T1W) and T2 (or similar) weighted (T2W) sequences and the use of contrast agents. The goals of conventional imaging in MS can be summarized as follows:
- 1.
Routine investigation in patients with symptoms suspicious for MS
- 2.
To establish an early diagnosis of MS in high-risk patients who have had a single clinically isolated syndrome (CIS) of definite demyelination such as optic neuritis, transverse myelitis, or brainstem/cerebellum inflammation
- 3.
To rule out alternative diagnoses that are clinical or radiologic mimics of MS
- 4.
To predict the short- and long-term clinical prognosis
- 5.
To monitor the response to disease-modifying therapy
- 6.
To monitor for complications of therapy
Conventional MR imaging techniques also serve an important role as robust, quantitative outcome measures in clinical trials of new therapies. This topic is covered in further detail elsewhere in this issue. This review includes a standardized imaging protocol for the diagnosis and monitoring of MS patients, a description of typical and unusual features of MR imaging in MS, imaging features for unique MS populations including pediatric MS, and the role of MR imaging in the diagnosis and routine follow-up of MS patients.
Standardized MR imaging protocol
MR imaging is the most important paraclinical test for the diagnosis of MS; however, inconsistent protocols can undermine its usefulness. An expert panel of radiologists and neurologists with experience in the clinical diagnosis and management of MS has established a basic minimum set of imaging sequences that are recommended in the investigation of suspected MS. Furthermore, the Consortium of MS Centers standardized MR imaging guidelines provide a consistent protocol that allows for comparison of imaging studies over time for an individual patient on the same scanner or across scanners ( Table 1 ). This protocol improves the accuracy and reliability for detecting new disease activity that many clinicians rely on for early diagnosis and for ongoing treatment decisions.
| Brain MR Imaging Sequence | Diagnostic Scan for Clinically Isolated Syndrome | New Baseline or follow-up Scan in Definite MS | Comment |
|---|---|---|---|
| Three-plane scout | Recommended | Recommended | Axial sections through the subcallosal line (joins the undersurface of the rostrum and splenium of the corpus callosum) |
| Sagittal FLAIR | Recommended | Recommended | Useful for corpus callosum lesions |
| Axial fast spin or turbo spin-echo PD/T2 | Recommended | Recommended |
|
| Axial FLAIR | Recommended | Recommended | Useful for most white matter lesions including juxtacortical |
| Axial precontrast T1 | Optional | Optional | Useful for T1 black hole assessment |
| Three-dimensional T1 | Optional | Optional | Useful for brain volume measures |
| Axial postcontrast T1 | Recommended | Optional | Minimum 5-min delay using a standard dose |
| Spinal cord MR imaging sequence | Spinal cord MR imaging following contrast-enhanced brain MR imaging (no further contrast is needed) sequence | ||
| Three-plane localizer | Three-plane localizer | ||
| Precontrast sagittal T1 | Postcontrast sagittal T1 | ||
| Sagittal fast spin-echo PD/T2 | Sagittal fast spin-echo PD/T2 | ||
| Axial fast spin-echo PD/T2 through lesions | Postcontrast axial T1 through lesions | ||
| Three-dimensional T1 (optional) | Axial fast spin-echo PD/T2 through lesions | ||
| Postcontrast sagittal T1 | Three-dimensional T1 (optional) | ||
| Postcontrast axial T1 through lesions | |||
The minimum sequences that should be included for an MR imaging study of the brain are as follows: axial T2 (echo time [TE], 80–120 ms) and PD (TE, 15–40 ms) weighted, axial fluid-attenuated inversion recovery (FLAIR), axial pre- and postcontrast T1W, and sagittal FLAIR (covering the corpus callosum). Lesion intensity increases with longer TE. Posterior fossa lesions are best seen on T2W images, and FLAIR or PD is preferred for periventricular and juxtacortical lesion detection. A slice thickness of 3 mm or less with no gap (contiguous) provides for improved lesion detection and may compensate for smaller lesions being missed by edge blurring associated with fast acquisition techniques. Standardized acquisition of axial images parallel to the subcallosal line that joins the genu and splenium of the corpus callosum is important for comparison across serial studies.
Contrast can be helpful in establishing an early diagnosis by detecting new lesion activity and ruling out alternative diagnoses. A standard dose of gadolinium (Gd) (0.1 mmol/kg) with a minimum 5-minute delay after injection is given before acquiring the postcontrast T1W sequences. There can be potential advantages of higher (double or triple) doses of contrast, using a longer (15-minute) delay before collecting the postcontrast T1W images and incorporating a magnetization transfer sequence to increase the number and intensity of contrast-enhancing lesions; however, these modifications are not essential for routine clinical imaging. In general, because newly diagnosed MS patients tend to be young (between the ages of 20 and 40 years), and because MS is not usually associated with renal disease, the use of Gd would not be contraindicated owing to concern regarding nephrogenic systemic fibrosis and Gd contrast administration in patients with decreased renal function.
Spinal cord imaging can be extremely helpful in the diagnostic work-up of suspected MS. A phase array coil is recommended, and, depending on the symptoms, coverage may include both cervical and thoracic cord. Sagittal sequences include pre- and postcontrast T1W and fast spin-echo PD/T2 with a slice thickness of 3 mm or less (contiguous). Axial PD/T2 and postcontrast T1W are acquired through suspicious lesions. If spinal cord imaging is to be performed at the same time as brain MR imaging, no additional contrast is required.
Most centers use a field strength of 1.5 T or greater. More lesions can be detected at higher field strengths which, in some situations, may allow for an earlier diagnosis of MS. The minimum recommended field strength is 1.0 T; however, lesion detection in some older 0.5 T systems has been similar to that seen at 1.5 T. It is recommended that the patient keep a copy of their study on portable media should they move to an area with a different center. A comparison of studies over time allows for a better understanding of individual lesion evolution, resolution, and the behavior of contrast enhancement that may aid in diagnostic interpretation or therapeutic strategies.
Imaging features of typical lesions in multiple sclerosis
T2 lesions on brain MR imaging are characteristic of well-established, definite MS ( Fig. 1 A—H ), and the absence of these lesions should lead to careful reevaluation of the diagnosis. Early in the disease course at the time of the first clinical symptoms (CIS), approximately 20% of patients in whom MS will develop within the next 5 to 20 years will have a normal brain on MR imaging initially. Even patients who have definite MS after sustaining two clinical attacks may have a paucity of lesions that do not meet current radiologic criteria for MS. This finding is more common in MS subgroups, including Asian opticospinal MS (OSMS) and variants such as neuromyelitis optica (NMO) or Devic’s disease; therefore, an MR image of the brain with minimal abnormalities does not rule out the diagnosis of MS but may necessitate further supportive investigations including evoked potentials, cerebral spinal fluid (CSF) analysis, spinal cord imaging, anti–aquaporin-4 antibody testing, and follow-up brain MR imaging as symptoms evolve over time.
Postmortem studies in MS subjects have validated that MS plaques correspond to the hyperintense lesions seen on T2/PD and FLAIR images. They appear higher in signal intensity (or bright) because of longer T2 relaxation times (see Fig. 1 A–C). T2 lesions are not specific for plaque age, the degree of myelin and axon loss, or the amount of edema and inflammation. Loss of myelin creates a more hydrophilic environment, and the increased water gives a brighter T2/PD signal and a darker T1W appearance. Infections, ischemia, tumors, and other causes of inflammation also affect lesion water content and can cause similar MR imaging signal changes, limiting the specificity for any individual lesion.
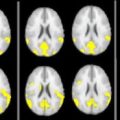
MS lesions vary in size and location and have a periventricular predominance. It would be unusual to have sparing of this region in MS. The lesions typically develop in a perivenular pattern as immune cells migrate across the blood-brain barrier and induce a cascade of inflammation and demyelination. These areas may appear as Dawson fingers or elongated flame-shaped lesions best seen on sagittal FLAIR images oriented along subependymal veins in the corona radiata and centrum semiovale, perpendicular to the walls of the ventricle ( Fig. 1 D). Lesions can occur in any structure containing myelin, including the cortex. Cortical plaques occur commonly in MS but are difficult to see on MR studies, even with special sequences, owing to similarities in signal intensities of MS lesions and grey matter and the partial volume effects of CSF within the adjacent sulci. Lesions are often seen in the temporal lobes, grey-white matter junction (juxtacortical) ( Fig. 1 G), brainstem, cerebellum ( Fig. 1 F), optic nerves, and spinal cord. Corpus callosum lesions occur frequently in all stages of MS, ranging from 51% of CIS patients to 93% of MS patients compared to only 2% of patients with white matter disease due to other causes. Some non-MS disorders in which involvement of the corpus callosum has been reported include stroke, cerebral autosomal dominant arteriopathy with subcortical infarctions, lymphoma, Sjogren’s disease, and progressive multifocal leukoencephalopathy ( Fig. 2 ).
Four percent of healthy individuals of all ages can have periventricular changes that cannot be distinguished from MS. With increasing age, nonspecific MR imaging abnormalities (unidentified bright objects [UBOs]) become increasingly common. These objects are more frequent in women, and a few small UBOs are common by the early to mid-forties. UBOs are usually isointense on T1W sequences, whereas approximately 30% of MS lesions appear hypointense (dark or so-called “black holes”) on T1W sequences. Patients with chronic hypertension can have confluent white matter lesions indistinguishable from those seen in patients with long-standing MS. Normal structures can also be misinterpreted as false-positive lesions, including flow artifacts, volume averaging between slices, and enlarged perivascular Virchow-Robin spaces. Virchow-Robin spaces usually appear as punctuate white matter lesions and commonly occur in the lower third of the corpus striatum, the midbrain, and caudal to the lenticular nucleus Cases of giant perivascular spaces have also been reported (see Fig. 2 H).
The addition of T2W gradient echo images to detect hemosiderin-related susceptibility changes from occult hemorrhage may be helpful when CNS vasculitis is also under consideration. The diagnosis of primary CNS vasculitis, also known as primary angiitis of the CNS (PACNS), is one of the most challenging problems in clinical neurology. The pathology of PACNS is a segmental necrotizing vasculitis. Leptomeningeal and cortical vessels are predominantly involved, especially small vessels 200 to 500 μm in diameter and precapillary arterioles less than 200 μm in diameter. T2 hyperintense lesions consistent with ischemia or infarction may be seen, particularly involving the subcortical white matter, deep white matter, or deep grey matter in the territory of small- to medium-sized vessels. The cerebral hemispheres are affected more often than the posterior fossa; however, these findings are nonspecific, and the differential diagnosis of multiple T2 hyperintense lesions is a lengthy one. Occult hemorrhage can be seen in approximately 10% of patients with PACNS on T2W gradient echo images. This hemorrhage usually consists of single or multiple punctuate areas of signal void in the subcortical or deep white matter, representing hemosiderin.
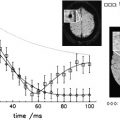
An MS relapse refers to an episode of neurologic disturbance of the type seen in MS when clinicopathologic studies have established that the causative lesions are inflammatory and demyelinating in nature. T2W imaging techniques (ie, T2W, PD, or FLAIR) are the most sensitive conventional technique for detecting MS plaques but do not distinguish between acute and chronic lesions. The MR imaging correlate of new disease activity is the appearance of Gd enhancement on the postcontrast T1W image and new or enlarging T2 lesions ( Fig. 3 ). Gd does not normally cross the intact blood-brain barrier. New MS lesions pathologically coincide with disruption of the blood-brain barrier and inflammation and appear on T1W imaging as Gd-enhancing lesions. Weekly MR imaging studies demonstrate that Gd enhancement always occurs before or during the development of all new T2 lesions and represents breakdown of the blood-brain barrier as proinflammatory T cells infiltrate into the brain parenchyma. Nevertheless, the enhancement is transient, with most lesions disappearing within 4 weeks (range, 1 to 16 weeks), while a permanent T2 lesion remains as the only evidence of new disease activity relative to the previous MR imaging study. The enhancement pattern can change with evolution and resolution of inflammation from diffuse to nodular and ringlike. The enhancement is more often solid and homogeneous with fresh lesions, particularly when they are small, and may appear as ringlike with lesions that are larger and several weeks old. In rare cases where extremely large MS lesions appear tumefactive, the “open ring” sign favors demyelination over tumor or abscess. Gd enhancement is sensitive to steroids and other anti-inflammatory treatments used in MS. In clinical practice, less than 30% of untreated MS patients have evidence of Gd-enhancing lesions during a routine MR imaging study because of the transient enhancement that is characteristic of active MS lesions and the seemingly random occurrence of new disease activity. The most common evidence of previous MS lesion activity is the accumulation of new T2 and enlarging T2 lesions since the last clinical scan.
The use of Gd can help detect new MS lesion activity or rule out confounding diagnoses that could be missed by PD/T2W imaging alone. Some diagnoses include meningiomas, small neoplasms, vascular malformations, and leptomeningeal disease such as sarcoidosis. Leptomeningeal enhancement is rare in MS. In contrast, enhancement of the optic sheath is common at the time of optic neuritis when specialized MR imaging sequences are used to view the optic nerves. A potential false-positive MR imaging finding is Gd within a vessel situated in a deep sulcus. Verifying the presence of a lesion on the corresponding T2W, PD, or FLAIR image or a follow-up scan can help clarify this finding.
New or enlarging T2 lesions also represent new inflammation and provide complimentary information on disease activity that is given by the detection of contrast-enhancing lesions. On average, MS patients develop four to five new MR imaging lesions per year, with great variability among individuals, with some having no new activity and others having dozens of new lesions. T2 lesions increase in size during the acute phase mostly due to edema associated with inflammatory infiltrates, reaching their maximum size within 4 weeks. The inflammatory process is self-limiting, and the lesions slowly decrease in size over the next 6 to 8 weeks as edema resolves and possibly remyelination occurs. Unlike Gd enhancement, which is transient and disappears, most new lesions leave a residual T2 lesion. Preexisting T2 lesions can reactivate with re-enhancement only, enlarge on T2W images, or both. Eventually, after many reactivations, lesions may fuse with adjacent lesions, and what may have started out as several small lesions may end up forming large confluent lesions. Annually, there is commonly net accumulation of new and enlarging lesions that increases the total T2 volume or burden of disease (T2 BOD) by 5% to 10% per year. The absence of Gd-enhancing lesions or ongoing stability of T2 BOD does not necessarily indicate that the disease is quiescent. Low-grade migration of immune cells across the blood-brain barrier occurs in the absence of a detectable Gd enhancement, and the regions of the grey and white matter that appear normal on conventional MR imaging are often damaged with pathologic evidence of ongoing inflammation, demyelination, and axonal loss. Much of current imaging research has been focused on developing advanced techniques to directly or indirectly monitor this subtle or occult disease activity in MS patients.
Three additional MR imaging features that are common in MS include T1W black holes (see Fig. 1 I), diffusely abnormal white matter ( Fig. 1 J), and cerebral atrophy ( Fig. 4 ). T1W black holes are a subset of MS lesions that have a stronger correlation with disability than seen with T2 BOD. On the precontrast T1W images, the majority of MS lesions are isointense to surrounding white matter; approximately 30% are hypointense with a signal intensity less than or equal to grey matter. A small proportion of these lesions may enhance on the postcontrast T1W images, representing new inflammation with edema (acute black holes). Approximately half of acute black holes will resolve within 3 months of their appearance. The remaining black holes that are chronic (persistent for a minimum of 6 months after their first appearance) represent a subset of lesions with greater axonal loss and more extracellular fluid when compared with chronic T2 lesions that are isointense on T1W images. T1W black holes are more prevalent in MS than in vascular disease. Although the presence of black holes has limited diagnostic value, an increase in their number over time may be an indication of clinically significant disease progression and could lead to a change in patient management.
Not all lesions are discrete on MR imaging. Large diffuse lesions may be visible on T2W MR imaging with poorly defined boundaries. These areas of diffusely abnormal or “dirty” appearing white matter (DAWM) have similar intensity to gray matter on T2W scans and are most commonly found around the ventricles, adjacent to the trigone and occipital horn, the body of the lateral ventricles, and the centrum semiovale. DAWM can extend over several contiguous slices and were present in 17% of RRMS patients in one study. Pathologic examination of DAWM lesions in several MS patients has demonstrated consistent and extensive loss of myelin phospholipids within all of the lesions with variable degrees of axonal loss. The degree of these changes is intermediate to those found in normal appearing white matter and MS plaques. DAWM spares the subcortical U fibers, a frequent location of MS plaques. The specificity and utility of DAWM in the diagnosis of MS is unknown.
MR imaging studies can readily detect brain atrophy, occurring in 47% to 100% of MS patients, and is an important feature that underscores the chronic, irreversible tissue loss that most likely is a major contributing factor to permanent clinical disability. It is more severe and evident in patients with secondary progressive MS than RRMS. With quantitative measures, atrophy can sometimes be detected after a single attack of demyelination (CIS) before the diagnosis of MS is established and in the presence of a small T2 BOD. Atrophy is progressive during the course of MS. The video available at http://www.neuroimaging.theclinics.com demonstrates progressive cerebral atrophy in a patient with RRMS imaged over 8 years. Initially, there appears to be a subtle widening of the sulci and some mild ventricular enlargement. The changes are more dramatic after month 48, when there is also an accompanying increase in T2 lesion burden around the ventricles. Annually, MS patients lose 0.6% to 0.8% of brain volume compared with 0.3% for healthy controls. There is an associated increase in ventricle size of 1.6 mL/year in MS compared with 0.3 mL/year in healthy age-matched control subjects. In one study, this increase was equivalent to 17 to 24 mL of tissue loss per year. Detecting progressive brain volume loss is of potential clinical importance when assessing treatment response or failure, because increasing evidence suggests that more potent MS therapies can delay this process. The benefit of treatment on preventing brain atrophy can be masked by the effects of “pseudoatrophy” that occurs shortly after starting therapy and is presumed to be due to shifts in brain water and edema.
Imaging features of typical lesions in multiple sclerosis
T2 lesions on brain MR imaging are characteristic of well-established, definite MS ( Fig. 1 A—H ), and the absence of these lesions should lead to careful reevaluation of the diagnosis. Early in the disease course at the time of the first clinical symptoms (CIS), approximately 20% of patients in whom MS will develop within the next 5 to 20 years will have a normal brain on MR imaging initially. Even patients who have definite MS after sustaining two clinical attacks may have a paucity of lesions that do not meet current radiologic criteria for MS. This finding is more common in MS subgroups, including Asian opticospinal MS (OSMS) and variants such as neuromyelitis optica (NMO) or Devic’s disease; therefore, an MR image of the brain with minimal abnormalities does not rule out the diagnosis of MS but may necessitate further supportive investigations including evoked potentials, cerebral spinal fluid (CSF) analysis, spinal cord imaging, anti–aquaporin-4 antibody testing, and follow-up brain MR imaging as symptoms evolve over time.
Postmortem studies in MS subjects have validated that MS plaques correspond to the hyperintense lesions seen on T2/PD and FLAIR images. They appear higher in signal intensity (or bright) because of longer T2 relaxation times (see Fig. 1 A–C). T2 lesions are not specific for plaque age, the degree of myelin and axon loss, or the amount of edema and inflammation. Loss of myelin creates a more hydrophilic environment, and the increased water gives a brighter T2/PD signal and a darker T1W appearance. Infections, ischemia, tumors, and other causes of inflammation also affect lesion water content and can cause similar MR imaging signal changes, limiting the specificity for any individual lesion.
MS lesions vary in size and location and have a periventricular predominance. It would be unusual to have sparing of this region in MS. The lesions typically develop in a perivenular pattern as immune cells migrate across the blood-brain barrier and induce a cascade of inflammation and demyelination. These areas may appear as Dawson fingers or elongated flame-shaped lesions best seen on sagittal FLAIR images oriented along subependymal veins in the corona radiata and centrum semiovale, perpendicular to the walls of the ventricle ( Fig. 1 D). Lesions can occur in any structure containing myelin, including the cortex. Cortical plaques occur commonly in MS but are difficult to see on MR studies, even with special sequences, owing to similarities in signal intensities of MS lesions and grey matter and the partial volume effects of CSF within the adjacent sulci. Lesions are often seen in the temporal lobes, grey-white matter junction (juxtacortical) ( Fig. 1 G), brainstem, cerebellum ( Fig. 1 F), optic nerves, and spinal cord. Corpus callosum lesions occur frequently in all stages of MS, ranging from 51% of CIS patients to 93% of MS patients compared to only 2% of patients with white matter disease due to other causes. Some non-MS disorders in which involvement of the corpus callosum has been reported include stroke, cerebral autosomal dominant arteriopathy with subcortical infarctions, lymphoma, Sjogren’s disease, and progressive multifocal leukoencephalopathy ( Fig. 2 ).
Four percent of healthy individuals of all ages can have periventricular changes that cannot be distinguished from MS. With increasing age, nonspecific MR imaging abnormalities (unidentified bright objects [UBOs]) become increasingly common. These objects are more frequent in women, and a few small UBOs are common by the early to mid-forties. UBOs are usually isointense on T1W sequences, whereas approximately 30% of MS lesions appear hypointense (dark or so-called “black holes”) on T1W sequences. Patients with chronic hypertension can have confluent white matter lesions indistinguishable from those seen in patients with long-standing MS. Normal structures can also be misinterpreted as false-positive lesions, including flow artifacts, volume averaging between slices, and enlarged perivascular Virchow-Robin spaces. Virchow-Robin spaces usually appear as punctuate white matter lesions and commonly occur in the lower third of the corpus striatum, the midbrain, and caudal to the lenticular nucleus Cases of giant perivascular spaces have also been reported (see Fig. 2 H).
The addition of T2W gradient echo images to detect hemosiderin-related susceptibility changes from occult hemorrhage may be helpful when CNS vasculitis is also under consideration. The diagnosis of primary CNS vasculitis, also known as primary angiitis of the CNS (PACNS), is one of the most challenging problems in clinical neurology. The pathology of PACNS is a segmental necrotizing vasculitis. Leptomeningeal and cortical vessels are predominantly involved, especially small vessels 200 to 500 μm in diameter and precapillary arterioles less than 200 μm in diameter. T2 hyperintense lesions consistent with ischemia or infarction may be seen, particularly involving the subcortical white matter, deep white matter, or deep grey matter in the territory of small- to medium-sized vessels. The cerebral hemispheres are affected more often than the posterior fossa; however, these findings are nonspecific, and the differential diagnosis of multiple T2 hyperintense lesions is a lengthy one. Occult hemorrhage can be seen in approximately 10% of patients with PACNS on T2W gradient echo images. This hemorrhage usually consists of single or multiple punctuate areas of signal void in the subcortical or deep white matter, representing hemosiderin.
An MS relapse refers to an episode of neurologic disturbance of the type seen in MS when clinicopathologic studies have established that the causative lesions are inflammatory and demyelinating in nature. T2W imaging techniques (ie, T2W, PD, or FLAIR) are the most sensitive conventional technique for detecting MS plaques but do not distinguish between acute and chronic lesions. The MR imaging correlate of new disease activity is the appearance of Gd enhancement on the postcontrast T1W image and new or enlarging T2 lesions ( Fig. 3 ). Gd does not normally cross the intact blood-brain barrier. New MS lesions pathologically coincide with disruption of the blood-brain barrier and inflammation and appear on T1W imaging as Gd-enhancing lesions. Weekly MR imaging studies demonstrate that Gd enhancement always occurs before or during the development of all new T2 lesions and represents breakdown of the blood-brain barrier as proinflammatory T cells infiltrate into the brain parenchyma. Nevertheless, the enhancement is transient, with most lesions disappearing within 4 weeks (range, 1 to 16 weeks), while a permanent T2 lesion remains as the only evidence of new disease activity relative to the previous MR imaging study. The enhancement pattern can change with evolution and resolution of inflammation from diffuse to nodular and ringlike. The enhancement is more often solid and homogeneous with fresh lesions, particularly when they are small, and may appear as ringlike with lesions that are larger and several weeks old. In rare cases where extremely large MS lesions appear tumefactive, the “open ring” sign favors demyelination over tumor or abscess. Gd enhancement is sensitive to steroids and other anti-inflammatory treatments used in MS. In clinical practice, less than 30% of untreated MS patients have evidence of Gd-enhancing lesions during a routine MR imaging study because of the transient enhancement that is characteristic of active MS lesions and the seemingly random occurrence of new disease activity. The most common evidence of previous MS lesion activity is the accumulation of new T2 and enlarging T2 lesions since the last clinical scan.
The use of Gd can help detect new MS lesion activity or rule out confounding diagnoses that could be missed by PD/T2W imaging alone. Some diagnoses include meningiomas, small neoplasms, vascular malformations, and leptomeningeal disease such as sarcoidosis. Leptomeningeal enhancement is rare in MS. In contrast, enhancement of the optic sheath is common at the time of optic neuritis when specialized MR imaging sequences are used to view the optic nerves. A potential false-positive MR imaging finding is Gd within a vessel situated in a deep sulcus. Verifying the presence of a lesion on the corresponding T2W, PD, or FLAIR image or a follow-up scan can help clarify this finding.
New or enlarging T2 lesions also represent new inflammation and provide complimentary information on disease activity that is given by the detection of contrast-enhancing lesions. On average, MS patients develop four to five new MR imaging lesions per year, with great variability among individuals, with some having no new activity and others having dozens of new lesions. T2 lesions increase in size during the acute phase mostly due to edema associated with inflammatory infiltrates, reaching their maximum size within 4 weeks. The inflammatory process is self-limiting, and the lesions slowly decrease in size over the next 6 to 8 weeks as edema resolves and possibly remyelination occurs. Unlike Gd enhancement, which is transient and disappears, most new lesions leave a residual T2 lesion. Preexisting T2 lesions can reactivate with re-enhancement only, enlarge on T2W images, or both. Eventually, after many reactivations, lesions may fuse with adjacent lesions, and what may have started out as several small lesions may end up forming large confluent lesions. Annually, there is commonly net accumulation of new and enlarging lesions that increases the total T2 volume or burden of disease (T2 BOD) by 5% to 10% per year. The absence of Gd-enhancing lesions or ongoing stability of T2 BOD does not necessarily indicate that the disease is quiescent. Low-grade migration of immune cells across the blood-brain barrier occurs in the absence of a detectable Gd enhancement, and the regions of the grey and white matter that appear normal on conventional MR imaging are often damaged with pathologic evidence of ongoing inflammation, demyelination, and axonal loss. Much of current imaging research has been focused on developing advanced techniques to directly or indirectly monitor this subtle or occult disease activity in MS patients.
Three additional MR imaging features that are common in MS include T1W black holes (see Fig. 1 I), diffusely abnormal white matter ( Fig. 1 J), and cerebral atrophy ( Fig. 4 ). T1W black holes are a subset of MS lesions that have a stronger correlation with disability than seen with T2 BOD. On the precontrast T1W images, the majority of MS lesions are isointense to surrounding white matter; approximately 30% are hypointense with a signal intensity less than or equal to grey matter. A small proportion of these lesions may enhance on the postcontrast T1W images, representing new inflammation with edema (acute black holes). Approximately half of acute black holes will resolve within 3 months of their appearance. The remaining black holes that are chronic (persistent for a minimum of 6 months after their first appearance) represent a subset of lesions with greater axonal loss and more extracellular fluid when compared with chronic T2 lesions that are isointense on T1W images. T1W black holes are more prevalent in MS than in vascular disease. Although the presence of black holes has limited diagnostic value, an increase in their number over time may be an indication of clinically significant disease progression and could lead to a change in patient management.
Related posts:
 The Pathologic Substrate of Magnetic Resonance Alterations in Multiple Sclerosis
 Basic Principles of Magnetic Resonance Imaging
 Brain Atrophy Assessment in Multiple Sclerosis: Importance and Limitations
 MR Relaxation in Multiple Sclerosis
 The Clinical Epidemiology of Multiple Sclerosis
The Use of MR Imaging as an Outcome Measure in Multiple Sclerosis Clinical Trials
The Clinical Epidemiology of Multiple Sclerosis
The Use of MR Imaging as an Outcome Measure in Multiple Sclerosis Clinical Trials
Stay updated, free articles. Join our Telegram channel

Full access? Get Clinical Tree


