8 Coronary Heart Disease By the year 2015, coronary heart disease will overtake infectious diseases as the leading cause of death in humans. Based on current WHO statistics, ~17 million myocardial infarctions (AMIs) take place each year. Almost 50% of these patients have no warning signs of an impending AMI, and 60% of all deaths from AMI occur before the patient reaches the hospital. Patients at risk for AMI can be identified clinically, but the great majority of heart attacks occur in the general population. While these persons have a much lower overall risk than clinical populations, they still suffer absolutely the highest number of heart attack deaths. The ratio of deaths in the general population to deaths in cardiac patients is ~10:1. Even prominent cardiologists with a specialized knowledge in this field have fallen victim to sudden cardiac death: for example, J. Isner, the father of cardiac genetic research; Ronald W.F. Campell, famous electrophysiologist; and Anthony F. Richards, the father of the BARI Study and rate-adaptive cardiac pacemakers and an authority on malignant cardiac arrhythmias. After publication of the MONICA Study, the WHO concluded that primary prevention is the only effective way to reduce the prevalence of acute, unexpected cardiac deaths in the general population. This echoes the call of M. Sones, the father of coronary angiography, who spoke at a 1978 conference in Frankfurt, Germany, emphasizing the need to develop methods for the early identification of persons at risk for MI. Interestingly, the topic of that conference was the detection of coronary calcifications by fluoroscopy. To assess the value of invasive and noninvasive methods for the early detection of coronary sclerosis and AMI risk, it is necessary to have a basic understanding of the pathogenesis of coronary atherosclerosis. Like diseases in other vascular regions, the development of coronary atherosclerosis is a gradual process that Stary et al.1,2 divided into five stages (Fig. 8.1). A sixth stage describes the development of complicated plaques. Modifications have been proposed by Virmani et al.3,4 The development of atherosclerosis begins in childhood and adolescence (Fig. 8.2) with the formation of minute fat deposits. Corresponding to Stary stage II disease, these “fatty streaks” lead to intimal thickening, which is most pronounced at the bifurcations of vessels. Stary stage III is an intermediate stage that shows no signs of progression and is still considered part of the natural aging process. It is pathological only if the stage III lesions show evidence of progression. Typical signs are a continued accumulation of lipid elements and an increase in regional, segmental, eccentric wall thickening that exceeds 300 µm (Table 8.1). Stage IV lesions are atheromas, which possess a larger, well-defined lipid core. These lipid pools may be located at a deep level near the media or luminal surface and are separated from the vessel lumen by a fibrous cap. A stage V lesion is a fibroatheroma, which contains increased amounts of collagen that harden and stiffen the vessel. This type is also called stage Va. Heavily calcified lesions are classified as Vb, and predominantly fibrotic lesions are classified as Vc.1 Calcium deposits are already present in Stary stage III lesions. First they are intracellular, then extracellular and increase with progression of the disease.5 Besides purely degenerative processes, intramural hemorrhage is another potential cause of increased calcification in the vessel wall. Intramural hemorrhages also create a nidus for lipid accumulation, which results not only from the infiltration of lipid-laden macrophages but also from the breakdown of erythrocytes, as the wall of red cells are very rich in cholesterol. Thus, intramural hemorrhages are a source of fat accumulation as well as calcification. Potentially extensive wall calcifications may form in stage Vb disease without narrowing the vessel lumen. Coronary calcium reduces the tension at the surface of plaques as long as the fibrous cap is thicker than 100 µm. Calcium, then, is not a late sign but an early sign of coronary atherosclerosis and has a stabilizing effect on the vessel wall. Even if only isolated plaques are detectable, calcifications can be identified in more than 90% of cases.5 Atherosclerosis has its onset during childhood and adolescence. Advanced deposits consistent with stage III–IV lesions are already detectable in 15–20% of adolescents under 20 years of age and 60% at the age of 30 years (Fig. 8.2). Studies in US soldiers who died in Korea and Vietnam have confirmed that atherosclerotic lesions, some extensive, have already formed in the coronary vessels by 20–30 years of age. Decades pass without an acute cardiac event, however, as most heart attacks occur between 40 and 64 years of age. This delay is attributable to vascular remodeling, known also as the Glagov phenomenon.6 As atherosclerosis progresses in the vessel wall, the surface area of the vessel enlarges (Fig. 8.3) to compensate for intimal thickening and forestall luminal narrowing. This compensatory mechanism, called positive remodeling, continues to be effective until plaque formation, which is always eccentric in its early stage, causes 40–45% cross-sectional luminal narrowing or an increase in the vascular circumference by 60%.6–8 Negative remodeling may also occur, especially in advanced stages of atherosclerosis but sometimes in the early stage as well. Negative remodeling reduces the cross-sectional area of the vessel in the presence of intimal thickening.9,10 It is believed to result from scar retraction following injury to the vessel wall. Thus, imaging techniques that define the lumen of vessels usually cannot detect early stages of the disease because they do not image the vessel wall.
Subclinical Signs of Coronary Atherosclerosis (Prevention, Screening, and Risk Stratification)
Early Detection of Coronary Heart Disease
Pathogenesis of Atherosclerosis
Calcifications
Remodeling
Stary type | Pathoanatomical features | Intravascular ultrasound |
I (initial intimal thickening) | Accumulation of lipoprotein in the intima, lipid-laden macrophages. No tissue damage | Single-layer vessel wall with no division into intima, media, and adventitia. The adventitia bounds the vessel as a broad echogenic zone. With aging, the wall acquires a three-layered structure with a visible intima, media, and adventitia as the intima thickens to more than 150 µm, falling within the resolution limits of the scanner |
II (fatty streaks) IIa (progression) IIb (progression resistant) | Accumulation of lipoprotein in the intima, lipid-laden macrophages and smooth muscle cells. Lesions grossly visible as fatty streaks on the surface of vessels | Eccentric three-layered structure in proximal vessel segments with intimal thickening > 150 μm |
III (preatheroma) | All signs of type II lesions plus multiple extracellular sites lipid accumulation | Progressive, eccentric intimal thickening with narrow zones > 300 μm. Rarely, acoustic shadowing due to calcification |
IV (atheroma) | All signs of type III lesions plus confluent extracellular lipid zones (lipid core) with massive structural damage to the intima | Eccentric intimal thickening with deep or superficial hyperechoic zones and a fibrous cap. A cap thinner than 100 μm signifies a vulnerable lesion |
Va (fibroatheroma) | All types and features of type IV lesions plus collagen and increased smooth-muscle cells | All signs of type IV lesions with progressive thinning of the fibrous cap and more echogenic intimal thickening |
Vb (calcified lesion) | Calcifications are the main component of plaque formation | Area of eccentric or concentric intimal thickening with zones of increased echogenicity and acoustic shadowing from calcifications. The degree of calcification is expressed as a percentage of circumference. The calcifications may be deep or superficial |
Vc (fibrotic lesion) | Same as type V lesions but consisting mainly of collagen | Eccentric or concentric plaque formation with high-level echoes and possible acoustic shadowing. No reverberations and no hypoechoic zones |
VIa (ulcerated plaques) | Ulcerated plaques | Ulcerated plaques. Usually, detectable remnants of the fibrous cap. Communicate with the lumen. Shadowing calcification is usually visible adjacent to and deep within the ulcer |
VIb (plaque hematoma or hemorrhage) | Plaque hematoma or hemorrhage with evidence of intramural hemorrhage and numerous remnants of erythrocyte membranes, which are a source of cholesterol deposits. Cholesterol-rich membranes | Detection of an intact intraluminal intimal border with multiple well-defined hypoechoic zones that pulsate with blood flow. Marked pulsatile plaque changes |
VIc (plaque thrombosis) | Plaque fissuring or rupture with signs of mural or complete luminal thrombosis | Complete or partial luminal obstruction with granular echoes, irregular luminal boundaries, and free-floating structures. Intraluminal catheter leaves impressions, foot prints in mural thrombus |
The presence of wall irregularities and sites of luminal narrowing usually signifies an advanced atherosclerotic process with a plaque area that exceeds 45%.11 Hemodynamically significant stenosis that reduces myocardial perfusion during stress is present when more than 75% cross-sectional luminal narrowing has occurred, corresponding to more than a 50% reduction in vessel diameter. The corresponding plaque area related to the total vessel area already exceeds 90% by this stage. This means that an interventional procedure that reduces luminal narrowing by < 30% will usually leave a plaque area of ~70%.12
Complicated Plaques
The pathogenesis of acute coronary syndromes—unstable angina, sudden cardiac death, and myocardial infarction—is based on the formation of complicated plaques. Plaque ruptures are present in 65% of cases, plaque erosions in 35%, and intraluminal calcium protrusions in less than 5% of cases.1,2 Plaque rupture is most likely to occur when:
• A thin fibrous cap (< 100 μm) has formed over the atheroma
• Reduced numbers of smooth-muscle cells are present in the cap
• A large atheroma (> 40%) develops
• Signs of inflammation (macrophage infiltration) are present
• The vessel wall has undergone positive remodeling
• Increased vascularity is detectable in the vasa vasorum of the adventitia

Fig. 8.1 Schematic representation of the progression of atherosclerosis by Stary stages. Stage II and III are characterized by intimal thickening and intermediate lesions with lipid deposits, stage IV by atheroma formation, and stage V by fibroatheroma formation. Plaque rupture may occur in stages IV and V, and plaque erosions may occur at all stages (modified from Naghavi et al., 2006176).
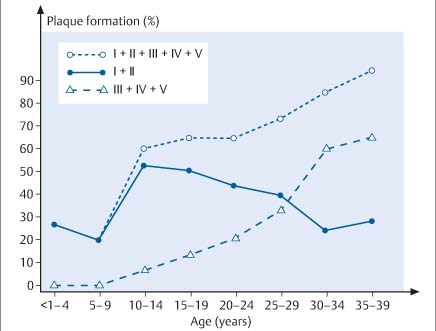
Fig. 8.2 Graphic representation of the frequency of plaque formation at various Stary stages in children, adolescents, and young adults. It is interesting to note that advanced stage IV and stage V lesions are already detectable in adolescents and young adults (after Kolodgie et al., 200435).
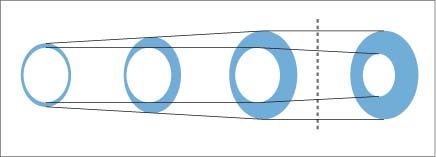
Fig. 8.3 Schematic representation of positive remodeling. As the plaque area in a vessel increases, the vessel expands to maintain its luminal diameter. This mechanism is effective up to 40% cross-sectional luminal narrowing. Beyond that limit, vascular enlargement can no longer compensate for an increase in plaque area, and luminal narrowing occurs. This means that even minimal narrowing of a vessel lumen seen at imaging represents significant plaque formation (after Ge et al., 19937).
This also means that a critical degree of luminal narrowing cannot predict the risk of myocardial infarction, since more than 85% of infarct-related vessels show less than 75% luminal narrowing, which is borderline in terms of hemodynamic significance. Moreover, 70% of vessels show less than 50% luminal narrowing, which does not reduce myocardial perfusion even during strenuous exercise and does not lead to ECG changes or angina pectoris.7,13,14 Thus, the early detection of coronary sclerosis must focus on detection of the underlying disease. The detection of critical luminal narrowing comes too late.
When a plaque ruptures, all or part of the atheroma spills into the bloodstream and creates an ulceration in the vessel wall (Stary Va ulcerated plaque). Spontaneous plaque ruptures occur in up to 10% of otherwise healthy individuals and in up to 25% of diabetic and hypertensive patients according to forensic data. These changes are present in 65% of patients with an acute coronary syndrome.
Intramural hemorrhage due to rupture of the vasa vasorum is classified as Stary stage VIb.
Partial or complete mural thrombosis following plaque rupture is classified as Stary stage VIc. This is the causative lesion of unstable angina and acute myocardial infarction. Mural thrombosis is a typical characteristic of unstable lesions. It is more commonly demonstrated by optical coherence tomography (OCT) than angioscopic intravascular ultrasound or angiographic findings would indicate.15,16
Stages VIa through VIc are of key importance in the pathogenesis of acute coronary syndromes—a collective term for acute infarction with or without ST segment elevation, sudden cardiac death, and unstable angina pectoris. The symptoms depend on the underlying pathological morphology.
The healing of ruptured plaques leads to thickening of the atherosclerotic wall and is the basis for the progression of coronary sclerosis. Repetitive plaque ruptures that intermittently recur, heal, and add new layers, leading to multiple layering, are the mechanism that drives the progression of coronary atheroma.3,4
Detection of Subclinical Atherosclerosis
The earliest abnormality caused by atherosclerotic disease is endothelial dysfunction, which can be detected with special diagnostic techniques. We still do not know the exact degree to which endothelial dysfunction, which is usually detected in the forearm or hand, is indicative of concomitant coronary vascular disease (Fig. 8.4).17
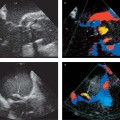
Early changes associated with atherosclerosis can be reliably detected with intravascular ultrasound (IVUS) (Fig. 8.5) and even better with OCT due to the ten times higher resolution. Both complicated and uncomplicated plaques can be identified. Stary stage IV is characterized by atheroma formation and stage Va by fibroatheroma formation (Figs. 8.5, 8.6). Lipid cores appear as hypoechoic zones, and calcifications cast acoustic shadows (Fig. 8.7). IVUS can also detect plaque formation as an early sign of atherosclerosis in patients who have a normal coronary angiogram. The incidence of normal vessel segments decreases, whereas more patients show advanced lesions type III and IV/V according to the Stary classification (Fig. 8.8). Positive remodeling is very clearly demonstrated by IVUS, as a proximal-to-distal analysis of vascular diameter shows the vessel expanding in the area of heaviest plaque formation and narrowing farther distally (Fig. 8.9). IVUS can also detect negative remodeling (Fig. 8.10).
CT is the best noninvasive modality at present for the early detection of calcified and noncalcified plaques. While contrast administration is unnecessary for detecting calcifications and entails low radiation exposure (< 1 mSv in electron beam CT, < 3 mSv in multislice CT), the imaging of noncalcified coronary plaques requires contrast injection and therefore exposes the patient to a higher radiation dose. CT can demonstrate vessel enlargement (positive remodeling) in vascular segments where plaque has formed.18,19 Because calcium deposits form at an early stage of atherosclerosis, positive findings may be seen even before luminal narrowing has occurred. This makes CT an excellent modality for detecting early stages in the progression of coronary atherosclerosis.20,21
MRI is most useful for the visualization of noncalcified plaques but is not positive for calcifications. The temporal resolution of MRI is still inadequate for the clinical detection of coronary atherosclerosis. With its ability to define the lumen of coronary vessels, MRI is faced with the same problems as invasive coronary angiography, since 45% or greater cross-sectional luminal narrowing must be present before there is a visible decrease in luminal diameter. If slight narrowing is detected, it already signifies a considerable plaque burden.
Luminal imaging can also be accomplished with synchrotron radiation, but early diagnosis faces the same obstacles as in coronary angiography (Fig. 8.11).
The most sensitive modality for detecting abnormal myocardial perfusion is positron emission tomography (PET) (Fig. 8.4). Nuclear medicine studies as well as stress protocols like those used in echocardiography and MRI yield a positive result only if there is at least 70% lumen reduction (high plaque burden), and their sensitivity is 80–90%. The sensitivity of stress ECG is 20% lower because decreased blood flow is detectable only when the diameter reduction exceeds 70% and area stenosis exceeds 90% (Fig. 8.4). Sensitivity is in the 60–70% range, depending on the clinical population.
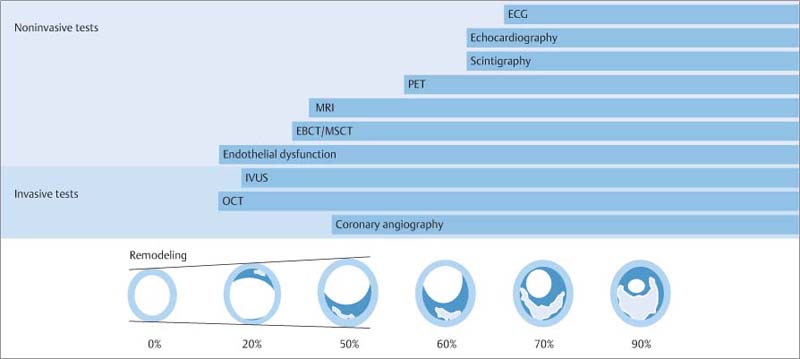
Fig. 8.4 Review of invasive and noninvasive tests for coronary sclerosis and myocardial ischemia, shown in relation to coronary plaque formation and positive remodeling as described by Glagov et al. (1997).6 The detection of endothelial dysfunction is the first invasive and noninvasive sign of incipient coronary disease. Initial signs can be detected invasively by optical coherence tomography (OCT). Intravascular ultrasound (IVUS) is the most widely used clinical modality for the early detection of coronary sclerosis. Even Stary stage II and III lesions can be visualized. Calcifications can be detected with high sensitivity along with thrombus formation and lipid deposits. Electron-beam CT (EBCT) and multislice CT (MSCT) are the current modalities of choice for detecting coronary calcifications noninvasively. Calcifications are initially intracellular and then extracellular and occur as early as Stary stage III. MRI can also detect plaque formation. As in contrast-enhanced MSCT, noncalcified plaques are more easily detected.
Coronary angiography defines only the vessel lumen and does not become positive until positive remodeling exceeds 45% luminal reduction; a phenomenon valid for all luminographic imaging techniques. Positron emission tomography (PET) is excellent for detecting abnormal myocardial perfusion in cases where more than 50–60% narrowing has occurred. Stress echocardiography and stress myocardial scintigraphy are not positive until luminal narrowing exceeds 75%. Stress electrocardiography is 20% less sensitive and does not become positive until flow-limiting stenosis has developed (modified from Erbel et al., 199613).
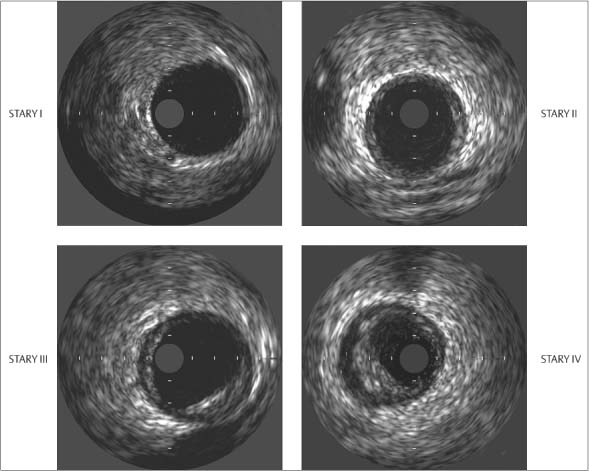
Fig. 8.5 Intravascular ultrasound (IVUS). Images at Stary stages I, II, III, and IV show intimal thickening in stage II, localized eccentric plaque formation in stage III, and eccentric plaque formation with hypoechoic lipid deposits in stage IV (after Erbel 199613).
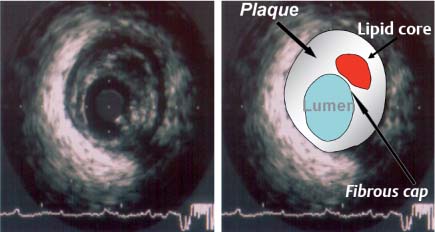
Fig. 8.6 Intravascular ultrasound image and correlative diagram of Stary stage IV/Va plaque formation (atheroma, fibroatheroma). The image (1 mm calibration) shows a large, hypoechoic lipid core with eccentric plaque formation and a typical three-layered vessel wall in which the media appears as a black zone encircling the lumen. The catheter appears as a central structure with a guidewire-induced artifact at the 4 o’clock position. The vulnerable plaque is recognized by its large lipid core, thin fibrous cap, and large atheroma. Vulnerable plaques are also characterized by inflammatory changes, neoangiogenesis, and positive remodeling.
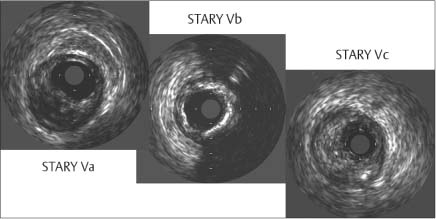
Fig. 8.7 Intravascular ultrasound of Stary stages Va through Vc shows the formation of a fibroatheroma, fibrous cap, thinning of the cap at its margins, and a clear lumen (Va). Extensive calcifications with acoustic shadows and increased echogenicity are observed in stage Vb, and high-level echoes from eccentric plaque are seen in stage Vc of fibrotic plaque formation (after Erbel 199613).
Detection of Complicated Plaques
Plaque ruptures appear as aneurysms in lumen-defining techniques such as coronary angiography (Fig. 8.12) and MR angiography.22 Sectional imaging procedures such as IVUS can more accurately define ulcerations and other changes in the vessel wall.16,23,24
Intravascular ultrasound can detect intramural hematoma formation (Fig. 8.13) in rare cases.23 This has not yet been accomplished in the coronary vessels with other noninvasive modalities, but MRI has been able to detect intramural hemorrhages in atherosclerotic vessels of the carotid system.
Thrombi can be detected indirectly as filling defects in coronary angiograms and luminograms (Fig. 8.13). They should not be mistaken for projecting mural calcifications. Partial and complete thrombosis of the coronary vessels can be detected with IVUS even better by angioscopy and OCT. This technique is not very sensitive in the differentiation of other lesions, however.11 While IVUS can detect nearly 100% of calcifications (but not microcalcifications), it has 80% sensitivity in detecting atheroma formation and almost 90% sensitivity in detecting fibrotic deposits. Noninvasive imaging techniques are still in the developmental stage as far as the assessment of plaque composition is concerned. They lag well behind the “virtual histology” that can be accomplished with IVUS in clinical settings (Figs. 8.14, 8.15).25–27
The natural history of plaque ruptures is often marked by a very gradual healing process that is stimulated and initiated by thrombosis at the ulcer base. Intravascular ultrasound studies have shown that ruptured plaques may persist for many months without causing vascular obstruction. Multiple recurrent microemboli may occur, however, and can lead to significant functional impairment without causing an apparent reduction in blood flow. Microemboli lead to a mismatch between perfusion and function because the functional abnormalities are not accompanied by a corresponding perfusion deficit, at least initially, while induced inflammatory processes perpetuate and exacerbate the functional abnormality over time.14,28,29 Experimental studies confirm anecdotal clinical reports of functional recovery occurring within 5–10 days after an acute event. Microemboli are particularly likely to be accompanied by cardiac arrhythmias during the initial phase. This observation has important imaging implications, because functional abnormalities of the heart may occur in the absence of detectable luminal narrowing and with little or no evidence of decreased coronary perfusion.28,30–33 Microemboli may also cause significant impairment of coronary vasomotion.32
Both IVUS and angioscopy have shown that plaque ruptures occur frequently in multiple vessels.34 On average, 2.0–2.5 lesions are detected in each patient.34,35 Plaque ruptures are also found in 15–20% of patients with stable angina pectoris35,36—a finding already noted in previous pathoanatomical studies.14,36
Detection of Unstable or Vulnerable Plaques
The goal of modern imaging is to detect “vulnerable” plaques that are most susceptible to rupture.24,35 The most commonly used imaging procedures in the past were invasive techniques based largely on IVUS. The goal of these procedures is to identify sites in the coronary vessel that are prone to rupture. Patients at risk are extremely difficult to identify clinically because the stenoses that lead to an acute infarction are not flow-limiting lesions. As a result, type IV or type V plaques are rarely diagnosed even with IVUS (Fig. 8.6). Most patients who present for examination have already experienced plaque ruptures because they have an acute coronary syndrome. We are still awaiting the results of “virtual histology” (Figs. 8.14, 8.15) as a means of identifying coronary vascular sites that display typical features of an unstable lesion.
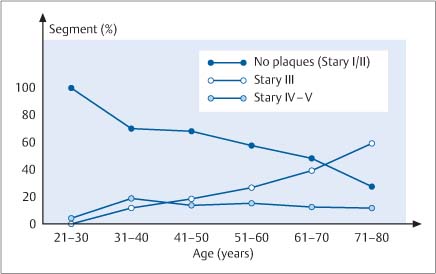
Fig. 8.8 Plaque formation with a normal coronary angiogram. The percentage of imaged segments that show Stary stage III, IV or V plaque formation is plotted against patient age categories.
Thermography is a technique that detects regional temperature elevations caused by the inflammatory reaction that is typically associated with vulnerable plaques. Thermographic imaging has been used clinically, in-vitro studies have documented temperature differences up to 1.5 °C in the carotid arteries. The temperature differences in vivo are smaller but may reach 0.6 to 1 °C. They are higher in an acute infarction than in unstable angina and are reduced by treatment with statins.
Catheter-based spectroscopic and MRI techniques are also being developed for the detection of vulnerable plaques. First studies are also performed using CT and MRT.37,38
Angioscopy as well as OCT have been introduced clinically but are still limited to a small number of centers. Angioscopy can distinguish stable plaques from unstable plaques owing to their different color characteristics. Plaque ruptures can be detected, and thrombotic deposits can be diagnosed with high sensitivity, which is highest for OCT.
Preventive Cardiology
Preventive cardiology has reached a new level with the development of methods that allow the detection of subclinical coronary atherosclerosis. An important aspect of preventive cardiology is the identification of risk factors, which is included in the “Check-Up 35” screening program in Germany. A distinction is drawn between modifiable and nonmodifiable risk factors as well as causal, predisposing, and possible risk factors (Table 8.2). Heavy smoking, hypertension, hypercholesterolemia, and diabetes mellitus are considered to be causal risk factors, not only because of their link with atherosclerosis but also because treatment of these conditions is associated with a reduction in patient risk. This has not been definitely established for possible risk factors, which include hypertriglyceridemia, hyperhomocysteinemia, and hyperuricemia. Predisposing risk factors include a positive family history. A paternal myocardial infarction before 55 years of age or a maternal myocardial infarction before 60 years of age is considered a predisposing risk factor. Age and sex are classified as predisposing, nonmodifiable risk factors.
Level 1 Screening
Level 1 screening is begun at 40 years of age or sooner in individuals with a very high familial risk. Risk factors are assessed, and it is determined whether there is a prior history of disease in other vascular regions. If there is a positive history of stroke or vascular aneurysm or a current history of peripheral arterial vascular disease, the individual is placed in a high-risk category with an event rate (fatal or nonfatal myocardial infarction) greater than 2% per year (Fig. 8.16). Patients with diabetes mellitus are also considered to be at high risk. The various patient data can be combined with tabulated data from the Framing-ham Study, PROCAM Study, or European Society of Cardiology to calculate a risk score (Fig. 8.17). These risk scores are based on large prospective studies that were able to correlate cardiac events with specific constellations of risk factors.
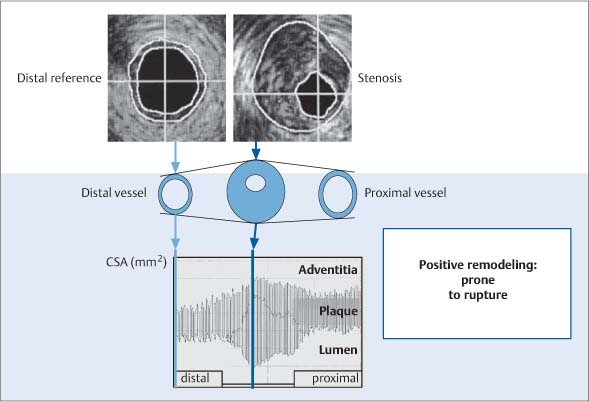
Fig. 8.9 Positive (compensatory) remodeling demonstrated by intravascular ultrasound. The largest vascular diameter is observed in the area of greatest plaque formation (center of the display, greatest distance between the adventitia and lumen). By comparison, the proximal and distal vascular segments are smaller and show less plaque formation. Plaques associated with positive remodeling are more vulnerable to plaque rupture.10
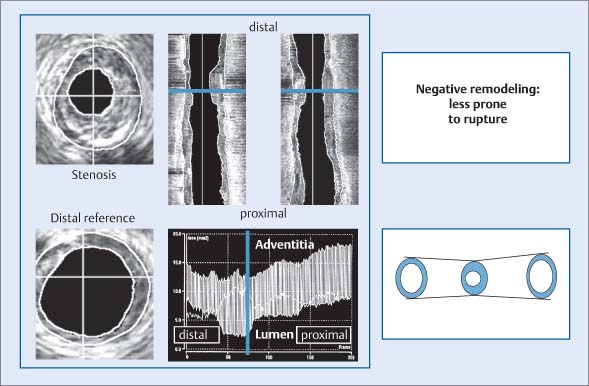
Fig. 8.10 Plaque formation with negative remodeling demonstrated by intravascular ultrasound during distal-to-proximal catheter withdrawal. The largest vascular diameter is not found in the area of greatest luminal narrowing, as the vascular area in that segment is reduced compared with the proximal and distal segments. The smallest vessel diameter based on lumen–adventitia distance is found in the stenotic segment. Lesions with negative remodeling are less vulnerable to plaque rupture.10
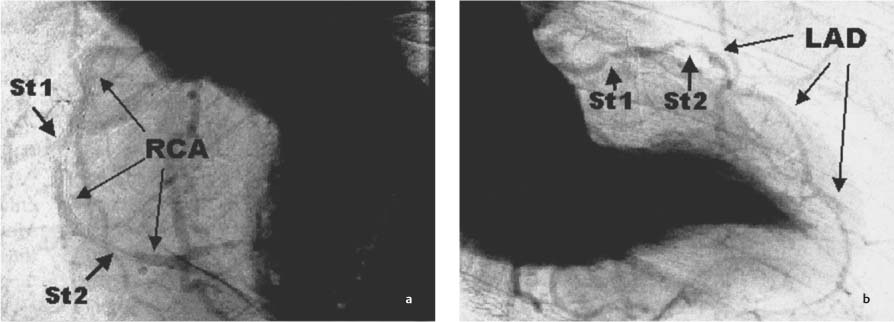
Fig. 8.11a, b Example of synchrotron angiography with visualization of the left ventricle and of the RCA and LAD. Quantifiable stenosis (St1/St2) are clearly demonstrated. a LAO 60° projection. b RAO 30° projection. (With kind permission of Professor A. H. Walenta, Siegen, and S. Möhlenkamp, Essen, Germany.)
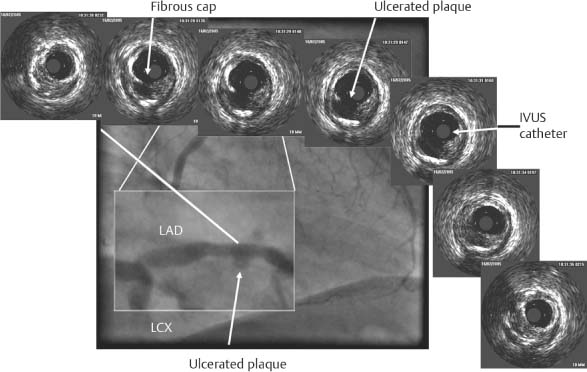
Fig. 8.12 Coronary angiogram shows an enlarged LAD with a ruptured plaque. Proximal-to-distal series of IVUS images (from left to right) demonstrate a ruptured and ulcerated plaque. Remnants of the fibrous cap can be identified along with vascular remodeling (vessel diameter at the plaque rupture site is expanded relative to proximal and distal diameters). (With kind permission of D. Böse, Essen, Germany.)
The 10-year risk is classified as follows:
• Low = less than 10%
• Intermediate = 10–20%
• High = greater than 20% (Fig. 8.16)
Level 2
It is recommended that persons with an intermediate risk for cardiac events be screened for signs of subclinical atherosclerosis.39
The European Society of Cardiology (Fig. 8.16) and German Society of Cardiology have issued the following recommendations:
• Use vascular ultrasound to check for signs of sclerosis in peripheral vessels, especially the carotid arteries, and determine the intima-media thickness.
• Determine the ratio of blood pressure readings on the thigh and upper arm (the ankle—brachial index or ABI).
• Check for vascular calcifications with CT.
• Determine high-sensitivity C-reactive protein (hs-CRP test).
• Prescribe a stress ECG for males 45–65 years of age.
To date, contrast-enhanced CT imaging has not been recommended for the detection of noncalcified plaques owing to concerns about radiation exposure. If the Agatston score is higher than 100, the risk of myocardial infarction is markedly increased. An Agatston score between 400 and 1000 predicts a substantial event rate.40,41 There is no strong correlation between risk factors and coronary vascular calcification, and so the detection of vascular calcification may be viewed as an additional “risk factor.”42
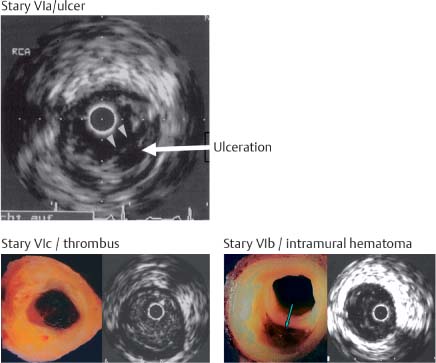
Fig. 8.13 Complicated plaques: IVUS image of Stary VIa ruptured and ulcerated plaque, pathoanatomical view plus IVUS of Stary VIb intramural hemorrhage, and pathoanatomical view plus IVUS of Stary VIc ruptured plaque with complete luminal thrombosis.13,20,23
Causal risk factors | • Hyperlipoproteinemia • Arterial hypertension • Nicotine abuse • Diabetes mellitus |
Possible risk factors | • Low HDL • Hypertriglyceridemia • Hyperlipoproteinemia (a) • Hyperhomocysteinemia • Hyperfibrinogenemia • Elevated plasminogen activator inhibitor (PAI) • Increased hs-CRP |
Predisposing risk factors | • Obesity • Sedentary lifestyle • Positive family history • Male sex • Insulin resistance • Socioeconomic factors • Psychosocial factors |
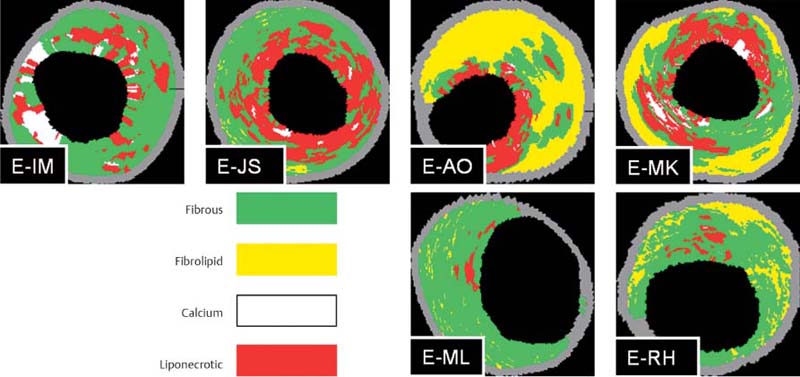
Fig. 8.14 Virtual histology with coronary IVUS. The images show a variety of plaque compositions with fibrous, fibrolipid, calcifying, and liponecrotic components. (With kind permission of D. Böse, Essen, Germany.)
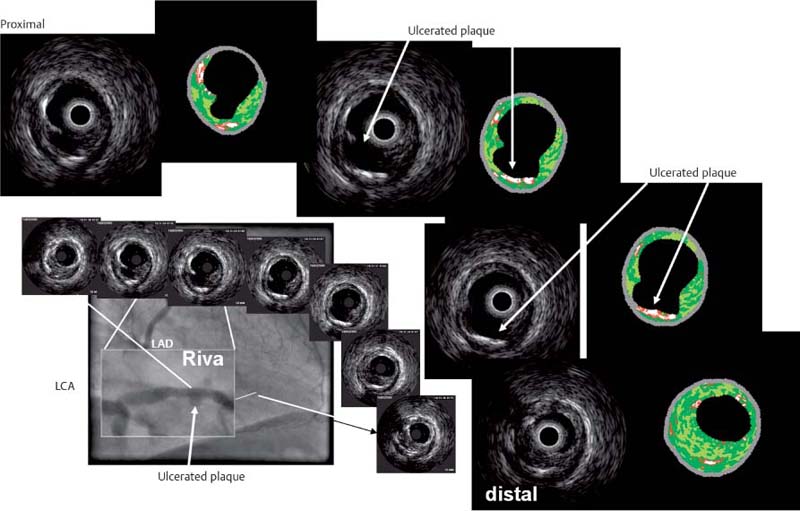
Fig. 8.15 Virtual histology of coronary IVUS images of ruptured plaque (Stary VIa) (see also Fig. 8.12). The images show predominantly fibrous and lipid-rich components. Calcifying and liponecrotic elements are found at the base of the ulcerated plaque. Proximal-to-distal series of IVUS images (from upper left to lower right). Arrows = ulcerated plaque. (With kind permission of D. Böse, Essen, Germany.)
Because inflammatory processes are also involved in the pathogenesis of acute coronary syndromes, the determination of C-reactive protein—the high-sensitivity CRP test—is recommended so that a differential risk assessment can be made in the low range of CRP concentrations (< 1, 1–3, > 3 ng/mL).21,43,44
Only a weak correlation exists between the detection of atherosclerosis in the cervical vessels and its presence in the coronary vessels. Significant coronary vascular changes may exist in the absence of detectable carotid deposits.
The Heinz–Nixdorf Recall Study is the first large population-based study in Germany to test the predictive value of electron beam computed tomography. A total of 4814 participants 45–75 years of age were recruited for the study45,46 and have been followed over a 5-year period until 2008.
The prevalence of coronary vascular calcifications in the Heinz–Nixdorf Recall Study was 84% in the male participants and 54% in the female participants aged 45–74 years. Twenty percent of the men and 60% of the women had no vascular calcifications. Values > 100 were found in ~40% and 15% of the study participants, respectively, and values > 400 were found in 16% and 4%. Cervical vascular plaques were found in only 43% of participants, and an abnormal ABI index was found in 9%. With aging, this percentage rose to 15% in males and to 11% in females.
Stress ECG for risk stratification is recommended in men 45–64 years of age18,43 but not in women. Physical fitness is measured by overall exercise tolerance and the rate of heart rate recovery after exercise. The decline in heart rate after the conclusion of exercise is evaluated. Heart rate recovery should be 12–15/min measured 1 minute into the recovery phase of the exercise protocol.
The determination of intima-media thickness has proved to be a valuable test in large pharmacological studies, but it has not yet come into routine clinical use. Age- and sex-specific factors must be taken into account, but plaque formation is a sign of increased risk.
Current studies are dealing with the question of whether and in what groups the analysis of subclinical atherosclerosis can contribute to the assessment of coronary risk.
It remains unclear whether and at what intervals imaging should be repeated for the detection of subclinical atherosclerosis. It is generally recommended that screening be repeated at 3–5 years if the initial result was negative and the patient is over 45 years of age.
Level Prevention Strategy
After a preliminary examination by the physician, an individual risk assessment is made based on detectable modifiable and nonmodifiable causal risk factors and the prior history of the person examined, who at this preventive stage should not yet be classified as a patient (Fig. 8.16). If the risk is determined to be < 1%/year, a healthful lifestyle is recommended that includes good nutrition, regular physical exercise, and a low-stress environment. If the risk is deemed to be high, indicating a greater than 2% likelihood of cardiac events per year, the management of risk factors should be optimized to achieve the target values for blood pressure, cholesterol, and HbA1. Usually this will require a combined drug regimen of aspirin therapy, statins, angiotensin-converting enzyme (ACE) inhibitors or angiotensin-receptor antagonists (AT 1), and β-blockers.
In the large group of persons at intermediate risk, where there is a 1–2% likelihood of cardiac events per year, diagnostic tests are aimed at detecting signs of subclinical atherosclerosis. Primary emphasis is placed on the detection of coronary calcifications as a surrogate parameter for coronary plaque formation and on the detection of cardiac atherosclerosis. If vascular calcifications are detected and if they reach a value that exceeds the 75th percentile or an Agatston score of 100, the risk should be adjusted to a level higher than 2% per year. If these signs are absent, the risk is considered to be low. Follow-up examinations for reevaluation should be scheduled every 3–5 years. The patient is counseled to adopt healthier living habits.18,47
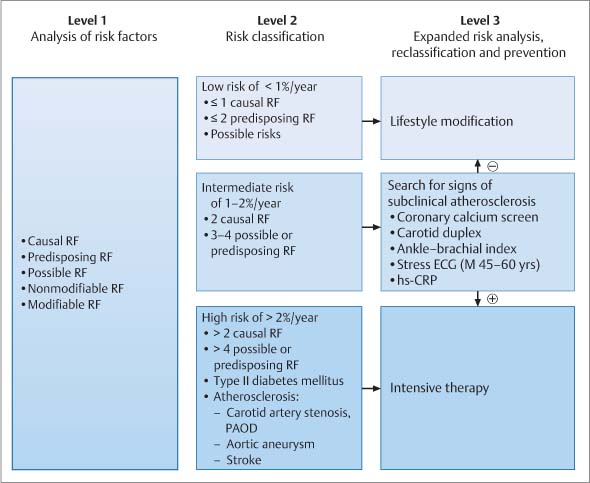
Fig. 8.16 Risk stratification. Level 1: risk analysis for assessing low risk, intermediate risk, and high risk based on determination of risk factors and cardiovascular history. Level 2: risk classification for use of imaging and nonimaging techniques in persons at intermediate risk to check for signs of subclinical atherosclerosis. Level 3: reclassification in those with intermediate risk and lifestyle modification if signs are negative (–) intensive therapy if signs are positive (+)22,32
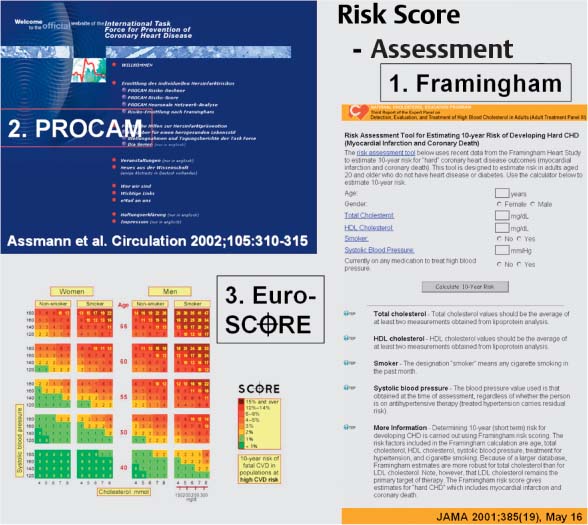
Fig. 8.17 Framingham, PROCAM, and EuroSCORE for risk assessment based on risk factors in level 1 risk stratification.160,177,178
If an extremely high risk is found, such as an Agatston score > 1000 or a percentile value above 90, the patient should be evaluated for ischemic disease by stress ECG and stress echocardiography. Patients with a negative stress ECG should undergo stress scintigraphy or echo cardiography because of the high risk. Cardiovascular events have been documented in up to 20% of high-risk patients within a 1-year period.40
Acute Ischemia
Cardiovascular diseases are the leading cause of death in industrialized western countries. Myocardial infarction is by far the leading cause, although mortality rates have been declining since 1979. Without question, the gain of life expectancy in recent years is attributable to improvements in the treatment of underlying cardiovascular diseases.48 The multifactorial etiology of myocardial infarction is known, and the assessment of risk factors using the PROCAM score (Prospective Cardiovascular Munster Heart Study) plus additional questions about the patient’s lifestyle in the Interheart Study demonstrated a 90% accuracy in the prediction of myocardial infarction.49
The heart failure that may result from myocardial infarction has a high mortality rate. It would be desirable, therefore, to have a method that could detect the development of potentially severe heart failure after an acute infarction at an early stage. Cardiac MRI, with its ability to analyze myocardial texture in the early phase after myocardial infarction, can provide this type of information.50
Pathophysiology of Myocardial Ischemia in Relation to Cardiac MRI
Infarct Size and Collateral Vessels
In patients with typical anginal symptoms, the diagnosis of myocardial ischemia should be established within 4–6 hours after the onset of complaints so that the causative thrombus can be eliminated and the affected coronary artery can be recanalized. The goal is to prevent myocardial cell death by restoring perfusion as quickly as possible to reduce the size of the infarct.51
The classic pathophysiological interpretation of coronary heart disease as an imbalance between oxygen supply and demand has changed in recent years based on research indicating:
• Contractile dysfunction despite the restoration and normalization of perfusion (stunning)52
• The recovery of metabolic parameters with persistence of ischemia and depression of myocardial function (hibernation)53,54
• The presence of protective endogenous mechanisms (ischemic preconditioning)55
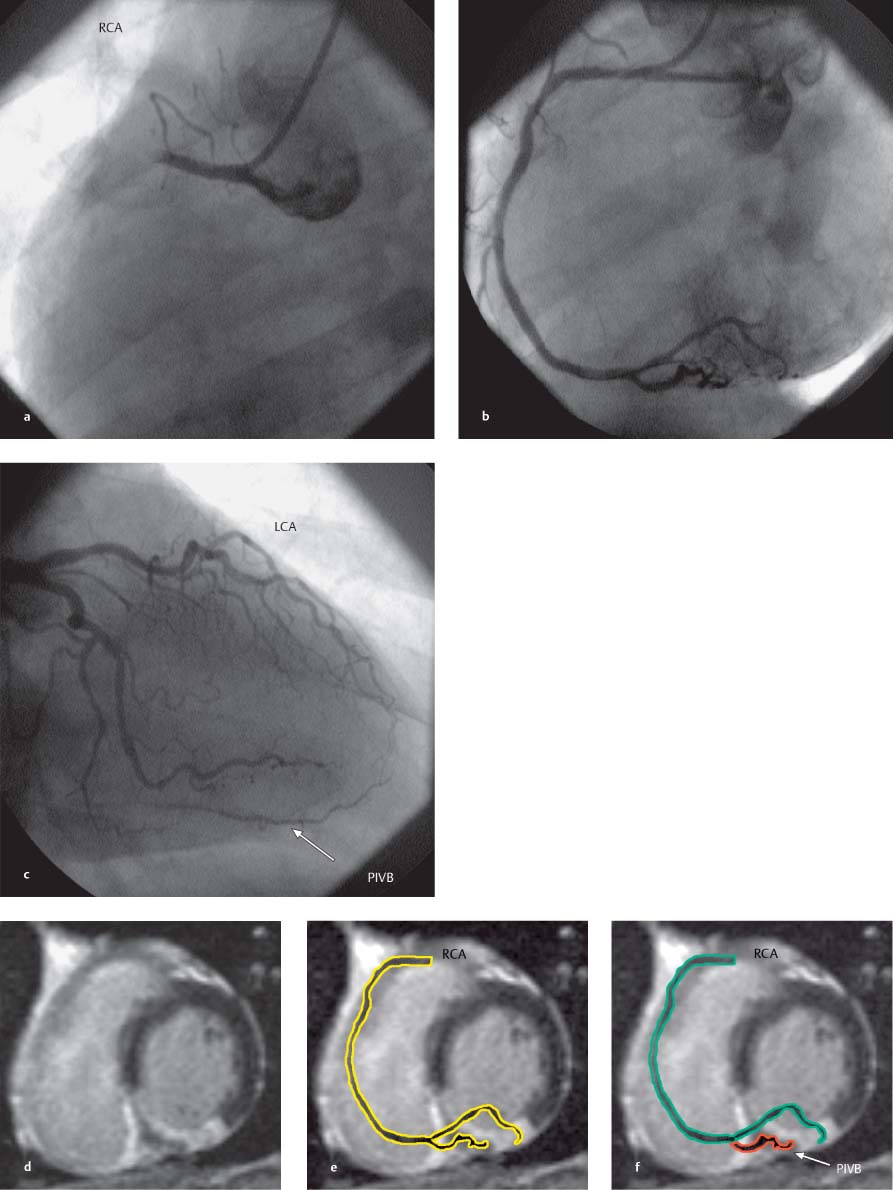
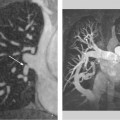
Fig. 8.18a–f Acute occlusion of the RCA with reperfusion following acute stent PTCA. MR images were acquired 6 months after the intervention.
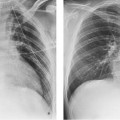
a Coronary angiogram demonstrates occlusion of the RCA.
b Angiogram after successful recanalization.
c Angiogram of the LCA at the time of RCA occlusion. The PIVB is opacified by collaterals from the LAD.
d Contrast-enhanced MRI of late enhancement in the short-axis view. An area of intact myocardium is identified in the posterior septum.
e Contrast-enhanced MRI in the short-axis view with the RCA schematically superimposed on the image.
f Collateral blood flow to the PIVB prevents postinfarction necrosis of the myocardial cells.
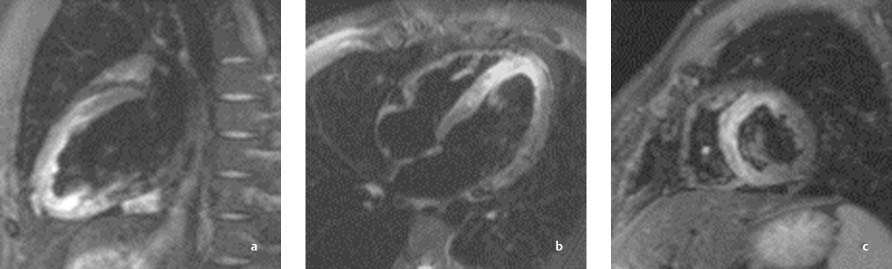
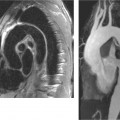
Fig. 8.19 a–c Anterior wall infarction with successful recanalization of the LAD. Images 24 hours after intervention demonstrate successful reperfusion. The anterosuperior infarcted area in the LAD territory appears hyperintense in fat-suppressed sequences (STIR).
a Sagittal long-axis slice through the left ventricle.
b Horizontal long-axis slice.
c Short-axis slice.
Cardiac MRI can demonstrate these phenomena experimentally and under clinical conditions, as after the recanalization of an occluded vessel or in chronic ischemic coronary heart disease. Depending on the development of myocardial collateral vessels, the ischemic area may feature a variety of pathophysiological mechanisms with associated myocardial injury. These mechanisms can be differentiated with MRI (Fig. 8.18).
Additionally, studies on the pathophysiology of acute myocardial infarction have documented the effects of inflammatory processes that are known collectively as reperfusion injury.56,57 This term mainly denotes a progression from reversible to irreversible cell damage during reperfusion and the development of microvascular obstruction in a previously occluded or underperfused region. Cardiac MRI can detect these perfusion abnormalities clinically and can also quantitate their severity.58–61
On the whole, successful reperfusion of the heart leads to a reduction in mortality. Nevertheless, there are cases in which myocardial reperfusion leads to a paradoxical deterioration of the clinical status with an increase in the size of the infarct and prognostically unfavorable left ventricular dilatation. The exact pathophysiological causes of reperfusion injury as well as post-ischemic remodeling are not yet fully understood. But with its ability to visualize the myocardium and fibrotic tissue, cardiac MRI can significantly advance our understanding of scar remodeling in the infarcted heart (see Fig. 8.20).
The severity of myocardial injury varies in different areas. For example, subepicardial tissue layers can tolerate ischemia for a considerably longer time than subendocardial layers. MRI can demonstrate these subendocardial infarcts better than any other cardiac imaging modality.62
Other determinants of myocardial infarct size besides the duration of occlusion are:
• The size of the territory supplied by the occluded artery
• The oxygen demand at the time of the occlusion63
• The level of residual blood flow through collateral vessels64,65 (Fig. 8.18)
• The variable ischemic tolerance of the myocardium55
Myocardial Metabolism and Contractile Function
Under normal circumstances, the myocardium derives its energy from aerobic glycolysis, the citric acid cycle, and oxidative phosphorylation. When blood flow ceases owing to coronary occlusion, the myocardium consumes physically dissolved oxygen and the oxygen bound to myoglobin within a matter of seconds. Aerobic myocardial metabolism can still take place during this phase. But when a critical oxygen partial pressure (Po2) is reached and oxidative phosphorylation is curtailed, anaerobic glycolysis is activated and glycolytic flux is increased. Despite the increase in anaerobic glycolysis, the energy yield is limited and an energy deficit develops.
This energy deficit compromises the energy-intensive metabolism of the intracellular membranes, leading to an electrolyte imbalance with intracellular edema. This process appears as a cloudy swelling on light microscopy, while electron microscopy shows distention of the mitochondria and membranes of the endoplasmic reticulum. The edematous tissue shows increased signal intensity in fat-suppressed MRI sequences (Fig. 8.19). If the vascular occlusion persists, the duration of ischemia may be sufficient to cause necrosis.
Owing to the presence of native collateral vessels, a mixed situation develops at the periphery of the ischemic area. The collateral vessels can still supply a small amount of oxygen that is sufficient to clear acid metabolites, reduce intracellular acidosis, and increase the glycolytic flux in these areas.66 This collateral perfusion is sufficient to prevent full-thickness transmural injury (Fig. 8.18).
When vascular occlusion occurs, an acute failure of myocardial contractility arises within a few cardiac cycles. Initial hypokinesia with decrease of systolic function is followed swiftly by akinesia. This is usually replaced by dyskinesia after a period up to 2 minutes.
These segmental contraction abnormalities in the form of hypokinesia, akinesia, and dyskinesia can be visualized by echocardiography or cine MRI and myocardial tagging, and they can be quantified by computer-assisted analysis.67
Two special types of contraction abnormality can be observed following myocardial ischemia with reperfusion: myocardial stunning in cases with complete postischemic restoration of blood flow3 and hibernating myocardium in cases with a sustained perfusion deficit and hypokinesia in the ischemic area.53 Both conditions may occur after reperfusion of a previously ischemic area mainly in the border zone, and both can cause impairment of cardiac function. Cardiac MRI after myocardial infarction can detect these functional abnormalities of the myocardium depending on the degree of myocardial injury relating to perfusion and wall motion.
Local Pathogenic Mechanisms in Ischemia: Reperfusion
Early Metabolic Abnormalities and Mechanical Cell Damage
Reperfusion injury in the broad sense can be interpreted as a progression from reversible cell damage at the time of reperfusion to a state of irreversible cell damage.68 Currently there are two state-of-the-art clinical treatment options for the reduction of myocardial injury:
• Acute percutaneous transluminal angioplasty (PTCA)
• Pharmacological thrombolysis51
A knowledge of cytotoxic agents and their management during reperfusion can provide an interesting approach to reducing the extent of cell damage and influencing myocardial remodeling after an infarction. From a pharmacological standpoint, we know that myocardial fibrosis can be positively influenced by the administration of aldosterone antagonists, ACE inhibitors, and angiotensin receptor antagonists. Other medical treatment strategies are undergoing preclinical trials. Cardiac MRI is a radiation-free imaging study that can be repeated as often as desired to monitor changes in the myocardium following ischemia and reperfusion.69,70
The time course of reperfusion injury can be subdivided into immediate injury (occurring in seconds) and delayed injury (occurring in ~1–5 minutes).71 There are additional processes that are initiated during this period but do not become apparent for 12–48 hours (e. g., apoptosis) and may have a long-term effect on remodeling during the next 4–8 weeks (scar formation, activation of myofibroblasts).
Initial mechanisms of reperfusion include immediate energy provision and its immediate utilization by reactivation of the ATP-dependent sodium–potassium pump (Na+-K+ ATPase), causing an increase in the transmembrane sodium gradient. This mechanism can be visualized by sodium imaging with MRI but currently has only an experimental role.72
The rapid normalization of tissue osmolality and tissue pH are additional mechanisms responsible for the immediate development of postischemic intracellular edema, cell swelling, and rupture of the cell membranes.73 The resulting myocardial edema can be visualized in fat-suppressed MRI sequences (Fig. 8.19).50
Other mechanisms such as “no reflow”74 and myocardial hemorrhage75 that occur acutely after the restoration of coronary blood flow have adverse microcirculatory effects and lead to microvascular obstruction, which can also be demonstrated by MRI (Fig. 8.20a–d).76
Inflammatory Mechanisms
The early pathogenic mechanisms following reperfusion are accompanied by an increasing interaction between humoral and cellular systems such as surface adhesion molecules77 with an increase in leukocyte adhesion (e. g., CD-18, ICAM-1) and cellular migration into the extracellular space. These are manifestations of an increasing local cellular inflammatory activity.
In the humoral system, contact activation during the initial minutes after reperfusion evokes an early procoagulant response in both the intrinsic and extrinsic coagulation systems.78 This leads to endothelial and microvascular dysfunction during the first few minutes after reperfusion.79,80 Increased free-radical formation also occurs81 along with activation of the fibrinolytic system, the bradykinin–kinin system, and the complement system.56,78
The reperfusion of ischemic myocardium is important not only for the survival of myocardial cells but also for scar formation.70 Experiments have shown that even late reperfusion can reduce the extent of aneurysm formation in the infarcted area compared with unremitting coronary occlusion.82 The healing process after reperfusion also includes increased angiogenesis in the ischemic/reperfused area.83
Very few clinical data are available on how longer-term damage due to inflammatory activation after ischemia and reperfusion may affect scar formation in left ventricular remodeling. Contrast-enhanced cardiac MRI can provide important information on this process.50,63
Viability Assessment in Cardiac MRI
Cardiac MRI is already improving our morphological and functional understanding of the pathophysiological processes (see above) involved in ischemic and reperfused myocardium. From a technological standpoint, all of the imaging sequences necessary for this type of investigation can be completed in ~60 minutes during one examination. The quantitative determination of myocardial fibrosis, the semiquantitative and quantitative measurement of myocardial perfusion, and the investigation of regional and global function parameters can provide a comprehensive assessment of the viability of the myocardium and its varying pathophysiological states. Cardiac MRI is able to discriminate among infarcted nonviable and still viable myocardium, hibernating myocardium, and stunned myocardium.50
Myocardial Edema
During the early phase after recanalization, edema develops in the ischemic–reperfused myocardium. This process is characterized by a barrier breakdown with a local capillary leak confined to the reperfused area and a consequent influx of water into the interstitium. This reperfusion edema is demonstrable by MRI (Fig. 8.19).50 By suppressing signals from myocardium and fat, the increased water protons in the myocardium can be used to generate signals.84 The aggravation of barrier breakdown also contributes to increased contrast uptake in the edematous area (Fig. 8.21b, c).
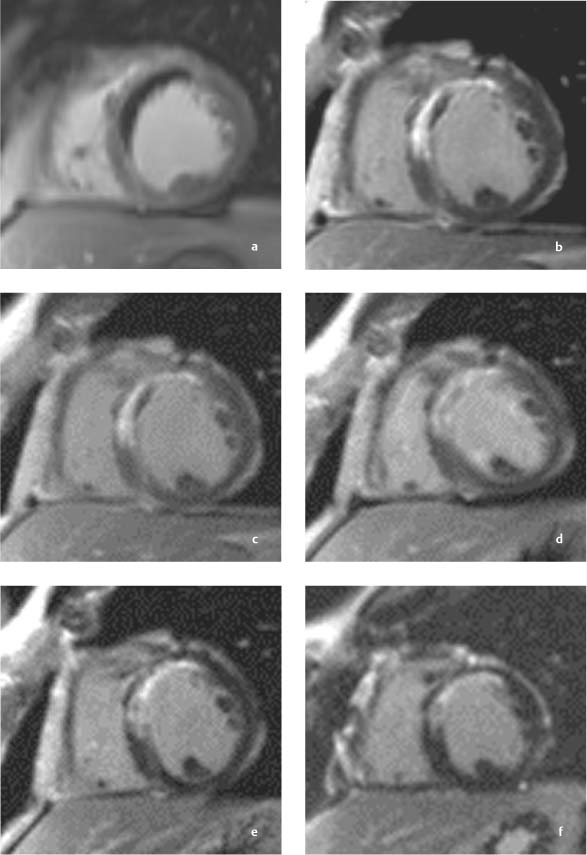
Fig. 8.20a–c Contrast-enhanced MRI in a patient with myocardial infarction and successful stent PTCA of the LAD.
a, b MRI examination 24 hours after reperfusion.
a Image 2 minutes after contrast administration clearly delineates a central area of signal void (hypoenhancement) indicating microvascular obstruction (MO) with a very narrow hyperenhancing rim (early enhancement). b Image 10 minute after contrast administration shows a marked decrease in the size of the MO with a larger hyperenhancing rim (late enhancement).
c, d MRI examination 10 days after reperfusion.
c Early images after contrast administration show marked regression of the area of MO (early enhancement).
d Regression of late enhancement.
e MRI 6 months after reperfusion.
f MRI 12 months after reperfusion.
e By 6 months, an MO area is no longer visible after contrast administration.
f Image 12 months postinfarction shows a further decrease in the late enhancement zone. This decrease cannot be attributed entirely to scar contraction in the infarcted area.
Contrast-Enhanced MRI
Paramagnetic contrast agents (e. g., Gd-DTPA) can be used to differentiate myocardium from fibrosis.85 The fibrotic tissue in a myocardial scar displays late (delayed) hyperenhancement, which distinguishes it from the weak enhancement of viable myocardium (Figs. 8.18, 8.20, see also Chapter 6, p. 116 ff).
From a pathophysiological standpoint, different structures in the various tissue compartments are responsible for the variable wash-in and delayed wash-out of contrast medium in viable myocardium and fibrotic and necrotic tissue.86
Visualization of a myocardial scar (e. g., after myocardial infarction) depends on the selection of scan parameters for contrast-enhanced (CE-) MRI, the contrast dose, and the timing of image acquisition after contrast administration.87 A variable degree of late enhancement is also seen during follow-ups of early remodeling processes after myocardial infarction (Fig. 8.20).
The extent of late enhancement after consolidation of the myocardial scar is useful in predicting the improvement in regional wall motion that may be expected from successful revascularization by aortocoronary bypass (ACB) surgery or percutaneous balloon dilation (PTCA).85,88 When transmural late enhancement encompasses 50–75% of the wall thickness, it is likely that revascularization will produce very little improvement in regional contractility. Greater than 75% of transmural late enhancement is predictive of no improvement. An inverse correlation also exists between the extent of late enhancement and left ventricular global ejection fraction.69 There is no direct correlation between the transmural extent of late enhancement after myocardial infarction and the degree of ECG changes in the acute phase.69 It has been found that contrast-enhanced MRI is significantly better than nuclear medicine imaging for the detection of small subendocardial infarcts.62
When postinfarction CE-MRI is performed in the early phase after contrast administration (early-enhancement imaging at ~2 minutes after contrast injection), areas of microvascular obstruction in the myocardium appear as nonenhancing areas that are much easier to detect than on late-enhancement images taken at ~10–15 minutes after contrast application (Fig. 8.20).50 Moreover, the area of microvascular obstruction appears significantly larger at 2 minutes postinjection than at 10 minutes. The detection of microvascular obstruction also has prognostic implications.63 The earlier cardiac MRI can be performed after myocardial infarction, with or without recanalization, the more accurately can the individual ischemic area at the time of coronary occlusion (area at risk) be determined.56 This permits a noninvasive follow-up of myocardial infarction with determination of the nonperfused ischemic area at risk at the time of the occlusion and the scar that will develop in that area with passage of time. Thus, cardiac MRI is the only modality that can noninvasively evaluate the therapeutic effect of ischemia–reperfusion on scar reduction with an acceptable spatial resolution.
Contrast-enhanced cardiac MRI can advance the differential diagnosis of primary and secondary structural myocardial diseases such as dilated cardiomyopathy, hypertrophic cardiomyopathy, arrhythmogenic right ventricular dysplasia, and left ventricular noncompaction (see also Chapter 9).50 Increased tissue heterogeneity of the measured signal-intensity in CE-MRI of the infarct border zone was strongly associated with the inducibility of ventricular tachycardia.89
Perfusion Analysis
The assessment of myocardial perfusion is of key importance in various pathophysiological states that follow ischemia/reperfusion (stunning, infarction, hibernation). The normalization of perfusion after ischemia–reperfusion may preserve the viability of ischemic myocardium.79
Both semiquantitative and quantitative contrast-enhanced methods are currently available for the analysis of myocardial perfusion. These methods are important in the noninvasive diagnosis of coronary heart disease as well as other myocardial diseases. The time-varying enhancement of the myocardial tissue can be analyzed with computer software that compares myocardial perfusion at rest and during pharmacological vasodilation (adenosine) to determine the regional perfusion reserve index. Based on the results of various studies, a diminished perfusion reserve with an index less than 1.5 is suspicious for a significant flow reduction due to coronary stenosis.58,61,90 Perfusion can be quantified with the aid of special algorithms that take into account the distribution of contrast agent in various compartments.59,91 A very good correlation has been found between experimental flow measurements and flow quantification by cardiac MRI.60 Clinical studies show that the semi-quantitative and quantitative methods yield equally good results.90
Meanwhile, improved MRI sequences have made it possible to discriminate between endocardial and epicardial perfusion.92 In one study, MRI was able to detect subendocardial hypoperfusion in patients with a clinical diagnosis of cardiac syndrome X.93
Similar to the myocardial perfusion reserve, the bypass flow reserve can be determined in coronary bypass grafts with phase-contrast MRI to make a functional assessment of the grafts.94 Technical refinements in pulse sequences also make it possible to determine the flow reserve in non-contrast-enhanced coronary vessels with cardiac MRI.95
Established perfusion-reserve tests that compare rest perfusion with adenosine stress perfusion are not recommended for routine testing in the acute phase after myocardial infarction because of limitations on the use of adenosine stress. A much better strategy is to use quantitative methods for the clinical evaluation of resting myocardial blood flow during the early phase after myocardial infarction. Experiments have shown that these methods are also useful in the evaluation of critical myocardial perfusion.60,79
Wall-Motion Analysis
Wall-motion analysis with cine MRI provides information on the pathophysiological status of the myocardium after an infarction. Again, routine stress testing is not recommended in the early phase after myocardial infarction because of the consumption of high-energy substrates. As in echocardiography, myocardial wall motion in cine sequences can be analyzed semiquantitatively and quantitatively based on standard segmental models.67,96 Pharmacological stress can also be used in cardiac MRI but should be avoided in the early period after an infarction.97,98 The percentage of nondiagnostic scans is significantly lower in stress MRI than in stress echocardiography, however.99 In routine clinical follow-ups as well as investigational studies, cardiac MRI is excellent for regional and volumetric quantitative measurements and interpretation. The quantification of perfusion, wall-motion analysis, and contrast-enhanced MRI is an effective combination that can discriminate among hibernating, stunned, and infarcted myocardium.
In summary, cardiac MRI can demonstrate the progression of myocardial injury with or without IV contrast administration, depending on the type of sequence used (Fig. 8.21).
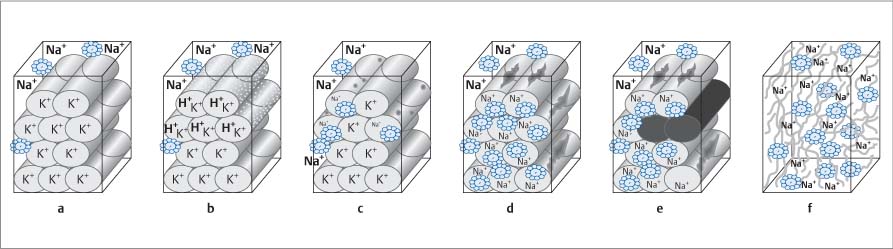
Fig. 8.21 a–f Progressive stages of cellular damage and their effect on contrast-enhanced MR imaging (modified from Mahrholdt et al., 200286).
a Normal cells.
b Membranous capillary leak with water influx into the cell.
c
Related posts:
Stay updated, free articles. Join our Telegram channel

Full access? Get Clinical Tree


