4 Creation of a color flow image
Collection of 2D Doppler information
Methods of estimating the velocity of blood
Elements of a color flow scanner
Effect of angle of insonation on the color flow image
Aliasing in color flow imaging
Lower and upper limits to the velocity displayed
Resolution and sensitivity of color flow imaging
Enhanced flow imaging using contrast agents and harmonic imaging
COLLECTION OF 2D DOPPLER INFORMATION
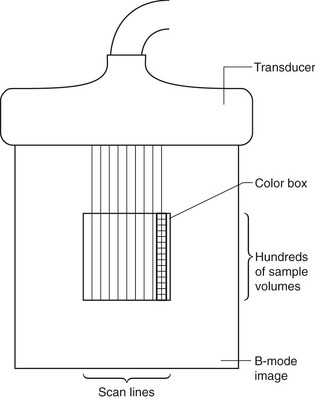
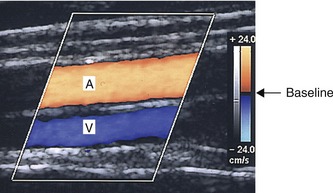
The two-dimensional (2D) color flow map is created by detecting the back-scattered signals from hundreds of sample volumes along each scan line and using over a hundred of scan lines to cover the ROI, as shown in Figure 4.1. The scanner divides the back-scattered signal into hundreds of samples along the scan line, each sample being at a different time delay after the transmitted pulse, and therefore returning from a slightly different depth in the tissue. The depth from which a signal has returned can be calculated from this time delay, using the speed of sound in tissue, in the same way as is used in pulse echo imaging. Several pulses must be transmitted and received along the scan line for the movement of the blood to be detected. Once sufficient samples have been detected from each sample volume to allow estimation of the blood velocity relative to the beam, a second scan line adjacent to the first can be produced. Hundreds of scan lines may be used to produce the 2D color flow image. The estimated mean relative velocity (equivalent to the Doppler frequency) from each sample volume within the tissue can be displayed in color, as shown in Figure 4.2. In this image of an artery lying next to a vein, the Doppler shift frequencies produced by flow toward the transducer are displayed in red, and those produced by flow away from the transducer are shown in blue. The higher relative velocities are shown as yellow and turquoise, whereas the lower relative velocities are displayed as deep red and deep blue.
METHODS OF ESTIMATING THE VELOCITY OF BLOOD
Spectral Doppler ultrasound uses fast Fourier transform (FFT) to provide detailed information on the frequency content of the Doppler signal. However, the time needed to collect sufficient data to perform an FFT on the signals obtained from several scan lines would be so great that it would take several seconds to produce each color image. This would not be a suitable method for imaging pulsatile blood flow. The FFT would also produce more information than could be easily displayed on the image, as each color pixel can only represent one value of velocity at any point in the color image, unlike the range of frequencies that can be displayed on the spectral display. Real-time color flow imaging has been made possible by the use of alternative techniques to estimate the mean velocity of blood relative to the beam. It requires only a few pulses to estimate the mean relative velocity, making the process faster to perform. The method used relies on the facts that the ultrasound is back-scattered from groups of blood cells that remain in the same formation during the time taken to perform the velocity estimate and that the echo intensity pattern is different for different groups of cells. This allows a group of cells to be tracked as it moves through the sample volume. The velocity of the group of cells does not change significantly during the short time over which the blood flow velocity is being estimated.
Figure 4.3 shows the shapes of three consecutive returning pulses as a group of blood cells passes through the sample volume. A short delay is introduced into the signal returning from a given group of cells as they move farther away from the transducer between pulses. An estimate of the velocity can be made by detecting this delay in the echo complex. This shift in the waveform can be understood in two ways. First, it can be considered as a time delay introduced between returning pulses as the group of cells moves. Second, it can be considered as a phase shift of the signal between two pulses scattered from the same sample volume. To understand the concept of a phase shift, consider an example using two clocks. If both the clocks are set to read the same time, both minute hands will be moving at the same speed, giving a frequency of one complete revolution of the clock face an hour. Both clocks will also be in phase with each other (i.e., the minute hand will appear at the 12 on both clocks at the same time), giving a phase shift of zero. If, however, one clock has the minute hand set 30 min behind the other, the minute hands will still complete one revolution of the clock face an hour, but the two clocks will now be out of phase and the clock hands will appear at different places on the clock face. The time delay between the two clocks will be 30 min, or alternatively this delay could be measured as a phase shift, which in this case would be half a cycle of the clock face.
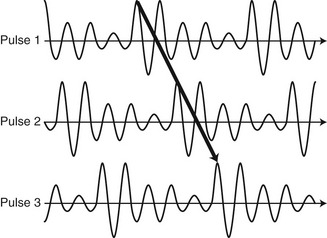
The delay between the returning ultrasound signals from the first and second pulses shown in Figure 4.3 can be measured in terms of a phase shift. We can see that the second signal is the same shape as the first but is delayed. This is analogous to the clock hands traveling at the same speed but with the second clock being half a cycle behind the first. A similar phase shift can be measured between signals 2 and 3. These phase shifts can be used to estimate the velocity of the blood. This method does not actually measure the Doppler shift frequency; however, the shape of the detected signal is similar to the Doppler shift that would be obtained from a continuous-wave system and therefore can be described by the Doppler equation.
ELEMENTS OF A COLOR FLOW SCANNER
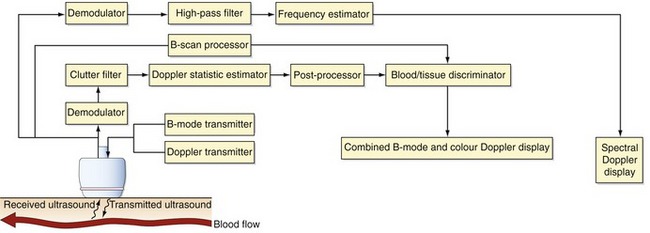
Figure 4.4 shows the basic elements of a color flow scanner. Before any analysis of the returning echoes is carried out, the signal is filtered by the clutter filter to remove the high-amplitude signals returning from the surrounding stationary tissue and the slow-moving vessel walls, while preserving the low-amplitude signals from the blood. The filtered signal is then analyzed to obtain an estimate of the mean relative velocity (Doppler shift frequency) in each sample volume using the Doppler statistic estimator, as described earlier. Postprocessing is then used to smooth the data in order to produce a less noisy color image. This can be done by combining the data obtained from consecutive images, known as frame-averaging. As each point on the image can only be assigned either a specific color or level of gray, a decision has to be made as to whether to display the pulse echo information or any flow information detected. This involves the process known as blood–tissue discrimination.
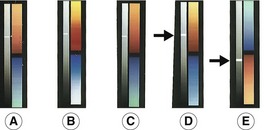
Color-coding the Doppler information
Having obtained a value of the mean Doppler frequency present in the multiple sample volumes, these data now have to be displayed on the image. This is done by color-coding the Doppler information. The color on the screen has three attributes: luminosity, hue, and saturation. Luminosity is the degree of brightness or shade of the displayed color; hue is the wavelength (i.e., the actual color displayed, from violet through red), and saturation is the degree to which the color is mixed with white light (e.g., from red through light pink, producing up to 20 identifiable tints). These three attributes can be used to produce a variety of color scales, as shown in Figure 4.5, which can be displayed as a bar at the side of the image. The scale usually consists of a different color representing different flow directions, with red often used to show flow toward the transducer and blue depicting flow away from the transducer. Most scanners allow the operator to invert the color scale in order to display flow toward the transducer as blue and flow away as red. This is indicated by inverting the color scale displayed at the side of the image (Fig. 4.5E). It is essential for the operator to be aware of which colors represent which directions of flow within the image, otherwise serious diagnostic errors can occur. Ultrasound scanners provide a range of color scales, and certain scales are more appropriate in particular imaging situations. The various color scales may be selected to accentuate the different parts of the range of detected relative velocities seen in different clinical situations. For example, in an arterial scan, the color scale may accentuate the differences in the upper portion to highlight velocity changes in the higher range of velocities.