A review of recent advances in brain imaging using positron emission tomography (PET) is presented in this article. Some properties of the high-resolution research tomograph are described as examples of state-of-the-art PET instrumentation. A summary of current research topics in image reconstruction and quantification is given, with emphasis on the requirements of brain dynamic imaging. A brief overview of image analysis methods is presented, together with some examples of the contributions of quantitative PET imaging to the current understanding of brain function and disease. PET findings must be evaluated in the context of clinical observations and complemented by other imaging modalities whenever possible to ensure a proper interpretation of the data.
The ability to image brain function in vivo has given us the unprecedented opportunity to unravel some of the mysteries of the human brain in health and disease in a noninvasive manner. Among several imaging techniques, positron emission tomography (PET) is the one that is best suited to investigate brain neurochemistry through the use of various radiotracers that tag specific biochemical processes. In its early days, the information provided by PET was mostly visual and was aimed at identifying the brain regions involved in specific functional processes. Tracer distribution patterns of healthy states and disease were compared, to understand which areas of the brain are functionally affected by different clinical syndromes. However, even in those early days, it was recognized that a unique aspect of PET imaging was its potential to provide a quantitative description of different aspects of brain function, which was to be achieved through the development of selective radiotracers, and the ability to achieve high-resolution images that could provide a quantitatively accurate description of the tracer spatial and temporal distribution. The last two decades have indeed witnessed great advances in radiochemistry and tracer development, and in the imaging, computing instrumentation, and algorithms necessary for image reconstruction and data interpretation. Quantitative interpretation of PET images is beginning to enable us to investigate disease mechanism and progression with a fair amount of detail. For example, multitracer longitudinal studies in subjects suffering from a specific disease can provide information on how multiple mechanisms are selectively affected by the disease and how they interrelate during the course of the disease. With PET, it is now possible to explore interactions between neurochemical pathways, investigate relationships between pharmacologic challenges and functional and behavioral response, monitor response to treatment strategies, and efficiently perform effect assessment in the development of new drugs. Currently, PET research applications span most brain diseases: movement disorders, dementias including Alzheimer’s disease, mood disorders and other psychiatric conditions, substance abuse, and others. In some applications, such as oncology and the treatment of epilepsy, PET is also commonly used in clinical environments.
This article presents recent advances that have contributed to state-of-the-art brain PET imaging, together with examples of how quantitative PET techniques are used in the investigation of selected brain diseases. The research in imaging algorithms and instrumentation development strives to provide a more quantitatively accurate representation of the tracer’s spatial and temporal distribution, which provides the basis for further data interpretation linking tracer distributions to the biologic parameters related to the process under investigation. The development of biochemically selective tracers plays an equally important role in PET; a comprehensive review of tracer development is, however, beyond the scope of this article and the reader is referred to many excellent reviews available in the literature . Only a few examples are given here in the context of a brief overview describing current PET use in brain research.
PET may be used to investigate different biochemical processes because PET imaging can be performed with different biochemical markers. Such markers are designed to be selective for the specific process or site of interest, and they are all labeled with positron emitters; the most commonly used radionuclides are 18 F (t 1/2 = 109.8 min), 11 C (t 1/2 = 20.4 min), 15 O (t 1/2 = 2.04 min), and 13 N (t 1/2 = 9.97 min). A PET image provides a three-dimensional spatial map of the distribution of the radiotracer concentration obtained from the detection of the two 511 keV gamma (γ) rays originating from the positron annihilation. When such maps are acquired over time and properly reconstructed to yield a quantitatively accurate measure of the tracer concentration distribution as a function of time, kinetic modeling can be used to determine the physiologic or pharmacokinetic properties of the investigated processes. The key steps in PET imaging are
- 1.
Identification of an appropriate target to be imaged, generally determined based on its relevance to a particular disease (such as neuroreceptors and neurotransmitters in neurodegeneration and psychiatric illnesses, amyloid plaques in Alzheimer’s disease, or energy metabolism in dementia).
- 2.
Development of radiotracers that interact specifically with that target.
- 3.
Development of imaging instrumentation and associated algorithms to obtain quantitative images.
- 4.
Development of appropriate kinetic modeling to allow a biologically meaningful quantitative description of some properties of the process.
The parameters used to describe such characteristics can be, for example, tracer-target binding potentials (BPs), or rate constants related to the transport of tracer between various brain regions or plasma.
Unlike single-photon computed tomography, widespread clinical use of PET is relatively recent. The high cost of radiotracer production, which often requires an on-site cyclotron, hampered the early use of PET in the clinical environment. This situation changed when PET was proven to be cost effective in cancer management, where disease staging with PET was found to contribute to an optimization of therapeutic approaches. Unfortunately, at present, many diseases affecting the brain do not benefit from early diagnosis and cannot be treated effectively; brain PET is thus not routinely used in clinics. This fact has minimized the general need for dedicated brain PET scanners; however, the fact that brain PET is performed mainly in research environments allows for a greater complexity of scanning paradigms and the use of more sophisticated data analyses methods that extract a maximum amount of information from PET data. In this respect, brain PET often leads general PET imaging methodology and significantly contributes to an overall advancement of this imaging field.
Instrumentation
Detectors and scanners
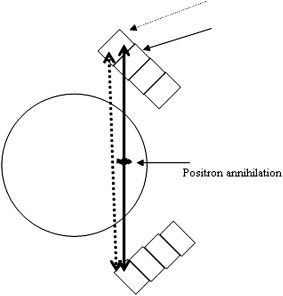
A PET scanner is, in simple terms, a large 511-keV γ-ray detector, because tracer detection occurs by way of virtually simultaneous recording of the two γ rays originating from positron annihilation. Three characteristics are important in PET instrumentation design: high resolution, high detection sensitivity, and the ability to acquire data at high count rates. These properties depend on the detection material, associated electronics, and scanner geometry. In the late 1990s, lutetium oxyorthosilicate (LSO) replaced bismuth germanate (BGO) as the detector of choice because of its higher light output (75% of Thallium doped Sodium Iodide for LSO compared with 15% for BGO), shorter scintillation decay time (40 nsec for LSO compared with 300 nsec for BGO), and similar 511 keV γ-attenuation length (12.3 mm for LSO compared with 11.6 for BGO). The greater light output allows LSO to be cut into small crystals, typically in the order of 2 × 2 × 10 mm 3 . Such small crystals are then assembled into detector blocks and into rings or detector heads. The size of the individual crystals contributes to defining the spatial resolution, and the solid angle subtended by the entire scanner geometry contributes to determining detection sensitivity. In this respect, dedicated brain scanners present an advantage over whole-body scanners; because of the smaller required aperture, the detectors can be closer together, thus increasing detection efficiency. The drawback of a smaller aperture is an increased parallax error ( Fig. 1 ), which introduces a degradation of resolution uniformity as a function of distance from the center of the scanner field of view. Determining the depth of the γ interaction (DOI) in the crystal and restoring the proper identification of the event-associated line of response (LOR, defined as the line connecting any crystal pair that can detect the two γ rays arising from positron annihilation) is a possible approach to minimizing the parallax error. Several schemes for DOI determination have been proposed , of which only one has been implemented in a human-sized brain scanner, the high-resolution research tomograph (HRRT, Siemens, Knoxville, Michigan) . This dedicated brain scanner is currently the most advanced and complex brain scanner available; the description of some of its characteristics is used to provide an overview of some of the recent advances in instrumentation, which, in turn, lead to further algorithm development.
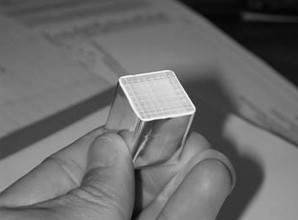
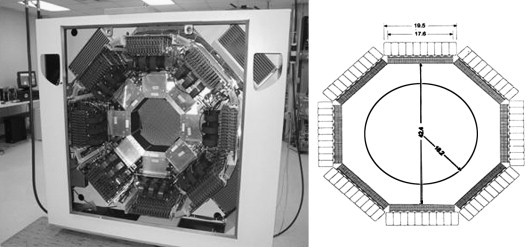
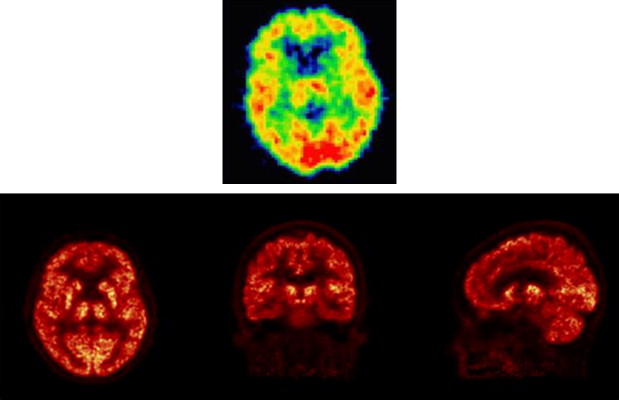
In the current version of the HRRT scanner, the DOI determination is achieved by using a detector with two different crystal layers, LSO and lutetium-yttrium oxyorthosilicate (LYSO) , each 10-mm deep. The scintillation decay time difference between these two crystals (40 nsec for LSO and 53 nsec for LYSO) is used to identify the layer in which the γ-interaction took place by way of energy signal pulse shape discrimination, thus limiting the uncertainty of the γ-interaction location to 10 mm. The individual crystal size is 2.1 × 2.1 × 10 mm 3 ; the scanner contains 119,800 individual crystals ( Figs. 2 and 3 ), covering an axial field of view of 25 cm and a radial field of view of 31 cm, thus providing a detection sensitivity of about 6%. The large number of crystals leads to approximately 4.5 ×10 9 possible LORs, which represents an approximately 20-fold increase over the typical number of LORs possible in the previous generation of brain scanners , with consequent increased demands on data handling and processing. The resolution achieved by this scanner is approximately 2.5 mm in all three directions, compared with 6 mm achievable around 1990 and 12 mm around 1980. The corresponding increase in the amount of observable detail can be appreciated in Fig. 4 .
Algorithms
Image reconstruction
In addition to its hardware complexity, the HRRT scanner presents other challenges. Its geometric configuration includes the presence of gaps between detector heads (see Fig. 3 ), thus causing nonuniform spatial sampling of the radioactivity distribution, which precludes a direct use of analytic image reconstruction algorithms . Iterative statistical reconstruction algorithms that can incorporate a model of the scanner geometry in the reconstruction process and have better noise-handling characteristics are therefore, in principle, better suited for reconstruction of HRRT data; however, with the HRRT, the number of possible LORs is so high that often, only a low number of events (or no events) exist in some LORs. This condition has presented a challenge to the accuracy of statistical reconstruction algorithms . Furthermore, brain studies often require dynamic data acquisition (ie, acquisition of temporally contiguous scanning sequences or time frames), where the duration of individual time frames is variable, largely dictated by tracer kinetics. This requirement, when coupled with tracer decay during the course of the study, leads to a highly variable number of total acquired counts in individual frames and variable data acquisition count rates during the study ( Fig. 5 ). Before the HRRT, the quantitative accuracy of statistical reconstruction algorithms over such a wide range of data acquisition conditions had not been investigated. Dynamic data were most often reconstructed with analytic algorithms, which, being linear, do not suffer from the potential biases introduced by a low number of counts in a data set. HRRT dynamic brain imaging thus stimulated a burst of research activity in the area of statistical reconstruction algorithms, especially with regard to establishing an appropriate correction method for scatter and random events . Random events (simultaneous detection of two γ rays originating from two separate positron annihilations) and scattered events (events where one or both γ rays undergo Compton scattering before being detected) degrade the quantitative accuracy of the images by altering the relationship between source location and event detection. Consequently, these events need to be excluded from the final image. The ordinary Poisson-ordered subsets expectation maximization algorithm , where a scatter and random event estimate is included in the image update factor in the iterative reconstruction process, is currently considered by many to be the method of choice.
In theory, further improvements can be achieved by taking advantage of the ability of the statistical reconstruction algorithms to incorporate modeling of the scanner point spread function into image reconstruction, thus contributing to an even better effective imaging resolution through resolution recovery . Efforts are currently underway to model the HRRT point spread function accurately, by either simulation or measurement; preliminary results look promising .
A relatively new aspect of the HRRT data acquisition is its ability to acquire data in list mode, where events are stored in the order in which they are acquired and are associated with time stamps with millisecond precision, as opposed to being directly histogrammed into sinogram elements indexed by the LOR geometric position in the scanner. This acquisition mode provides the ability to reconstruct data directly, without the need for intermediate histogramming . Because the number of acquired events is often lower than the number of possible LORs with this scanner, list mode reconstruction can be advantageous from the computing and data storage requirements point of view. Although list mode–based image reconstruction techniques have been proposed in the past, they started to undergo significant development and improvement with the appearance of imaging hardware that would particularly benefit from their properties. Additional advantages of the list mode algorithm are the ease of including patient motion correction (see later discussion) and the increased potential for four-dimensional (space and time) reconstruction, an interesting approach to dynamic data reconstruction that is now also gaining renewed interest. In this approach, the time dimension is included in the image estimate through an appropriate set of temporal basis functions ; individual images are then represented by the coefficients of such basis functions. Preliminary results from such approaches show that a significant decrease in noise associated with the temporal distribution of the tracer spatial distribution can be achieved . A practical difficulty with such approaches is the fact that they are still computationally very demanding and, at present, take an excessively long time to complete. However, it is only a matter of time before more powerful computers will alleviate this practical problem.
Patient motion
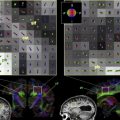
An aspect that has gained increased relevance because of the high resolution of the HRRT scanner is the effect of patient motion on the quantitative accuracy of the images. An example is shown in Fig. 6 , which illustrates a typical amount of head motion incurred during a 1-hour interval by a normal volunteer and a subject suffering from Parkinson’s disease. It can be observed that such motion becomes nonnegligible at 2.5-mm spatial resolution. Several methods have been suggested in the past to compensate at least partially for head motion. Some of them relied on the realignment of image frames using various realignment algorithms such as automated image registration , or were based on mutual information optimization . Although these methods correct for mean displacements occurring between frames, they are not able to correct for motion within each frame, and thus do not eliminate a potential image-blurring effect . To address the motion within each frame, external motion-monitoring systems have been proposed . Among them, the Polaris motion tracking system , based on an infrared emitter/receiver motion detector, seems to be the most commonly used. If motion information detected by the Polaris system is temporally synchronized with data acquisition, and spatially transformed into the scanner coordinate system, the acquired data can be corrected for motion during reconstruction, using algorithms with various degrees of sophistication . Fig. 7 shows the effect of motion and motion correction on simulated data sets. These motion correction methods are expected to be used routinely in high-resolution imaging in the near future.
The HRRT is the first high-resolution human brain PET scanner and, as such, became the catalyst for a large amount of hardware and algorithm development that will benefit future generations of brain and whole-body PET scanners. Research areas such as list mode reconstruction or patient motion correction are indeed not new, but, in light of the relatively limited past performance of the imaging and computing hardware, they were of less immediate practical applicability. They are now gaining new relevance and will certainly influence the performance of future PET imaging techniques.
Algorithms
Image reconstruction
In addition to its hardware complexity, the HRRT scanner presents other challenges. Its geometric configuration includes the presence of gaps between detector heads (see Fig. 3 ), thus causing nonuniform spatial sampling of the radioactivity distribution, which precludes a direct use of analytic image reconstruction algorithms . Iterative statistical reconstruction algorithms that can incorporate a model of the scanner geometry in the reconstruction process and have better noise-handling characteristics are therefore, in principle, better suited for reconstruction of HRRT data; however, with the HRRT, the number of possible LORs is so high that often, only a low number of events (or no events) exist in some LORs. This condition has presented a challenge to the accuracy of statistical reconstruction algorithms . Furthermore, brain studies often require dynamic data acquisition (ie, acquisition of temporally contiguous scanning sequences or time frames), where the duration of individual time frames is variable, largely dictated by tracer kinetics. This requirement, when coupled with tracer decay during the course of the study, leads to a highly variable number of total acquired counts in individual frames and variable data acquisition count rates during the study ( Fig. 5 ). Before the HRRT, the quantitative accuracy of statistical reconstruction algorithms over such a wide range of data acquisition conditions had not been investigated. Dynamic data were most often reconstructed with analytic algorithms, which, being linear, do not suffer from the potential biases introduced by a low number of counts in a data set. HRRT dynamic brain imaging thus stimulated a burst of research activity in the area of statistical reconstruction algorithms, especially with regard to establishing an appropriate correction method for scatter and random events . Random events (simultaneous detection of two γ rays originating from two separate positron annihilations) and scattered events (events where one or both γ rays undergo Compton scattering before being detected) degrade the quantitative accuracy of the images by altering the relationship between source location and event detection. Consequently, these events need to be excluded from the final image. The ordinary Poisson-ordered subsets expectation maximization algorithm , where a scatter and random event estimate is included in the image update factor in the iterative reconstruction process, is currently considered by many to be the method of choice.
In theory, further improvements can be achieved by taking advantage of the ability of the statistical reconstruction algorithms to incorporate modeling of the scanner point spread function into image reconstruction, thus contributing to an even better effective imaging resolution through resolution recovery . Efforts are currently underway to model the HRRT point spread function accurately, by either simulation or measurement; preliminary results look promising .
A relatively new aspect of the HRRT data acquisition is its ability to acquire data in list mode, where events are stored in the order in which they are acquired and are associated with time stamps with millisecond precision, as opposed to being directly histogrammed into sinogram elements indexed by the LOR geometric position in the scanner. This acquisition mode provides the ability to reconstruct data directly, without the need for intermediate histogramming . Because the number of acquired events is often lower than the number of possible LORs with this scanner, list mode reconstruction can be advantageous from the computing and data storage requirements point of view. Although list mode–based image reconstruction techniques have been proposed in the past, they started to undergo significant development and improvement with the appearance of imaging hardware that would particularly benefit from their properties. Additional advantages of the list mode algorithm are the ease of including patient motion correction (see later discussion) and the increased potential for four-dimensional (space and time) reconstruction, an interesting approach to dynamic data reconstruction that is now also gaining renewed interest. In this approach, the time dimension is included in the image estimate through an appropriate set of temporal basis functions ; individual images are then represented by the coefficients of such basis functions. Preliminary results from such approaches show that a significant decrease in noise associated with the temporal distribution of the tracer spatial distribution can be achieved . A practical difficulty with such approaches is the fact that they are still computationally very demanding and, at present, take an excessively long time to complete. However, it is only a matter of time before more powerful computers will alleviate this practical problem.
Patient motion
An aspect that has gained increased relevance because of the high resolution of the HRRT scanner is the effect of patient motion on the quantitative accuracy of the images. An example is shown in Fig. 6 , which illustrates a typical amount of head motion incurred during a 1-hour interval by a normal volunteer and a subject suffering from Parkinson’s disease. It can be observed that such motion becomes nonnegligible at 2.5-mm spatial resolution. Several methods have been suggested in the past to compensate at least partially for head motion. Some of them relied on the realignment of image frames using various realignment algorithms such as automated image registration , or were based on mutual information optimization . Although these methods correct for mean displacements occurring between frames, they are not able to correct for motion within each frame, and thus do not eliminate a potential image-blurring effect . To address the motion within each frame, external motion-monitoring systems have been proposed . Among them, the Polaris motion tracking system , based on an infrared emitter/receiver motion detector, seems to be the most commonly used. If motion information detected by the Polaris system is temporally synchronized with data acquisition, and spatially transformed into the scanner coordinate system, the acquired data can be corrected for motion during reconstruction, using algorithms with various degrees of sophistication . Fig. 7 shows the effect of motion and motion correction on simulated data sets. These motion correction methods are expected to be used routinely in high-resolution imaging in the near future.
Related posts:
 Imaging of the Mind: Yesterday’s Triumphs and Tomorrow’s Challenges
Understanding Autism and Related Disorders: What has Imaging Taught Us?
Neuroimaging in Posttraumatic Stress Disorder and Other Stress-Related Disorders
Mood Disorders
The Role of Imaging in United States Courtrooms
Imaging of the Mind: Yesterday’s Triumphs and Tomorrow’s Challenges
Understanding Autism and Related Disorders: What has Imaging Taught Us?
Neuroimaging in Posttraumatic Stress Disorder and Other Stress-Related Disorders
Mood Disorders
The Role of Imaging in United States Courtrooms
 Visualizing White Matter Pathways in the Living Human Brain: Diffusion Tensor Imaging and Beyond
Stay updated, free articles. Join our Telegram channel

Full access? Get Clinical Tree


