Muscles undergoing denervation demonstrate a variety of imaging appearances in the various stages. It is incumbent on the radiologist to be aware of these changes so as not to interpret these muscles as harboring a tumor or being involved by an inflammatory process. Knowledge of cranial nerve anatomy and the muscles they innervate enables identification of denervation patterns that could implicate more than one nerve and directs the search for the causative lesion.
Muscles undergoing denervation demonstrate a predictable sequence of imaging findings, best appreciated in those muscles innervated by the mandibular and hypoglossal nerves. Denervation changes in smaller muscles are usually only appreciated in the late chronic stage of denervation. It is incumbent on the radiologist to be aware of these changes so as not to interpret these muscles as harboring a tumor or being involved by an inflammatory process. This article reviews the stages of denervation and provides an explanation for the changes identified on MR imaging. The muscles innervated by each motor cranial nerve are reviewed and emphasis is placed on those muscles that can routinely be identified on cross-sectional imaging, physical examination findings that result from insults to each of the motor cranial nerves are presented, and various stages of denervation atrophy for the muscles innervated by each of these nerves are illustrated.
Stages of denervation
Well-known magnetic resonance (MR) signal abnormalities in denervated skeletal muscle are described in the literature for peripheral and cranial nerves. Long-standing chronic denervation atrophy, and its associated extensive fatty infiltration, is usually readily apparent on CT studies, but MR imaging permits identification of changes that occur earlier in the denervation process. Russo and colleagues and others have categorized the MR appearance of denervated muscle roughly, according to the chronicity of the process, into acute, subacute, early chronic, and late chronic patterns. These patterns are most evident when larger muscles are affected. It has also been suggested that different nerves may demonstrate differences in the progression of denervation. Kato and colleagues noted that changes in signal intensity and in contrast enhancement of muscles supplied by the hypoglossal nerve appeared earlier than in muscles supplied by V3 and that the volume of the denervated tongue musculature decreased earlier than the volume of the muscles of mastication. This would further complicate attempts to “stage” denervation.
Russo and colleagues described muscles undergoing acute denervation (patients who have “acute” symptoms) as demonstrating increased muscle volume, pathologic T2 prolongation, and abnormal enhancement, but there was no evidence of fatty replacement. Those muscles thought to be in the subacute stages of denervation also showed pathologic T2 prolongation and abnormal enhancement but did not demonstrate increased muscle volume and did evidence some slight fatty infiltration. Early chronic atrophic changes were those of mild fatty infiltration and no increased T2 signal intensity or pathologic enhancement, with relative preservation of muscle volume, whereas changes of long-standing denervation atrophy involved marked fatty infiltration and loss of muscle volume ( Table 1 ).
| Acute | Subacute | Early Chronic | Late Chronic | |
|---|---|---|---|---|
| Muscle volume | ↑ | − | − | ↓ |
| T2 prolongation | + | + | − | − |
| Fatty infiltration | − | + | + | ++ |
| Abnormal enhancement | + | + | − | − |
The exact duration of denervation needed to produce these various stages is not clear. Some clinical reports define the beginning of denervation as the onset of symptoms, but the reliability of such timing is inherently limited, given the fact that the temporal relation between the onset of symptoms and the denervation process is, most likely, highly variable. The one patient described by Russo and colleagues who demonstrated subacute changes at 8 months underwent a follow-up MR imaging examination that revealed late chronic changes at 20 months. In their study, all patients demonstrating long-standing chronic denervation changes had a known pathologic process of at least 20 months’ duration. Davis and colleagues reported changes of subacute denervation in the muscles of mastication in a patient 6 months after brain stem hemorrhage. In their study of denervated peripheral skeletal muscle, Fleckenstein and colleagues arbitrarily defined acute denervation as less than 1 month’s duration, subacute denervation as between 1 and 12 months, and chronic denervation as greater than 1 year. In their discussion, however, Dill-Macky and colleagues consider the acute phase as “within one month of denervation” and the subacute phase as between 1 and 3 months. It becomes apparent that the literature is inconsistent with regard to the exact timing of the changes associated with denervation atrophy.
Basis for changes on MR imaging
T2 Prolongation
Multiple investigators have reported T2 prolongation during acute and subacute stages of denervation involving the muscles of mastication and muscles of the tongue. It has been suggested that the explanation for T2 prolongation noted in muscles undergoing denervation relates to the size of the extracellular fluid space (extracellular water), which has a much longer T2 prolongation than intracellular water. In their experimental study on rats, Kikuchi and colleagues demonstrated that subsequent normalization of T2 signal intensity correlated with normalization of extracellular volume changes. Polak and colleagues observed skeletal muscle T2 prolongation in an animal model 2 weeks after ligation of the sciatic nerve. Although there was no change in the overall water content, they noted a relative increase in extracellular water with a concomitant decrease in intracellular water. Small differences in water compartmentation may result in substantial signal intensity changes on T2-weighted imaging. Fleckenstein and colleagues suggested that it might be useful to consider the observed T2 prolongation to be “edema-like” rather than a reflection of true edema, given that true edema implies an absolute increase in tissue water content. This would not explain the associated increased muscle volume in reported cases of acute denervation atrophy, however, suggesting that there may well be a component of true edema. May and colleagues prefer to use the term muscle edema to describe the increased muscle signal intensity on T2-weighted images identified in a variety of pathologic conditions, including polymyositis, dermatomyositis, mild injuries, radiation therapy, rhabdomyolysis, and sickle cell crisis in addition to subacute denervation. Wessig and colleagues suggested that increased blood volume is the most important factor altering MR relaxation times. In their study on rats, they found marked capillary enlargement before any other histologic abnormality and noted that changes of the mean capillary area exactly paralleled the increase, maximum, and subsequent decrease in T2 relaxation times. Hayashi and colleagues also concluded that changes in T2 relaxation times were caused by an enlarged blood volume, reporting a linear correlation between T2 relaxation times and increased blood volume measured by 19 F nuclear magnetic resonance (NMR) spectroscopy. More recently, however, Bendszus and colleagues have offered evidence that contradicts the increase in blood flow as an explanation for the T2 prolongation. They demonstrated T2 prolongation in rat muscles as early as 24 hours after sciatic nerve transaction and believe it is the redistribution of fluid from the intracellular to the extracellular space that is responsible for the MR signal changes.
West and colleagues found signal intensity on short-tau-inversion-recovery (STIR) imaging, especially sensitive to T1 and T2 prolongation associated with acute or subacute denervation, to be increased as early as 4 days after the onset of clinical denervation, which is significantly earlier than changes detected on electromyography (EMG). Overall, the STIR sequence is considered to be more sensitive than the spin-echo T2-weighted sequence because of its fat suppression characteristics and ability to enhance differences between water and tissue content. In their article evaluating STIR imaging in 90 patients with clinical evidence of peripheral nerve injury or radiculopathy, McDonald and colleagues reported that STIR imaging had a relative sensitivity of 84% and specificity of 100% for detecting denervation but was less sensitive than needle EMG. They suggested that there may be a shorter time frame of abnormality for STIR MR imaging compared with EMG in detecting denervation or that there is a threshold of muscle edema induced by denervation that is required to increase signal intensity sufficiently so that it can be identified on STIR images.
Contrast Enhancement
Normal skeletal muscle is known to enhance slightly after gadolinium contrast administration. In particular, the extraocular muscles, highly specialized with a unique degree of differentiation, normally demonstrate more prominent enhancement than other skeletal muscles, probably because of the fact that they possess more prominent extravascular and extracellular spaces and richer vascularity. Contrast material is usually present in the extracellular, intravascular, and interstitial spaces. Therefore, a muscle undergoing atrophy, with its expanded extracellular space, would demonstrate greater relative enhancement than normal muscle. Additionally, studies have demonstrated that denervated muscle has relatively increased vascularity per volume of muscle compared with normal muscle. Denervated muscles maintain the total number of capillaries supplying the muscles, but the number of capillaries per unit area increases such that it has been suggested that this luxury perfusion also contributes to contrast enhancement, although the luxury perfusion may be somewhat diminished by capillary necrosis.
Problem and the challenge
It should come as no surprise that, given the MR imaging appearance of muscles undergoing acute or subacute denervation, there have been instances in which these muscles have been erroneously mistaken as harboring a tumor or infection. The authors are personally aware of at least three patients who underwent biopsies of such muscles. (Many more instances have probably occurred but never been reported.) Had the radiologist been aware of the MR imaging appearance of the sequential stages associated with denervation atrophy, these procedures may well not have taken place. It thus becomes important to remember these stages, especially when evaluating imaging abnormalities of the larger muscle bundles, such as those supplied by the mandibular division of the trigeminal nerve (muscles of mastication) and the hypoglossal nerve (tongue musculature), so as not to consider these muscles as being involved by other pathologic conditions.
These various stages of motor denervation have not been described on MR imaging for many of the smaller muscles supplied by motor cranial nerves, most likely because of their small volumes. The primary finding of denervation in smaller muscles on CT and MR imaging is decreased muscle volume, typically without visualization of fatty replacement. Interestingly, however, despite the large size of the muscles innervated by the spinal accessory nerve (trapezius and sternocleidomastoid), the various stages of motor denervation have not been reported in these muscles and researchers have not been able to identify changes of acute or subacute denervation or fatty replacement within these muscles on cross-sectional imaging studies.
When a muscle of the head and neck exhibits changes of denervation, one must first determine if this is an isolated finding or whether all muscles supplied by the same nerve are affected. Obviously, to do this, one must know what muscles are supplied by each of the motor cranial nerves and be able to identify them on cross-sectional imaging. In some instances, patterns of denervation involving muscles supplied by more than one cranial nerve may be identified (especially IX, X, XI, ± XII). The second task involves an assessment of the entire course of the implicated nerve(s), from the brain stem to the abnormal muscle(s), in an attempt to identify the causative lesion. This should be performed with MR imaging, because CT has limited usefulness for assessment of cranial nerves. Imaging of the cranial nerve should be performed in at least two planes, T1- and T2-weighted sequences should be acquired, and fat-suppressed postcontrast T1-weighted images should be obtained.
In the remainder of this article, the muscles innervated by the motor cranial nerves are briefly reviewed and the findings on clinical examination resulting from damage to each of these nerves are presented. For most nerves, emphasis is directed toward single nerve denervation and not extensive pathologic findings involving multiple cranial nerves (ie, cavernous sinus lesions involving cranial nerves III, IV, V, and VI). The anatomy of each motor cranial nerve has been presented elsewhere in this issue and is thus not duplicated here.
Oculomotor nerve—cranial nerve III
After the oculomotor nerve exits the skull, it enters the orbit by way of the superior orbital fissure, passes through the annulus of Zinn, and is classically described as dividing into superior and inferior divisions. The superior division innervates the superior rectus and levator palpebrae superioris muscles, whereas the inferior division innervates the inferior and medial rectus, inferior oblique muscles, and the pupil ( Fig. 1 ). These muscles can be identified on CT and MR imaging, usually individually, although the levator palpebrae superioris and superior rectus muscles are often visualized as a single muscle bundle. It is recognized that some reports exist in the literature that challenge this traditionally held description of oculomotor nerve divisional anatomy. Some investigator have reported patients who have superior division oculomotor nerve palsy caused by disease in the midbrain and subarachnoid space, leading to proposals that functional segregation of oculomotor nerve fibers occurs before the anatomic bifurcation of the oculomotor nerve. Other uncommon causes of superior division oculomotor nerve paresis that have been reported include diabetes, sphenoid sinusitis, and ophthalmoplegic migraines. Cases of oculomotor nerve inferior division and isolated extraocular muscle palsies have also been reported.
A third nerve palsy results in the following ( Fig. 2 ) :
- I.
Exotropia: outward deviation of the eye in primary gaze
- II.
Inability to adduct, depress, and elevate the eye (eye deviates outward and downward), resulting in diplopia
- III.
Ptosis (from paresis of the levator muscle): drooping of the eyelid such that it covers the globe with an inability to raise the eyelid voluntarily
- IV.
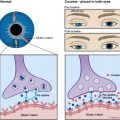
The pupil may be larger and partially reactive or unreactive. Imaging typically demonstrates a diminutive caliber of the affected muscles (late chronic stage) without changes in signal or enhancement, although, on occasion, earlier stages of denervation may be identified. Rare reports of bilateral oculomotor palsies, paresis, or denervation from a variety of causes also exist ( Fig. 3 ).
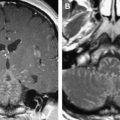
Fig. 3
Bilateral oculomotor nerve denervation atrophy in a 43-year-old man (presumed viral). ( A , B ) T1-weighted coronal MR imaging. Muscles innervated by the third nerve are diminutive bilaterally, and fatty changes are identified in the inferior rectus muscles bilaterally ( arrows ).
Trochlear nerve—cranial nerve IV
After traversing the superior orbital fissure, the trochlear nerve courses to supply a single muscle, the superior oblique muscle ( Fig. 4 ). Dysfunction of the unilateral trochlear nerve and resulting superior oblique palsy result in subtle neurologic deficit compared with other cranial nerves: (1) decrease in torsion and depression, (2) vertical diplopia in downward gaze or in primary position (patients often present with difficulty in descending stairs because of an inability to look down), and (3) head tilt representing compensatory adjustment that can mask the symptoms ( Fig. 5 ). Rare reports of bilateral trochlear nerve dysfunction place the pathologic change at the level of the superior medullary velum. Researchers have only encountered changes of late chronic atrophy (significant atrophy without signal changes), identified as a small superior oblique muscle, which is most easily appreciated on coronal imaging ( Fig. 6 ).
Mandibular nerve motor component—cranial nerve V 3
The mandibular nerve exits the skull by way of the foramen ovale to enter the high masticator space, first giving rise to small nerves that innervate the tensor tympani and tensor veli palatini muscles before dividing into its two major branches: the larger masticator and smaller mylohyoid nerves. The masticator nerve supplies motor innervation to the muscles of mastication (medial and lateral pterygoid, temporalis, and masseter muscles). The mylohyoid nerve provides innervation to the mylohyoid and anterior bellies of the digastric muscles ( Fig. 7 ).