Demyelinating lesions can be pathologically heterogeneous, depending on the degree of inflammation, membrane disruption, and type of cellular damage. Demyelinating lesions are more frequently associated with increased diffusion of water molecules (high apparent diffusion coefficient [ADC]), but may show areas of restricted diffusion (low ADC), depending on the age and size of the lesions.
Diffusion tensor imaging (DTI) in chronic diseases, such as multiple sclerosis and neuromyelitis optica, is more likely to demonstrate occult microscopic damage, which can be detected by increased mean diffusivity (MD) and decreased fractional anisotropy (FA) in the normal-appearing brain tissue.
Central nervous system (CNS) toxic diseases can be caused by a wide variety of chemicals, whether due to medications or environmental exposure. Although some neurotoxins may preferentially affect specific CNS structures, the main magnetic resonance imaging (MRI) findings are often nonspecific, with white matter (WM) areas of hyperintensity on T2-weighted and fluid-attenuated inversion recovery (FLAIR) images, and, less commonly, variable changes in the basal ganglia and cerebellar nuclei. Typically, the MRI changes are symmetric and present with reduced diffusion in the acute phase, a finding often described as acute toxic leukoencephalopathy.
9.1 Diffusion Weighted Imaging and Diffusion Tensor Imaging in Demyelinating Diseases
9.1.1 Introduction
Demyelinating lesions are pathologically heterogeneous, depending on the phase of inflammatory activity, the degree of cellular destruction, or their etiological background.1 The tissue changes associated with demyelination determine variations in water content of the tissue, reflecting variable degrees of cellular swelling and extracellular edema.2
Acute demyelinating lesions may show different levels of cytotoxic or intramyelinic edema. Increases in water concentration in the brain tissues demonstrate nonspecific hyperintensity on T2-weighted images, but the abnormal cellular uptake of water or restricted water between myelin membranes reduces its molecular diffusion, showing high signal intensity on diffusion weighted images (DWIs) with decreased apparent diffusion coefficient (ADC).2
On the other hand, inflammatory and metabolic changes may cause vasogenic and interstitial edema secondary to increased permeability of small vessels and blood–brain barrier (BBB) disruption, which causes increased ADC values. The superposition of events leading to restricted and facilitated water diffusion may produce variable results in DWI and ADC, from water restriction to mixed findings to T2 shine-through effects.2
In chronic phases, demyelinating lesions may show complete resolution, with normalization of T2, DWI, and ADC, but lesions can also present persistent T2 hyperintense foci, representing residual gliosis, and persistent demyelination or axonal loss. In these situations the extracellular space is expanded frequently, resulting in increased ADC values.3,4 Although DWI is sensitive to lesions with long T2 relaxation times, in the late stages of demyelination this technique is not specific enough to classify or to grade the underlying pathological substrate.
Diffusion tensor imaging (DTI) allows further assessment of the microstructure of brain tissues.5 Chronic demyelinating lesions frequently show visible foci of decreased fractional anisotropy (FA) with increased mean diffusivity (MD) (▶ Fig. 9.1). Those DTI parameters do not differentiate demyelination, axon disruption, or gliosis. But recently, the analysis of decomposed eigenvalues of DTI showed stronger correlations between radial diffusivity (λ〦) and demyelination, whereas the axial diffusivity (λ||) seems to be associated with more profound tissue damage or axonal loss.5,6
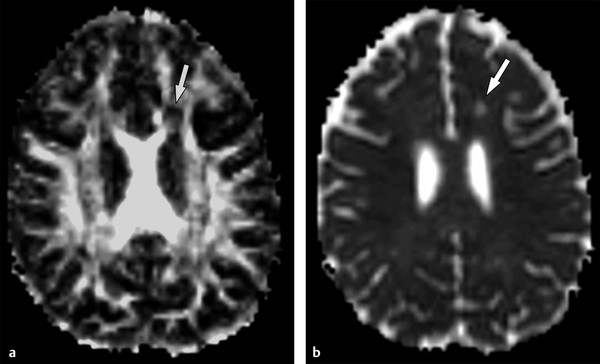
Fig. 9.1 Chronic demyelinating lesion in a patient with multiple sclerosis. (a) The fractional anisotropy (FA) map shows a periventricular focus of decreased FA (arrow), (b) whereas the mean diffusivity image demonstrates high signal (arrow), corresponding to the increased diffusion in a chronic demyelinating lesion.
DTI is also becoming a valuable tool in the differential diagnosis of demyelinating diseases. Chronic demyelinating diseases, such as multiple sclerosis (MS), are known to present extension of microarchitectural damage outside of the macroscopic lesions.3,7 Even though the white and gray matter abnormalities are not visible in DTI maps, several studies have demonstrated abnormal quantitative parameters, such as FA reduction and MD increase in the normal-appearing white matter (NAWM) and gray matter (NAGM) of patients with demyelinating disorders.5,7,8,9
9.1.2 Multiple Sclerosis
MS is the most common chronic demyelinating disease in adults. MS lesions usually appear as hyperintense foci on T2-weighted and fluid-attenuated inversion recovery (FLAIR) images with perivenular distribution, typically affecting the periventricular, juxtacortical, infratentorial, and spinal cord white matter (WM). Acute demyelinating MS lesions present variable DWI and ADC findings, which are time dependent.10 The ADC values increase by the time gadolinium (Gd) enhancement appears, then they progressively decrease as enhancement vanishes and increase again with lesion progression to chronic stages.10
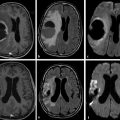
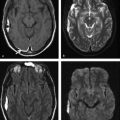
Most lesions, by the time of a clinical relapse evaluation, have some degree of demyelination, inflammatory infiltrate and/or microstructural damage, and variable cytotoxic and intramyelinic edema,5,10 which may show mixed diffusion effects, with areas of restricted and facilitated diffusion (▶ Fig. 9.2) or T2 shine-through effects (▶ Fig. 9.3).
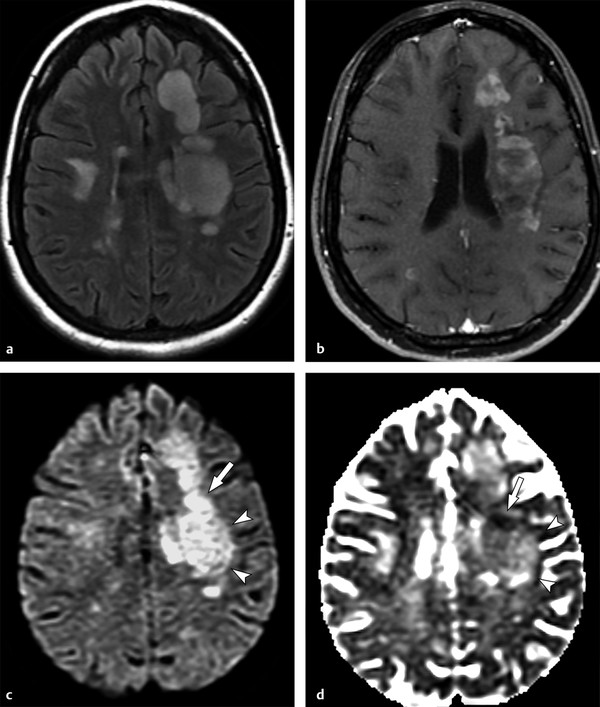
Fig. 9.2 Mixed diffusion effects in a diffuse infiltrating multiple sclerosis lesion. (a) Axial fluid-attenuated inversion recovery shows large, hyperintense, confluent cerebral lesions, especially on the left. (b) Enhanced axial T1-weighted image shows signs of inflammatory activity characterized by multiple foci of enhancement. (c) On diffusion weighted imaging the lesion is hyperintense, but notice a more intense hyperintense portion (arrow), when compared to other areas (arrowheads). (d) The corresponding apparent diffusion coefficient map confirms that they present distinct behavior: whereas the former shows restricted diffusion (hypointense, arrow), the latter are associated with increased diffusion (hyperintense, arrowheads).
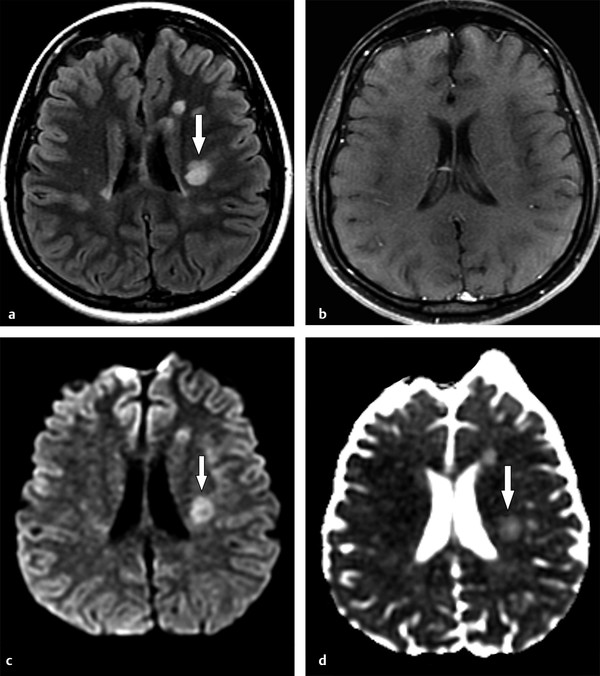
Fig. 9.3 T2 shine-through effect in a chronic multiple sclerosis lesion. (a) Axial fluid-attenuated inversion recovery demonstrates a hyperintense lesion (arrow) with no signs of acute inflammatory exacerbation on (b) corresponding enhanced axial T1-weighted image. The lesion presents hyperintensity on (c) diffusion weighted imaging (DWI) and (d) apparent diffusion coefficient map, corresponding to facilitated diffusion (arrows in (c, d)). Thus the increased signal intensity seen on DWI more likely represents a T2 shine-through effect, and not true restricted water diffusion.
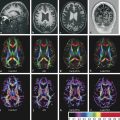
As already mentioned, MS lesions show decreased FA and increased MD, with lower FA in the ring of enhancement.5 In MS, DTI changes can be detected in the NAWM, being more evident in the periplaque regions, corpus callosum (▶ Fig. 9.4), and temporal and parietal lobes,5,6 which can be helpful in distinguishing MS from other demyelinating disorders.
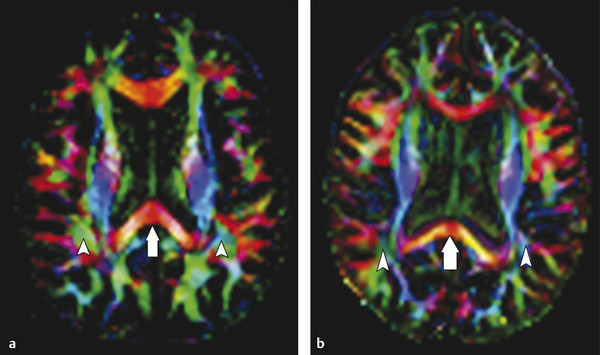
Fig. 9.4 Color fractional anisotropy (FA) maps for a healthy control compared to those for a patient with multiple sclerosis (MS). (a) The color FA map of a healthy subject compared to that of (b) a patient with MS shows a more intense red color in the splenium of the corpus callosum of the subject when compared to the patient (arrows in (a,b)). Areas of decreased color intensity in the MS patient compared to the healthy subject are also observed in the peritrigonal white matter, bilaterally (arrowheads in (a,b)).
9.1.3 Acute Disseminated Encephalomyelitis
Acute disseminated encephalomyelitis (ADEM) is a monophasic demyelinating disease with a wide range of clinical manifestations.3 It is often considered in the differential diagnosis of clinical isolated syndromes (CISs) and other multiphasic demyelinating diseases, such as MS and neuromyelitis optica (NMO).11
ADEM lesions affect deep gray matter structures more frequently than MS, and the white matter lesions can be larger, with indistinct borders and occasional gadolinium enhancement.11,12 DWI findings can vary, more frequently showing increased ADC in the central portions of the lesions. When restricted diffusion is seen, it appears in the borders of larger lesions or in the enhancing margins (▶ Fig. 9.5).12,13
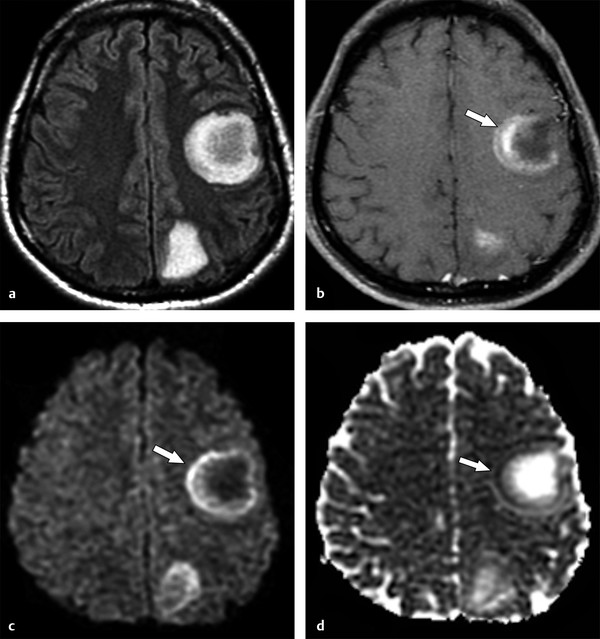
Fig. 9.5 Acute disseminated encephalomyelitis tumefactive lesions. (a) Magnetic resonance imaging shows two tumefactive left cerebral subcortical lesions on fluid-attenuated inversion recovery. (b) One of the lesions demonstrates incomplete ring enhancement in the corresponding enhanced axial T1-weighted image (arrow). The enhancing area presents peripheral restricted diffusion (arrows in (c, d)), (c) observed as increased signal on diffusion weighted imaging and decreased signal on the (d) apparent diffusion coefficient map.
Although ADEM is usually monophasic, some patients may show both clinical and imaging findings of recurrence, with T2-weighted imaging characteristics that can overlap those of with MS and NMO.11 Unlike MS, the abnormalities seen on DWI tend to be restricted to the T2-weighted lesions, and it is unusual to detect increased MD in the NAWM in ADEM outside of the acute phase.13
In ADEM the deep gray matter structures show more significant abnormalities on DTI than in MS, even without evidence of T2-weighted detectable lesions, and they present as increased MD in the thalami and basal ganglia.11 These findings suggest that, not only can the qualitative changes in DTI parameters be helpful but also the pattern of abnormalities can play a role in the differential diagnosis.
9.1.4 Neuromyelitis Optica
NMO is a demyelinating disease characterized by severe, recurrent attacks of optic neuritis and extensive myelitis.14 The classical presentation of NMO is associated with an autoantibody targeted to the water channel protein aquaporin 4 (NMO–immunoglobulin G [IgG]), which is not only present in the optic nerve and spinal cord but is also commonly found around the ventricles, the hypothalamus, and the subcortical white matter.15
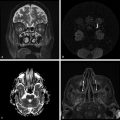
NMO does not spare the brain, and NMO-related hyperintense lesions on T2-weighted images tend to be larger than MS lesions and follow the typical distribution of aquaporin 4 channel sites (▶ Fig. 9.6), but may show overlapping characteristics with MS and ADEM, especially in the initial stages.8
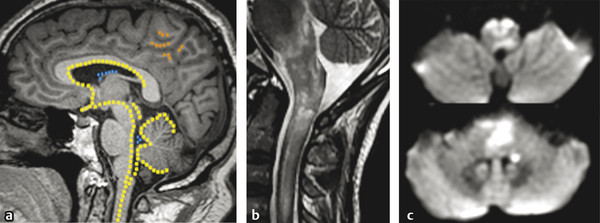
Fig. 9.6 Neuromyelitis optica (NMO) lesions and the aquaporin-4 (AQP-4) channel distribution in the central nervous system. Overlaid to a (a) sagittal T1-weighted image there is a schematic view of the main distribution of AQP-4 channel protein sites in the central nervous system. There is a high concentration of AQP-4 channel protein in the central spinal cord, hypothalamus, subependymal white matter, supraoptic nuclei, optic nerve/chiasm, cerebellar cortex (yellow spots), ependymal cells (blue spots) and also in the subcortical white matter (orange spots). (b) Acute NMO lesions commonly present as longitudinally extensive or transverse myelitis on sagittal T2-weighted image, commonly affecting the medulla and spinal cord junction. (c) Acute lesions may show restricted diffusion, with hyperintensity on diffusion weighted imaging (axial views at the levels of medulla and pons).
There are abnormalities in the NAWM in NMO, seen as reduced FA in the pyramidal tracts and optic radiations, presumably associated with wallerian degeneration secondary to optic nerve and spinal cord lesions.8,15 Recently, a tract-based spatial statistics study showed FA reduction in the genu and body of the corpus callosum, external capsules, uncinate fasciculus, inferior longitudinal fasciculus, and inferior fronto-occipital fasciculus, mostly related to λ〦 (radial diffusion) changes, probably reflecting extensive demyelination.15
Furthermore, DTI changes in the corpus callosum in NMO were described as milder and predominantly in its anterior half, whereas in MS DTI changes are more extensive and have a posterior predominance.6,8
9.1.5 Tumefactive Demyelinating Lesion
Tumefactive demyelinating lesions (TDLs) are defined as lesions > 2 cm in diameter. They can be the first presentation of MS, NMO, ADEM, or idiopathic demyelinating events. On MRI, a TDL is a large white matter lesion with variable mass effect, absence of cortical involvement, a complete or open ring of contrast enhancement, vessel-like structures running through its center, a T2-hypointense ring, and peripheral restricted diffusion on DWI (▶ Fig. 9.7).16 Conventional MRI findings overlap between the different demyelinating syndromes and TDL and can mimic high-grade gliomas or other neoplastic lesions.16,17
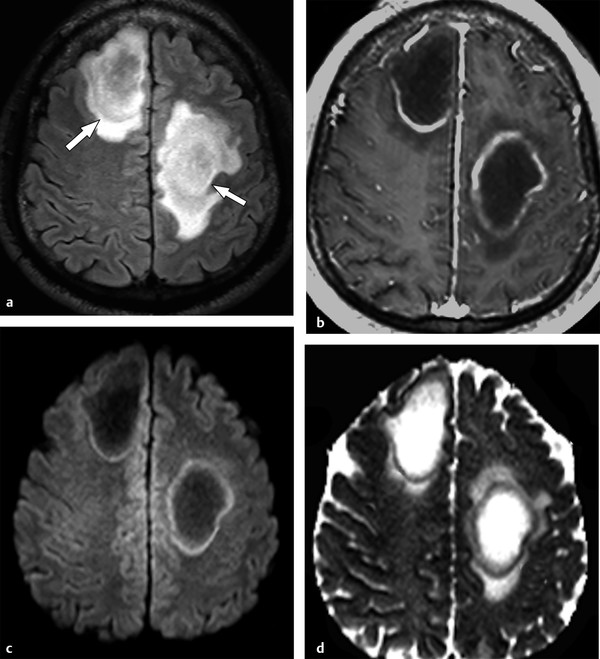
Fig. 9.7 Tumefactive demyelinating lesions (TDLs). TDLs are demyelinating lesions > 2 cm in diameter, frequently showing mass effect and surrounding edema. (a) Axial fluid-attenuated inversion recovery image show two examples (arrows). (b) Axial enhanced T1-weighted image shows the enhancing edges that represent areas of increased inflammatory activity. (c) The lesion periphery frequently shows restricted water diffusion, with hyperintensity on diffusion weighted imaging (d) and hypointensity on the apparent diffusion coefficient map.
DTI yields additional information to distinguish TDL from high-grade gliomas.17 High-grade gliomas frequently demonstrate a rim of increased FA in the perilesional edema, which is not usually described in TDLs.17
9.1.6 Baló Concentric Sclerosis
Baló concentric sclerosis is a rare variant of acute demyelinating diseases, characterized by alternating rings of demyelination and preserved myelin or remyelination.1 Pathological studies describe edges of active demyelination surrounding demyelinated areas where exacerbated inflammatory activity is present. Interestingly, the active demyelination edges sometimes follow the pattern of hypoxic lesions.1 In the acute phase, MRI shows concentric bands of demyelination, hyperintense on T2-weighted images and hypointense on T1-weighted images, alternating with rings isointense to white matter thought to be preserved myelin or remyelination. Concentric ring gadolinium enhancement is seen in the bands of active demyelination and progressively disappears in the late acute and chronic stages of the disease. Restricted diffusion is frequently present in the enhancing rings, whereas the nonenhancing bands usually show high ADC values (▶ Fig. 9.8).1
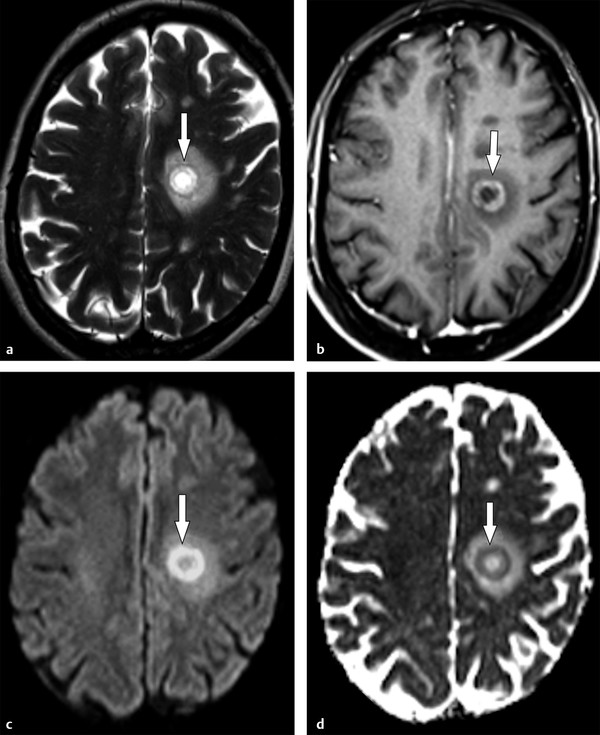
Fig. 9.8 Baló concentric sclerosis. (a) Axial T2-weighted image depicts the layered appearance of a Baló demyelinating lesion (arrow). (b) Rings of active demyelination usually enhance after gadolinium administration (arrow) with surrounding edges of restricted diffusion characterized by hyperintensity on (c) diffusion weighted imaging (arrow) and (d) hypointensity on the apparent diffusion coefficient map (arrow).
9.1.7 Osmotic Myelinolysis
Osmotic demyelination typically occurs after rapid correction of hyponatremia.18 It refers, more frequently, to central pontine myelinolysis, with acute demyelination of white matter tracts in the pons, sparing peripheral fibers (ventrolateral longitudinal fibers), and the periventricular white matter. Similar lesions can occur outside the pons, affecting the basal ganglia, midbrain, and subcortical white matter, characteristic of the so-called extrapontine myelinolysis.19
Osmotic myelinolysis is usually preceded by an initial phase of unspecific encephalopathy attributed to the electrolyte disturbance. Following rapid reversal of this disturbance, a transient improvement is observed, and 2 or 3 days later, the patient progresses to spastic quadriplegia, pseudobulbar palsy, and variable levels of consciousness.18
In the hyperacute onset of osmotic demyelination, restricted diffusion is seen in the lesions. Later, there is increasing T2-hyperintensity and T1-hypointensity, symmetrically distributed in the central pons, frequently showing a classic trident appearance (▶ Fig. 9.9) with progressive increases in ADC levels. T1 and T2 changes may take up to 2 weeks to appear after the hyperacute phase when increased diffusion is more often observed.19
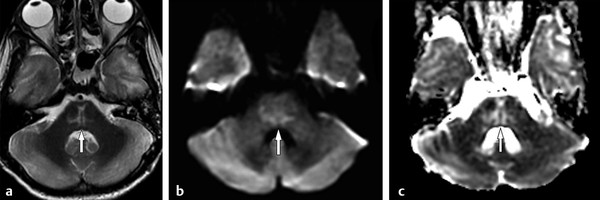
Fig. 9.9 Osmotic myelinolysis. (a) Axial T2-weighted image shows a pontine lesion with the typical trident appearance (arrow). T2 and T1 signal changes frequently appear after a few days or weeks, when increased diffusion is usually seen, showing hyperintensity on (b) diffusion weighted imaging (arrow) and hyperintensity on (c) the apparent diffusion coefficient map (arrow).
9.2 Diffusion Weighted Imaging and Diffusion Tensor Imaging in Toxic Diseases
9.2.1 Introduction
Toxic diseases can be secondary to exposure to a wide variety of exogenous agents, including cranial irradiation, chemotherapy, antiepileptic agents, drugs of recreational use, and environmental toxins. Although the CNS is naturally protected by the BBB from chemically induced neurotoxicity, a great number of neurotoxins are known to interfere or damage it, allowing them to penetrate neural tissues and exposing the brain to them. Substances that are characteristically lipid soluble have a facilitated penetration and distribution in the CNS, where they can promote direct neuroglial excitotoxic injury or metabolic disturbances.20,21
Toxic leukoencephalopathy (TL) may be acute, and the so-called acute toxic leukoencephalopathy (ATL) may have a dramatic clinical onset. This entity must be placed in perspective with the more common and ubiquitous chronic TL that is present in many patients undergoing chemotherapy or radiation.21 Clinical presentations are somewhat nonspecific in both, generally characterized by a recent onset of neurological decline, cognitive changes, headache, and other focal neurological signs.20,22
The damage generally involves the WM tracts and other high metabolic areas, which are particularly susceptible to neurotoxic damage, including the deep gray matter, brainstem, and cerebellar nuclei.22 Therefore, TL may solely involve the WM, but also may affect the basal ganglia, brainstem, and cerebellum.21
Typically, the MRI appearance of ATL is that of symmetric hyperintense WM lesions on T2-weighted and FLAIR images. Restricted diffusion can be seen in areas of acute demyelination and cytotoxic edema. Usually, with drug discontinuation, supportive therapy, or specific treatments, most of these imaging findings are reversible. Therefore, the clinical features and neurological outcome are neither necessarily correlated to the degree of early T2, FLAIR, or DWI abnormalities, nor to their resolution in subsequent imaging studies.22
9.2.2 Antineoplastic Treatment
Radiation Therapy
There is a wide range of radiation therapy adverse effects, from minor acute symptoms (headache, fatigue) to life-threatening subacute and late neurological complications (radionecrosis, progressive leukoencephalopathy, radiation-induced tumors).21 The emphasis here is on subacute leukoencephalopathy.
Although it is not entirely clear which individual characteristics are linked to the development of radiation-induced toxicity, some recognized risk factors are increasing age, diabetes mellitus, systemic hypertension, combined chemotherapy regimens, and the presence of underlying leukoaraiosis.23
Regarding subacute leukoencephalopathy, most patients are asymptomatic. Mild or moderate cognitive impairment is more common than severe dementia. Although clinical symptoms stabilize or evolve slowly in most patients, some individuals may develop progressive dementia and eventually die.23 Imaging findings usually reflect diffuse WM injury. On MRI, periventricular WM lesions are depicted as areas of hyperintensity on FLAIR and T2-weighted images (▶ Fig. 9.10), ADC is usually normal or slightly increased. Brain atrophy may also coexist. No effective treatment is known to revert the clinical and imaging features of radiation-leukoencephalopathy.23,24
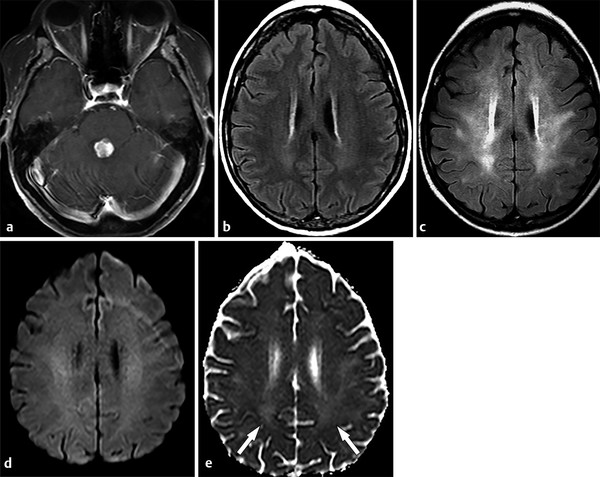
Fig. 9.10 Radiation leukoencephalopathy. A 53-year-old woman presented with metastatic disease secondary to lung cancer. (a) An axial enhanced T1-weighted image demonstrated one secondary lesion in the dorsal pons. (b) At the same time point, an axial fluid-attenuated inversion recovery (FLAIR) image at the plane of the corona radiata was unremarkable. (c) After 4 months, as the patient was treated using total brain radiation, a diffuse, bilateral and symmetric leukoencephalopathy appeared in the follow-up FLAIR image, without significant changes on the (d) corresponding diffusion weighted image. (e) In the apparent diffusion coefficient map, white matter hyperintensity can be seen (arrows).
Stay updated, free articles. Join our Telegram channel

Full access? Get Clinical Tree


