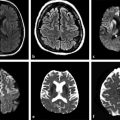
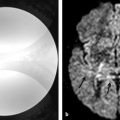
Cytotoxic edema is seen within minutes to hours on diffusion weighted images (DWI) with sensitivity and specificity of 88 to 100% and 86 to 100%, respectively.
Cortical watershed infarcts are thought to be the result of microembolization, either from carotid artery atherosclerosis vulnerable plaque or from artery-to-artery emboli precipitated by an episode of systemic arterial hypotension. Internal watershed infarcts are caused by a combination of hypoperfusion of the internal border zone, severe carotid disease, and a hemodynamic event.
The sensitivity and specificity of DWI for the diagnosis of acute lacunar infarction are 94.9% and 94.1%, respectively.
It is important to diagnose transient ischemic attack (TIA) because the short-term risk of stroke following TIA is greatest within the first 48 hours (5.3%).
Cytotoxic edema in cerebral venous thrombosis (CVT) is thought to be due to reduced cerebral blood flow (CBF) below the penumbra level, which in turn leads to failure of the sodium-potassium-adenosine triphosphate–dependent pump.
6.1 Introduction
Diffusion weighted imaging (DWI) is an advanced imaging technique that allows noninvasive evaluation of water diffusibility in the brain tissue. It is sensitive to the random translational motion of water molecules due to brownian motion. This property of DWI has revolutionized the imaging of vascular pathologies, stroke in particular.
Diffusion weighted images (DWIs) are generated by adding an opposing pair (first tagging and then second untagging) of diffusion gradients to spin-echo or echo planar sequences. For stationary molecules (e.g., stroke), the effects of the tagging and the untagging gradient pulses cancel each other out. This “restricted diffusion” appears hyperintense to normal tissue on DWI. In normal brain tissue, where the molecules are mobile, there is incomplete rephrasing resulting in a net phase shift, which leads to a signal loss. The degree of signal loss is proportional to the exponent of the diffusion coefficient and to the duration, distance, and strength of the applied diffusion gradients (the so-called b value). The diffusion coefficient measured by DWI is referred to as the apparent diffusion coefficient (ADC) rather than the true diffusion coefficient.
With the advent of intravenous and intra-arterial thrombolytic therapy, the definition of hyperacute stroke has gained significant popularity. As per various trials across the globe, a therapeutic window (4–6 h) has been identified for the treatment of stroke, emphasizing the importance of early diagnosis. The concept of “time is brain” forced us to look at the avenues that can diagnose the early changes in the brain following stroke. DWI has revolutionized the imaging of stroke by identifying cytotoxic edema within minutes of the onset of a stroke. As such, DWI has become the driving force for the diagnosis of the vascular pathologies. Besides diagnosing large territorial strokes, DWI allows for the differentiation of acute stroke from chronic stroke and from nonspecific white matter lesions. DWI also facilitates the detection of very small ischemic lesions, small lacunar infarcts, punctate cortical infarcts, and even small lesions in patients with transient ischemic attacks (TIAs), which are difficult to diagnose on computed tomographic (CT) scans and the T2 and fluid-attenuated inversion recovery (FLAIR) sequences of magnetic resonance imaging (MRI). Multiplicity distribution and other ancillary findings on MRI might help in identifying the underlying etiology of the stroke. This chapter discusses the application of DWI in the diagnosis of various vascular pathologies and their mimics.
6.2 Acute Stroke and Diffusion Weighted Imaging
6.2.1 Introduction
Diagnosing hyperacute stroke or differentiating stroke from its mimics is of vital importance for the appropriate therapy. Two main imaging techniques employed in evaluation of hyperacute stroke include CT-CT perfusion and MR-MR perfusion. Both techniques have their own advantages and disadvantages. CT perfusion is faster and quantitative but has limitations in the diagnosis of small stroke or lacunar infarctions. A limited MR stroke protocol with DWI and FLAIR sequences can diagnose territorial and lacunar infarcts and their mimics and thus provide the vital information needed for the clinicians.
Pathophysiology of Stroke
Brain damage after infarction is caused by a plethora of complex mechanisms that lead to the accumulation of toxic metabolites causing cellular and architectural damage of brain parenchyma. Within minutes of vascular occlusion, an ischemic cascade begins that includes energy and sodium-potassium pump failure, an increase in intracellular calcium, depolarization, spreading depression, generation of free radicals, disruption of the blood–brain barrier (BBB), inflammation, and apoptosis.1 These events may not occur strictly in order and can show overlap.
Pump Failures and Metabolic Changes
Cerebral blood flow (CBF) of < 10 mL/100 g of brain tissue causes severe depletion of oxygen and glucose, leading to a severe decrease in adenosine triphosphate (ATP) at the cellular level. This decrease in ATP leads to the failure of the sodium-potassium pump. This failure causes passive diffusion of Na+ ions inside the cells along with large amounts of fluid. This causes a decrease in the extracellular fluid volume and a decrease in the brownian motion, which is the underlying principle behind DWI imaging in stroke2,3 (▶ Fig. 6.1).
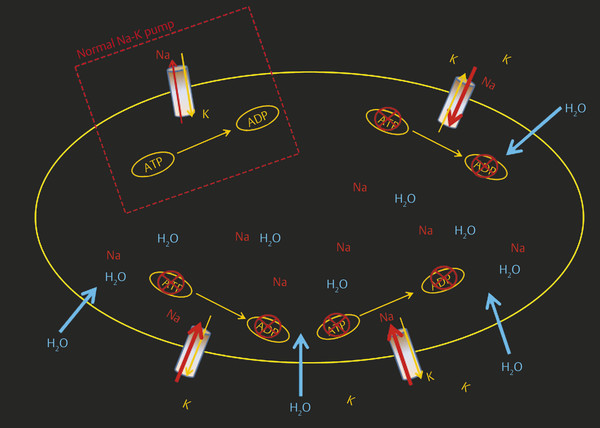
Fig. 6.1 Schematic illustration of sodium-potassium (Na-K) pump failure. The white dotted box shows normal Na-K pump function across the cell membrane. Decrease in adenosine triphosphate (ATP) at the cellular level causes failure of the sodium-potassium-ATP pump, which causes passive diffusion of Na and H2O inside the cell, leading to intracellular (cytotoxic) edema. A higher level of extracellular K causes depolarization. ADP adenosine diphosphate.
Depolarization of the cells leads to a large release of excitotoxic amino acids, especially glutamate, into the extracellular compartment. In addition to having primary neurotoxicity, glutamate also causes activation of glutamate receptors, such as N-methyl-d–aspartate (NMDA), α-amino-3-hydroxy-5-methyl-4-isoxazole propionate acid receptor (AMPA), metabotropic glutamate, receptor-operated channels, voltage-gated calcium channels, and store-operated channels, leading to a large influx of Ca2+ into the cells2,3 (▶ Fig. 6.2). A high concentration of intracellular Ca2+ is toxic and leads to irreversible mitochondrial damage, inflammation, necrosis, and apoptosis. Oxygen radicals (superoxide [O2–], hydrogen peroxide [H2O2], and hydroxyl radicals [−OH]) produced during the process lead to lipid peroxidation membrane damage, dysregulation of cellular processes, promotion of tissue injury, and disruption of the cellular powerhouse (mitochondrial membranes), leading to mitochondrial burst and cell death.4,5 The combination of hypoxic damage to the vascular endothelium, toxic damage of inflammatory molecules and free radicals, and destruction of the basal lamina by mitochondrial membrane permeabilization (MMP) damages the BBB. Proteolysis of the neurovascular matrix leading to disruption of the BBB is mainly seen after reperfusion. This destruction of the BBB leads to vasogenic edema, inflammation, and hemorrhagic transformation.4,6
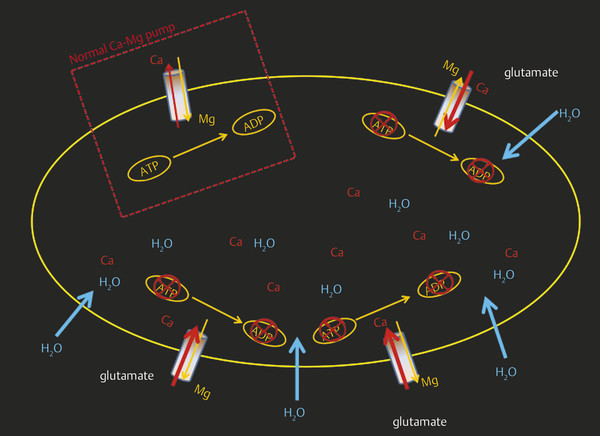
Fig. 6.2 Schematic illustration of calcium pump failure. The white dotted box shows normal calcium–magnesium (Ca-Mg) pump function across the cell membrane. Depolarization of the cell after infarction leads to a release of glutamate, which, in turn, leads to the opening of Ca channels and thus a large influx of Ca inside the cell. Higher levels of intracellular Ca cause mitochondrial damage and cellular rupture. ATP, adenosine triphosphate; ADP, adenosine diphosphate.
Cell Death
Three fundamental mechanisms6 leading to cell death during ischemic brain injury include excitotoxicity and ionic imbalance, oxidative and nitrosative stresses, and apoptotic-like cell death. These mechanisms have some overlap. Excitotoxicity and ionic imbalance and oxidative and nitrosative stresses lead to the loss of membrane integrity; organelle failure; and, eventually, coagulation necrosis, the most prominent mechanism of cell death in the central core.6,7 Selective cell death is a well-identified phenomenon after cerebral infarction. Neurons and oligodendrocytes are more vulnerable to cell death than astroglial or endothelial cells.4,6 Capillary endothelium is quite resistant compared with other central nervous system (CNS) cells, and damage to capillary endothelium begins 4 to 6 hours after infarction. Disruption of the capillary endothelium leads to a break in the BBB.
6.2.2 Large Vessel Acute Stroke and Diffusion Weighted Imaging Evolutionary Changes
Hyperacute Stage: Less Than 12 Hours
With the advent of intravenous and intra-arterial thrombolytic therapy for stroke, the definition of hyperacute stroke has gained significant importance. As described under pathogenesis, multiple events take place within the infarcted and surrounding parenchyma at the cellular level. Imaging findings in this stage are mainly due to diagnoses of cytotoxic edema by DWI–ADC and of thrombus within the vessels. DWI has revolutionized the imaging of stroke by identifying cytotoxic edema within minutes of stroke.8,9 Normally there is free motion of molecules within the extracellular space (brownian motion)8,9 (▶ Fig. 6.3a). A decrease in ATP, failure of the sodium-potassium-ATPase, and anoxic depolarization lead to an intracellular shift of fluid, causing cell swelling (cytotoxic edema) and contraction of the extracellular space (▶ Fig. 6.3b). These changes cause a decrease in brownian motion, which is seen on the DWI sequence as restricted diffusion. Cytotoxic edema is seen within minutes to hours on DWI with sensitivity and specificity of 88 to 100% and 86 to 100%, respectively.9,10 The regional decrease of diffusion is visible as hyperintensity on DWI images and as hypointensity on quantitative maps of the ADC (▶ Fig. 6.3c).
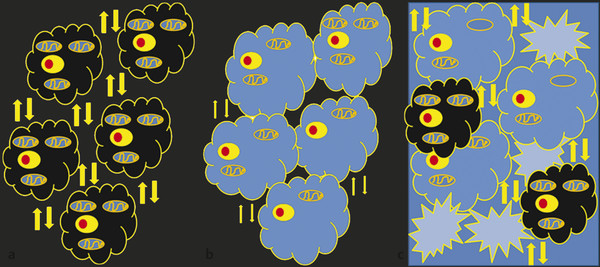
Fig. 6.3 Schematic illustrations of diffusion weighted imaging (DWI) and apparent diffusion coefficient (ADC) basics. (a) Arrows show normal brownian motion in extracellular space with normal-sized cells. (b) Failure of sodium-potassium-adenosine triphosphate (ATP) pump leads to intracellular edema, swelling of cells (cytotoxic edema), decreased extracellular fluid, and hence a decrease in brownian motion. (c) A large influx of Ca2+ inside the cells leads to mitochondrial damage and cellular wall disruption, which, in turn, leads to cell rupture and increase in extracellular fluid (vasogenic edema).
The term operationally defined penumbra is used to describe the volume of tissue contained within the region of cerebral blood flow-cerebral blood volume (CBF-CBV) mismatch on perfusion CT maps and of CBF–DWI mismatch on perfusion MRI maps. The region of CT–CBV or MR–DWI abnormality represents the core of infarcted tissue, and the CBF–CBV mismatch on CT and CBF–DWI mismatch on MRI represents the surrounding region of tissue that is hypoperfused but salvageable (penumbra) (▶ Fig. 6.4).
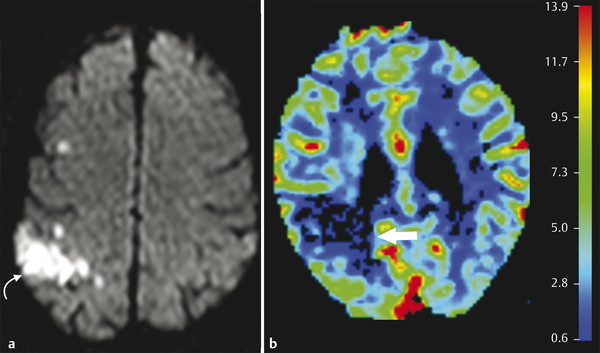
Fig. 6.4 Diffusion perfusion mismatch in a hyperacute stroke in a 56-year-old man. Axial diffusion weighted image (a) shows an area of restricted diffusion in the left frontal lobe (curved arrow). Cerebral blood flow (CBF) image (b) from perfusion magnetic resonance imaging shows an area of decreased perfusion in the corresponding region (arrow), which is smaller than the diffusion defect, suggestive of penumbra. Penumbra = diffusion weighted imaging defect – CBF. There is viable tissue, and the patient will benefit from thrombolytic therapy.
Acute Stage: 12 to 24 Hours
During the acute stage, there are further increases in cytotoxic edema and intracellular Ca2+. Activation of a wide range of enzyme systems (proteases, lipases, and nucleases) and production of oxygen-free radicals leads to damage of cell membranes, DNA, and structural neuronal proteins, ultimately leading to cell death. Increased tissue water results in prolongation of T1 and T2 relaxation times on MRI. During this stage there is a combination of cytotoxic and vasogenic edema, with dominance of cytotoxic edema. T2 changes due to vasogenic edema are seen around 6 to 8 hours and are more sensitive than those on T1.
Subacute Stage: 2 Days to 2 Weeks
Because of a breakdown in the BBB and rupture of swollen cells, there is an increase in extracellular fluid (i.e., vasogenic edema) (▶ Fig. 6.5). This takes about 18 to 24 hours to develop and reaches a maximum by 48 to 72 hours. In this phase, imaging shows increased edema, mass effect, and possible herniation, depending on the size and location of the infarct. Gyral and parenchymal enhancement may be seen on contrast-enhanced T1-weighted imaging and is maximal at the end of the first week. Note that signal intensity in the infarcted area remains increased on DWI for almost 1 week and decreases thereafter, whereas reduced ADC values peak around 3 to 5 days, increase thereafter, and return to normal by 1 to 4 weeks.8,9
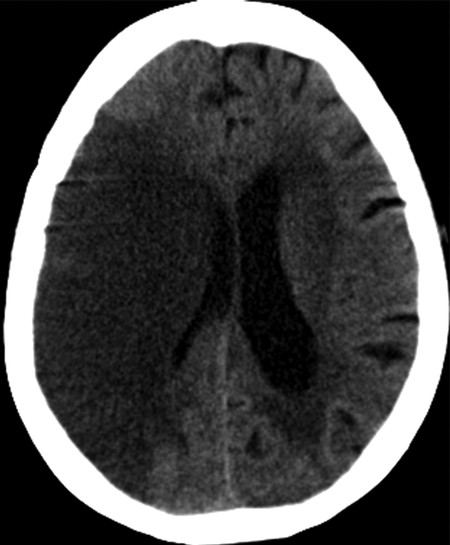
Fig. 6.5 Vasogenic edema in subacute infarction in a 71-year-old woman. An unenhanced computed tomographic scan of the brain shows a large hypodensity in the right middle cerebral artery (MCA) territory with loss of gray matter–white matter differentiation and effacement of convexity sulci with mass effect on surrounding brain parenchyma and the ipsilateral lateral ventricle.
Chronic Stage: 2 Weeks to 2 Months
The chronic stage begins with restoration of the BBB, resolution of vasogenic edema, and the clearing up of necrotic tissue. Pathologically and on imaging, this phase is characterized by local brain atrophy, gliosis, cavity formation, and ex vacuo dilatation of the adjacent ventricle.9 DWI can show changes of encephalomalacia with hypointensity in the infarcted area. ADC shows increased signal intensity and prominence of convexity sulci due to loss of parenchyma. Calcification and deposition of blood products (hemosiderin) may be seen on T2 and gradient-recalled echo (GRE) sequences.
6.2.3 Time Course of Diffusion Changes in Acute Stroke
Decreased diffusion in ischemic brain tissue is observed as early as 30 minutes after vascular occlusion10 (▶ Fig. 6.6 and ▶ Fig. 6.7). This decrease in diffusion is markedly hyperintense on DWI and hypointense on ADC images. The ADC continues to decrease with peak signal reduction at 1 to 4 days (▶ Fig. 6.8a,b). The ADC returns to baseline at 1 to 2 weeks. As the vasogenic edema peaks up, the infarcted area remains mildly hyperintense on the DWI images, due to the T2 component, and isointense on the ADC images (▶ Fig. 6.8c,d and ▶ Fig. 6.9). The ADC is elevated secondary to increased extracellular water, tissue cavitation, and gliosis.
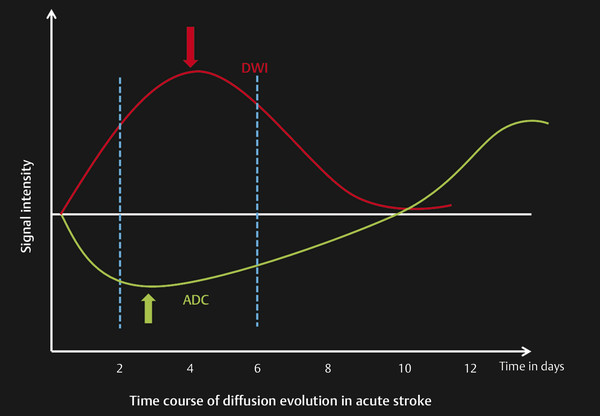
Fig. 6.6 Time course of diffusion evolution in acute stroke. The graph shows signal intensity changes in the diffusion and apparent diffusion coefficient (ADC) in respect to time in an infarcted area. Changes in diffusion weighted imaging (DWI) and ADC appear within 30 minutes of infarction. Decreased ADC values peak up between 2 and 4 days, become isointense between 9 and 11 days, and then become hyperintense by 12 to 14 days. Hyperintensity in the DWI is seen at maximum between 2 and 6 days. This hyperintensity remains for 8 to 10 days and then becomes iso- to hypointense by 12 to 14 days.
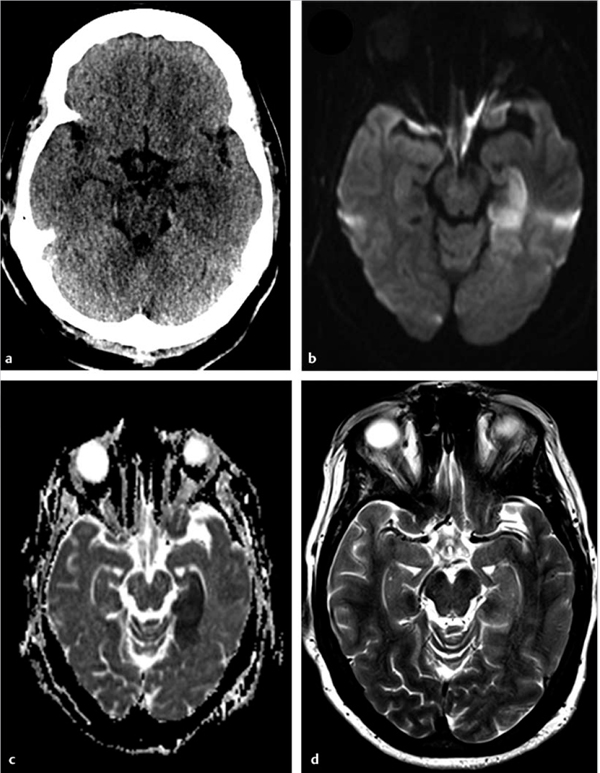
Fig. 6.7 A 47-year-old man with acute neurological deficit. (a) Unenhanced computed tomography performed within 4 hours of onset of symptoms does not show any abnormality. Magnetic resonance imaging performed within 5 hours of deficit shows an area of restricted diffusion in the left hippocampus on (b) axial diffusion weighted imaging and (c) apparent diffusion coefficient map. There was no corresponding abnormality seen on (d) axial T2-weighted image.
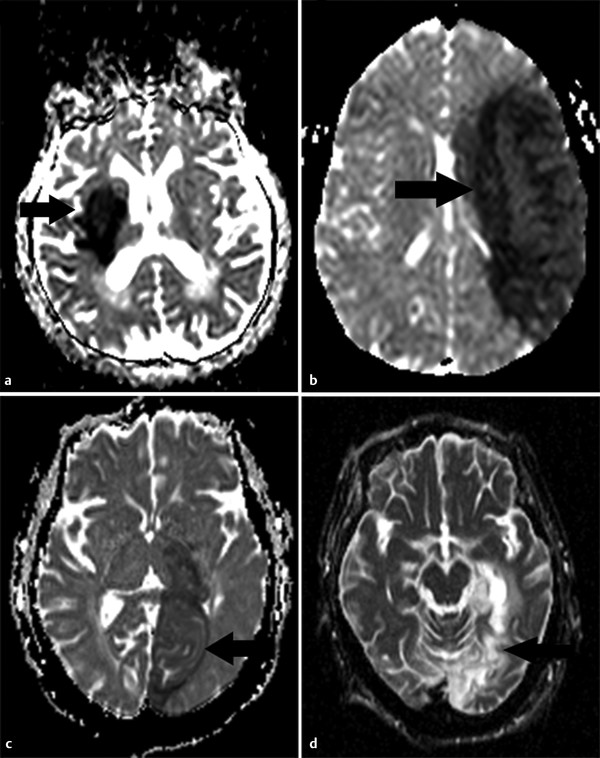
Fig. 6.8 Apparent diffusion coefficient (ADC) time course of stroke evolution in four different patients as seen in ADC maps. (a) At 24 hours, hypointensity (arrow) in the right deep gray matter nuclei due to hyperacute stroke. (b) At 3 days, pronounced ADC hypointensity (arrow) secondary to increased cytotoxic edema. (c) In a 10-day-old left Posterior Cerebral Artery (PCA) infarction (arrow), ADC is almost isointense secondary to a decrease in the cytotoxic edema, cell lysis, and development of vasogenic edema. (d) At 12 months, ADC shows hyperintensity in the left stroke (arrow) secondary to the development of gliosis and tissue cavitation.
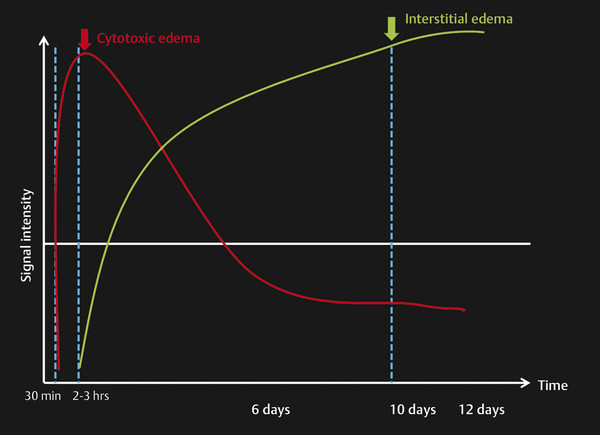
Fig. 6.9 Time course of types of edema in acute stroke. The graph shows the appearance of the cytotoxic edema in a hyperacute stroke within 30 minutes, which peaks within 2 to 3 hours. Vasogenic edema (interstitial) may appear by 2 to 3 hours but peaks at 6 to 10 days.
The time course is influenced by a number of factors, including size of the infarct, infarct type, therapy administered, and patient age. Minimum ADC is reached more slowly and the transition from decreasing to increasing ADC is later in lacunar infarctions as compared to large strokes. Early reperfusion causes pseudonormalization as early as 1 to 2 days in humans who receive intravenous recombinant tissue plasminogen activator (rtPA) within 3 hours after stroke onset.
6.2.4 Hemorrhagic Transformation Prediction and Diffusion Weighted Imaging
Hemorrhagic transformation (HT) refers to hemorrhage in an infarcted area. The incidence of HT varies greatly between 10 and 43% (mean 18%)11 and is highest during the subacute stage. The severity of hemorrhage may range from a few petechiae to a large hematoma with mass effect. Predisposing factors include stroke etiology (HT is more frequent with embolic strokes), reperfusion, good collateral circulation, hypertension, anticoagulant therapy, and thrombolytic therapy. HT is thought to be due to a combination of vascular injury, reperfusion, and altered permeability. There is alteration in the integrins and disruption of basal lamina, collagen IV, and laminin by free radicals and matrix metalloproteinases (MMPs).6,12,13 Exposure of this disrupted endothelium to the normal vascular pressure after clot lysis leads to reperfusion injury and extravasation of blood. HT is two to three times more likely in patients treated with thrombolysis. Although CT is commonly used for follow-up of stroke, MRI, especially susceptibility-weighted images (SWI) and GRE imaging, is very sensitive in the diagnosis of early HT (▶ Fig. 6.10).
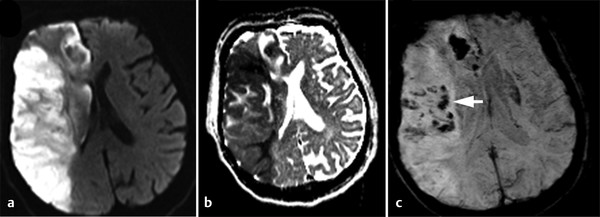
Fig. 6.10 Hemorrhagic transformation of acute right middle cerebral artery (MCA) stroke. Axial (a) diffusion weighted imaging and (b) apparent diffusion coefficient map show a large acute stroke in the right MCA territory. (c) Susceptibility-weighted imaging shows hypointensities (arrow) within the infarcted area due to hemorrhagic transformation.
Stay updated, free articles. Join our Telegram channel

Full access? Get Clinical Tree


