Diffusion-weighted magnetic resonance (MR) imaging (DWI) has shown promise for improving the positive predictive value of breast MR imaging for detection of breast cancer, evaluating tumor response to neoadjuvant chemotherapy, and as a noncontrast alternative to MR imaging in screening for breast cancer. However, data quality varies widely. Before implementing DWI into clinical practice, one must understand the pertinent technical considerations and current evidence regarding clinical applications of breast DWI. This article provides an overview of basic principles of DWI, optimization of breast DWI protocols, imaging features of benign and malignant breast lesions, promising clinical applications, and potential future directions.
Key points
- •
Diffusion-weighted (DW) imaging has shown potential to improve accuracy for lesion characterization on dynamic contrast-enhanced (DCE) magnetic resonance (MR) imaging in multiple studies.
- •
DW imaging may be a noncontrast method of breast MR screening that could be used as an adjunct to mammography.
- •
Increases in tumor apparent diffusion coefficient (ADC) in response to chemotherapy may provide a valuable early indication of treatment efficacy.
- •
Malignant lesions demonstrate restricted diffusion manifested by high signal intensity on DW imaging and low ADC values.
- •
Reproducible uniform fat suppression and techniques to reduce artifacts are essential for high-quality DW imaging of the breast.
- •
To reproduce reported ADC thresholds for lesion characterization, similar b-values must be used.
- •
ADC normalization may reduce variation from individual breast characteristics and technical factors.
Introduction
Diffusion-weighted (DW) imaging is a magnetic resonance (MR) imaging technique that characterizes the three-dimensional mobility of water in vivo and enables indirect assessment of tissue microstructure.
DW imaging is an established diagnostic tool in neuroimaging. Initially used for detecting acute stroke, its application to other areas of the body has been challenging because of technical limitations. More recent advances in MR technology including echo-planar imaging (EPI), high-amplitude gradients, multichannel coils, and parallel imaging have been instrumental in extending the use of DW imaging outside of the brain. DW imaging was first applied for breast imaging in 1997 by Englander and colleagues, and there have been numerous studies exploring the clinical utility of the technique since then.
DW imaging has shown promise for the detection and characterization of breast cancer. As a result, a growing number of imaging centers are incorporating DW imaging into the clinical breast MR examination. However, DW imaging techniques are not standardized and there is no uniform method of interpretation, which limits widespread use. Apparent diffusion coefficient (ADC) values allow quantification of diffusion signal, and can facilitate in differentiating benign and malignant breast tumors as well as identifying early response in tumors undergoing preoperative treatment.
The purpose of this review is to cover the basic principles of diffusion, discuss protocol optimization, review malignant versus benign diffusion imaging features, and discuss potential clinical applications of this promising technology.
Basic principles of DW imaging
Above the temperature of 0 K, gas and liquid molecules move through thermal agitation, a process known as molecular diffusion. In pure water this movement, called Brownian motion, is random, as first formally described by Einstein in 1905. In vivo, the motion of water molecules is restricted by intracellular and extracellular compartments as well as tissue cellularity. The degree of water diffusion in biological tissue is inversely correlated to the tissue cellularity and the integrity of cell membranes. In the case of breast tumors, which typically have high cellular density and intact cell membranes, the motion of water molecules is more restricted than in the normal parenchyma. By contrast, in areas of low cellularity or where the cellular membrane has been breached, the motion of water molecules is less restricted ( Fig. 1 ).
DW imaging is a type of MR imaging scan performed using motion-sensitizing gradients to measure the Brownian motion of water. Whereas contrast-enhanced MR imaging demonstrates tissue vascularity, DW imaging reflects the microscopic cellular environment and is sensitive to characteristics such as cell density, membrane integrity, viscosity, and microstructure.
MR Acquisition
DW imaging involves short acquisition times, approximately 2 to 5 minutes, and can easily be incorporated into standard clinical breast MR imaging examinations. It is typically performed using a T2-weighted spin-echo prepared EPI sequence with an additional pair of motion-sensitizing gradient pulses ( Fig. 2 ), based on methods originally proposed by Stejskal and Tanner. Diffusion gradients should be applied in at least three orthogonal directions to obtain rotationally invariant measures. EPI is used because image acquisition is very fast, which minimizes effects of subject motion. Multiple factors determine the sensitivity of the diffusion sequence to water motion, the primary of which is the degree of diffusion weighting, described by the b-value (unit s/mm 2 ), given by:
where γ is the proton gyromagnetic ratio, G is the gradient strength, δ is the gradient duration, and Δ is the time delay between the leading edges of the two diffusion-sensitizing gradients, as indicated in Fig. 2 . Water protons moving between the timing of the gradients will not be properly phased at the time of readout. As a result, the resulting MR imaging signal is reduced in intensity proportional to the water mobility, and is described by equation:
where S 0 is the signal intensity without diffusion weighting, S D is the signal intensity with diffusion-weighting, b is the applied diffusion sensitization (s/mm 2 ), and ADC is the apparent diffusion coefficient, defined as the average area a water molecule occupies per unit time (mm 2 /s). In vivo, diffusion is quantified by the ADC, accepting that the diffusion process in tissues is not free and is modulated by a composite of mechanisms (microstructural hindrances, microcirculation) that all contribute to the signal attenuation. In general, ADC can be calculated directly from two acquisitions with different b-values using:
where b 1 is the minimum b-value (eg, 0 s/mm 2 ) and b 2 is the maximum b-value (eg, 800 s/mm 2 ), S 1 is the signal intensity at b = b 1 , S 2 is the signal intensity at b = b 2 , and repetition time (TR) and echo time (TE) remain constant.
The standard diffusion sequence generates two sets of images ( Fig. 3 ): T2-weighted reference images obtained without diffusion gradients (S 0 ) and DW images obtained with diffusion gradients (S D ) that reflect water mobility. Because the DW images are T2-weighted images that have been sensitized to diffusion, diagnostic information can be masked by an extraneous long T2 signal, an artifact known as T2 shine-through. The parametric ADC map is created to enable diffusion quantification without T2 shine-through effects. An area of restricted diffusion such as a breast tumor is bright on the diffusion-weighted image and dark on the gray-scale ADC map (see Fig. 3 ).
Protocol optimization
DW imaging protocol optimization includes appropriate b-value selection, sufficient signal-to-noise ratio (SNR), adequate fat suppression, and artifact reduction via shimming and parallel imaging. Furthermore, DW imaging postprocessing analysis requires standard noise filtering, image registration, and consistent methods for region of interest (ROI) measurement for ADC calculation. Consistency in DW imaging acquisition timing precontrast or postcontrast is also recommended.
b-Value
As defined in Eq. 1 , the b-value is proportional to the diffusion time interval multiplied by the square of the gradient strength. It describes the degree of diffusion weighting and is inversely proportional to SNR. The choice of b-values depends on the imaging application. For example, the optimal b-values for breast imaging are lower than the optimal b-values for neuroimaging because normal tissue ADCs are much higher in the breast. In vivo, ADC measures of malignant and benign tumors and noncancerous breast tissue are strongly dependent on the maximum b-value applied ( Fig. 4 ). To reproduce reported ADC thresholds for lesion characterization, similar b-values must be used.
Multiple DW imaging studies have been performed comparing breast tumor conspicuity and diagnostic accuracy at varying b-values. For lesion conspicuity and detection purposes, a high b-value (800–1500 s/mm 2 ) may be preferred to optimize lesion contrast to adjacent tissues ( Fig. 5 ). For differentiation between benign and malignant lesions, choice of b-value may be less critical. One study comparing four b-values from 250 to 1000 s/mm 2 found no significant difference in the ability to discriminate breast lesions, although the investigators reported that 750 s/mm 2 offered the best combination of sensitivity (92.3%) and specificity (96.2%) with an ADC threshold for malignancy of 1.24 × 10 −3 mm 2 /s.
DW imaging acquisition using multiple b-values (more than two) provides a more accurate sampling of signal decay for the calculation of ADC. However, studies of multiple b-value acquisitions in the breast found no improvement over standard two b-value acquisitions in the ability to discriminate benign and malignant lesions. Thus, ADC calculation using two b-values remains the standard at this time.
Although most DW protocols use b = 0 s/mm 2 as the reference for calculating ADC, a nonzero minimum b-value (b ≥50 s/mm 2 ) may be preferable in vivo to obtain ADC measures free from perfusion and flow contamination. However, studies investigating this approach for breast imaging have not clearly demonstrated a diagnostic advantage. Determination of optimal b-values for breast imaging and lesion characterization remain areas of active research.
Signal-to-Noise Ratio
DW imaging is inherently associated with limited SNR, which depends on several factors. Adequate SNR is necessary for lesion conspicuity and accurate ADC measurement. A higher SNR can also be used to increase the spatial resolution of DW imaging. Performing DW imaging at higher field strength can provide a valuable increase in signal. Additional methods to improve SNR for DW imaging include increasing voxel size (increasing slice thickness and/or reducing in-plane spatial resolution), increasing the number of averages, and reducing TE. Short TE also reduces susceptibility artifacts that can occur with higher b-values. Choice of b-value also affects SNR. It has been shown that the b-value that provides the highest SNR for a spin-echo DW sequence is b = 1.1/ADC. For normal breast fibroglandular tissue, with mean ADC of 1.8 × 10 −3 mm 2 /s, this corresponds to an optimal diffusion weighting of approximately b = 600 s/mm 2 . Alternatively, a higher b-value improves contrast resolution (as discussed in the previous section) at the cost of SNR.
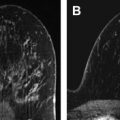
It is noteworthy that breasts with low mammographic density, corresponding to a low volume of fibroglandular tissue, will typically yield visually low SNR on DW images if fat suppression is properly performed ( Fig. 6 ).
Fat Suppression
Reproducible consistent fat suppression is essential for high-quality DW imaging of the breast. Fat suppression is critical to minimize EPI-related image artifacts such as ghosting and chemical shift. Furthermore, ADCs will be underestimated without adequate fat suppression, affecting normal tissue more than tumor. The ADC difference between normal tissue and tumor may not be as significant without adequate fat suppression, resulting in decreased tumor conspicuity. This effect is greater in patients with lower breast density, likely due to increased intravoxel partial-volume averaging of fat and tissue.
The optimal fat-suppression technique will vary across platforms. However, in general spectral fat suppression is preferred. In a prospective study of 165 consecutive patients, spectral fat suppression was significantly better than inversion recovery for lesion delineation, owing to increased SNR, and led to less variability in ADC measurements. Baron and colleagues compared 4 fat-suppression techniques for breast DW imaging at 1.5 T: inversion recovery, spectral selection attenuated inversion recovery (SPAIR), fat saturation, and water excitation. Water excitation had the highest SNR, although it was not significantly different from that of fat saturation and SPAIR.
Fat suppression quality is most readily assessed on the b = 0 s/mm 2 images. An example of high-quality DW imaging with good, uniform fat suppression is shown in Fig. 7 . While fat suppression is essential, it is imperfect. Even in high-quality DW imaging scans, fat signal that is not fully suppressed may appear to gain relative signal strength at high b-value DW imaging because the nonfat tissues are losing signal as diffusion weighting increases, whereas residual fat signal is relatively unaffected by diffusion weighting (see Fig. 7 C).
Common Breast DW Imaging Artifacts
EPI is recommended for DW imaging because it provides fast, motion-freezing imaging with high SNR. However, magnetic susceptibility effects and chemical-shift artifacts are magnified with this sequence. To reduce EPI-related artifacts in the breast, good shimming and fat suppression are essential. Shimming is used to decrease magnetic field inhomogeneities. In the breast, spatial distortion of EPI images occurs because of magnetic susceptibility changes at tissue-air interfaces such as the breast/skin surface and chest wall/lung, which are amplified in the case of inadequate shimming. Most fat-suppression techniques (ChemSat, FatSat; spectral presaturation inversion recovery; SPAIR) also rely on good shim quality over the imaged breast volume.
EPI uses a single excitation and alternating readout trajectory to acquire all lines in k-space that form an image. As a result, before Fourier transform of k-space data every alternate line must be reversed, which can introduce phase mismatch from deviation in the linear gradient course, eddy currents, or inadequate shimming. When phase mismatch occurs, it can cause a mirror image that is slightly shifted and of reduced intensity, called a ghost artifact. Incorporating a parallel imaging technique has been shown to minimize EPI-related susceptibility artifacts in DW imaging and improve image quality and subsequent image interpretation, particularly for DW imaging at 3 T. Several common breast DW imaging artifacts are illustrated in Fig. 8 .
Furthermore, misregistration within the DW imaging sequence between the b = 0 and different diffusion-gradient images can cause inaccuracies in breast ADC calculation. These misalignments may be due to patient motion during the acquisition or eddy-current–based distortions in the direction of the different diffusion gradients ( Fig. 9 ). Image registration algorithms may help improve alignment before calculating ADC. In one study, 10% of breast lesions had misregistration between the DW images that could not be rectified with a postprocessing spatial registration algorithm. There are many additional artifacts associated with DW imaging that are beyond the scope of this article.
Precontrast and Postcontrast DW Imaging
Many practices place DW imaging after the DCE MR imaging scan, which is considered to be the most critical part of the examination, in case patients are not able to tolerate the full examination. The influence of contrast administration on DW imaging is controversial, with some studies demonstrating little effect and others suggesting that the effect may be tissue specific and dependent on image timing after contrast administration. The authors’ data show that ADCs increase significantly after DCE MR imaging in both malignant and normal tissue at 3 T, but this effect can be neutralized by using normalized ADCs (see later discussion). The reason for the observed ADC change requires further investigation. Regardless of where DW imaging is placed in the routine breast MR imaging protocol (before or after contrast), consistency in timing across examinations is recommended for optimal ADC interpretation.
Example DW Imaging Protocol
An example of a standard protocol for breast DW imaging that is currently used as part of a multicenter clinical trial through the American College of Radiology Imaging Network is presented in Table 1 . Of note, the multi–b-value acquisition used in this study is for research purposes, and two b-values (eg, 0, 800 s/mm 2 ) are acceptable for clinical purposes.
| Parameter | DW Imaging |
|---|---|
| Sequence type | DW spin-echo echo-planar imaging |
| 2-Dimensional or 3-dimensional sequence | 2-Dimensional |
| Slice orientation | Axial |
| Laterality | Bilateral |
| Frequency direction | Anterior/posterior |
| Phase direction | Right/left |
| Field-of-view frequency | 260–360 mm a |
| Field-of-view phase | 300–360 mm a |
| Matrix frequency (acquired) | 128–192 |
| Matrix phase (acquired) | 128–192 |
| Reconstruction matrix | 256 × 256 |
| In-plane resolution | 1.7–2.8 mm |
| Fat suppression | Active fat saturation |
| Repetition time | ≥4000 ms |
| Echo time | Minimum (50–100 ms) |
| Flip angle | 90° |
| b-values | 0, 100, 600, 800 s/mm 2 |
| Slice thickness (acquired) | 4–5 mm |
| No. of slices | Variable; bilateral coverage; adjust to keep within single acquisition |
| Slice gap | No gap |
| Parallel imaging factor | ≥2 |
| No. of excitations/averages | ≥2 |
| Sequence acquisition time | 4–6 min (multi-b sequence ∼5 min) |
a Adjust up to 400 mm to accommodate large body habitus if necessary.
DW imaging interpretation
DW imaging assessment includes both qualitative interpretation of DW images for lesion detection and quantitative measures of ADC for lesion characterization. Qualitatively, areas of restricted diffusion will be higher signal intensity on DW images and lower signal intensity on ADC map images.
ADC Quantitation
For quantitative interpretation at the authors’ institution, a commercially available image registration software tool (Diffusion Registration tool; Philips Healthcare, Best, The Netherlands) is first used to spatially align the DW images, using the b = 0 s/mm 2 images as reference. Noise-level thresholding is applied to mask the b = 0 s/mm 2 images before creating diffusion maps. ADC maps are next created using either scanner software or offline processing by applying Eq. 3 on a voxel-by-voxel basis at each slice location.
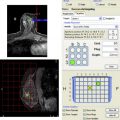
For lesion measurements, after identification on a DCE MR image an ROI is manually defined at the corresponding location (typically hyperintense) on the b = 800 s/mm 2 DW images to encompass as much of the abnormality as possible while staying within the border of the hyperintense region ( Fig. 10 A–C). Susceptibility-based EPI distortions commonly causing pixel shifts on DW imaging (see Fig. 8 C, D) currently limits the ability to propagate ROIs directly from DCE MR imaging. Areas of hemorrhage or necrosis are avoided when defining the ROI by comparing with conventional T1-weighted and T2-weighted images. For measurement of normal fibroglandular tissue, an ROI is drawn in a region of normal-appearing fibroglandular tissue identified on the b = 0 s/mm 2 image, with care taken to avoid including adipose tissue (see Fig. 10 D). The mean DW imaging signal intensity and ADC are calculated for the lesion and normal breast parenchyma.
ADC Normalization
ADC normalization may reduce variation from individual breast characteristics and technical factors such as whether DW imaging is performed precontrast or postcontrast. Normalized ADC is calculated as:
Related posts:
 Breast Magnetic Resonance Imaging Technique at 1.5 T and 3 T
 Updates and Revisions to the BI-RADS Magnetic Resonance Imaging Lexicon
Screening MR Imaging Versus Screening Ultrasound
BI-RADS 3 for Magnetic Resonance Imaging
Updates and Revisions to the BI-RADS Magnetic Resonance Imaging Lexicon
Screening MR Imaging Versus Screening Ultrasound
BI-RADS 3 for Magnetic Resonance Imaging
 Evaluation of Breast Silicone Implants
 Magnetic Resonance Imaging–Guided Biopsy of the Breast
Stay updated, free articles. Join our Telegram channel

Full access? Get Clinical Tree


