The purpose of this chapter is to review the doses involved and to estimate the associated risks in radiology, cardiology, and nuclear medicine. The bulk of radiation exposure is received by patients as part of their diagnosis or treatment, so there is a tangible medical benefit to balance against the risk; but medical radiation exposure is also conducted for medicolegal reasons and on volunteers (patients or healthy persons) for research purposes, and here, the risk-benefit equation is quite different. However, to put things in perspective, we first summarize the radiation doses from background sources that everyone receives naturally. This is usually regarded as an important benchmark, because life on earth has evolved with this continuous background radiation.
▪ DOSES FROM NATURAL BACKGROUND RADIATION
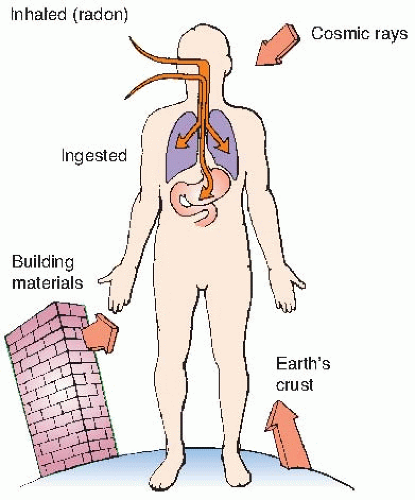
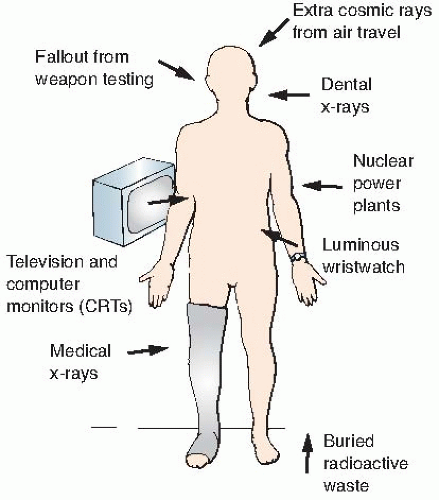
Natural sources of radiation include cosmic rays from outer space and from the sun, terrestrial radiation from natural radioactive materials in the ground, and radiation from radionuclides naturally present in the body, ingested from food, or inhaled. The sources of natural background radiation are illustrated in
Figure 16.1.
Enhanced natural sources are sources that are natural in origin but to which exposure is increased because of human activity (inadvertent or otherwise). Examples include air travel at high altitude, which increases cosmic ray levels, and movement of radionuclides on the ground in phosphate mining, which can increase the terrestrial component to persons living in houses built on waste landfills. Indoor radon exposure might be considered in some instances an enhanced natural source, inasmuch as it is not natural to live in an insulated house. In a sense, also, all operations associated with the nuclear fuel cycle, starting with mining, involve natural radionuclides, but these are more generally classified as a consequence of human activity.
Cosmic Radiation
Cosmic rays are made up of radiations originating from outside the solar system and from charged particles (largely protons) emanating from the surface of the sun. The intensity of cosmic rays arriving at the earth’s surface varies with both latitude and altitude above sea level.
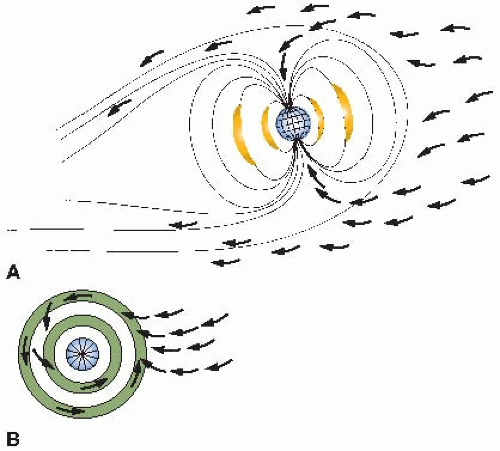
The variation with latitude is a consequence of the magnetic properties of the earth: Cosmic rays are charged particles that tend to be deflected away from the equator and funneled into the poles. This is illustrated in
Figure 16.2. The
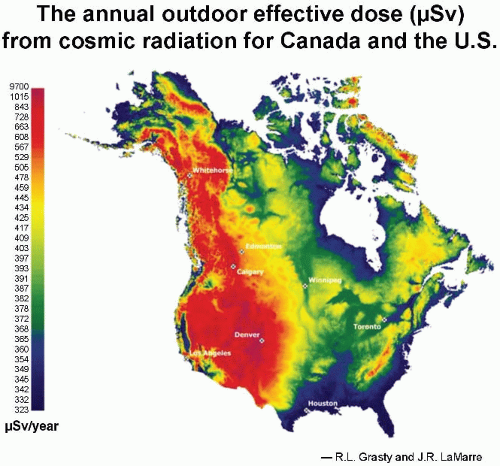
aurora borealis, or northern lights, results from charged particles spiraling down the lines of magnetic field in the polar regions. Consequently, cosmic ray intensity is least in equatorial regions and rises toward the poles. There is an even larger variation in cosmic ray intensity with altitude, because at high elevations above sea level, there is less atmosphere to absorb the cosmic rays, so their intensity is greater. For example, the cosmic ray annual equivalent dose in the United States is about 0.26 mSv at sea level. This essentially doubles for each 2,000-m increase in altitude in the lower atmosphere, so that in Denver, Colorado, the annual effective dose
* from cosmic radiation is about 0.5 mSv. The variation in dose from cosmic radiation across the United States is illustrated in
Figure 16.3 As would be expected, the highest doses are in the Rocky Mountains at high elevations.
Long flights at high altitudes involve some increased dose, too. For example, the extra dose from cosmic rays received by a passenger on a commercial flight flying from the United States to Europe is about 0.05 mSv. Flight crews on northerly routes accumulate larger doses than most radiology staff in hospitals; in fact, airline crews are already classified as radiation workers in Europe, but that is not yet the case in the United States.
Natural Radioactivity in the Earth’s Crust
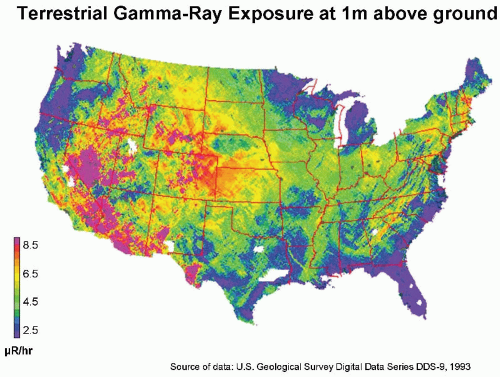
Naturally occurring radioactive materials are widely distributed throughout the earth’s crust, and humans are exposed to the γ-rays from them. In the United States, there is a big variation between the Colorado plateau area, where the rocks and soil contain relatively more radioactive
thorium and uranium (0.75-1.40 mGy per year), and the Atlantic seaboard, where radioactivity is low (0.15-0.35 mGy per year). This variation is illustrated in
Figure 16.4.
Internal Exposure
Small traces of radioactive materials are normally present in the human body, ingested from the tiny quantities present in food or inhaled as airborne particles. Radioactive thorium, radium, and lead can be detected in most persons, but the amounts are small and variable, and the figure usually quoted for the average dose rate resulting from these deposits is less than 10 µSv per year. Only radioactive potassium-40 makes an appreciable contribution to human exposure from ingestion. The dose rate is about 0.2 mSv per year, which cannot be ignored as a source of mutations in humans.
The biggest source of natural background radiation is radon gas, which seeps into the basements of houses from rocks underground. Radon, a decay product in the uranium series, is a noble gas that does little harm itself, because it is breathed in and breathed out again. However, in the confined space of an underground mine or the basement of a house, it decays with a 3-day half-life to form solid progeny that stick to dust or moisture particles and, if inhaled, become lodged on the surface of the bronchus or lung. Radon progeny emit α-particles that, it is believed, are responsible for lung cancer. Radon levels in houses vary enormously, but the average concentration in the United States is about 37 Bq per cubic meter in aboveground living areas and much more in basements. It is a sobering thought that in an average home, in every cubic meter of air, 37 atoms of radon decay each second, producing radioactive progeny. Only the bronchi and lungs are irradiated by this source, but α-particles are highly effective and have a radiation weighting factor of 20 (radiation weighting factor is explained in
Chapters 7 and
17). This translates into an annual average effective dose of about 2 mSv. There is no question that radon is by far the largest component of natural background radiation.
The Environmental Protection Agency action level for radon is 148 Bq per cubic meter; remedial action is suggested for houses above this level. The Committee on the Biological Effects of Ionizing Radiation (BEIR) of the National Academy of Sciences (BEIR IV report, 1998) estimates that radon may be responsible for between 15,400 and 21,800 lung cancer deaths per year in the United States (i.e., about 10% of the total lung cancer deaths).
Areas of High Natural Background
There are several inhabited areas of the world where background radiation is considerably higher than average because of radioactivity in rocks, soil, or in building materials from which houses are made. These areas are in Brazil, France, India, Niue Island (in the South Pacific), and Egypt.
In Brazil, some 30,000 people who live in coastal areas are exposed to dose rates of 5 mSv per year. About one-sixth of the population of France live in areas, largely in the Burgundy winegrowing district, in which the rocks are principally granite, and they receive 1.8 to 3.5 mSv per year from background radiation. Undoubtedly, the highest natural background radiation is in Kerala, India, where more than 100,000 people receive an average annual dose of about 13 mSv, reaching a high in certain locations on the coast of 70 mSv.
Many studies have been made of these human populations who have lived for many generations in areas of high natural background radiation. So far, no excess incidence of cancer or heritable anomalies has been observed that can reasonably be attributed to the radiation. Such studies, of course, are beset with difficulties.
▪ COMPARISON OF RADIATION DOSES FROM NATURAL SOURCES AND HUMAN ACTIVITIES
In addition to natural background radiation, the human population is exposed to various sources of radiation resulting from human activities, as illustrated in
Figure 16.5.
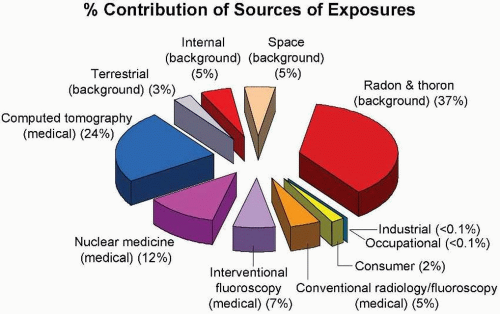
Figure 16.6 shows the contribution of various sources of exposure to the total collective effective dose (1,870,000
person-Sv) and the average effective dose per person in the US population (6.2 mSv) for the year 2006. This represents a doubling in the past 25 years, caused largely by a huge increase in the contribution from medical radiation.
There are several obvious conclusions to be drawn from this summary of doses from all sources. First, the annual effective dose resulting from human activities is now almost exactly equal to the total of all natural sources. Second, radon represents the largest source of natural background radiation, whereas medical radiation dominates the contribution from human activities.
It is important to realize that the populations exposed to these two major sources are not the same. The entire US population in age, gender, and health status is exposed to background radiation. By contrast, persons exposed to medical radiation are “patients,” and, as such, are skewed to older ages and to those with health problems. The principal exceptions are x-rays used for screening problems (e.g., mammography) and for trauma in children.
▪ DIAGNOSTIC RADIOLOGY
The use of x-rays for diagnosis in medicine varies significantly between countries, depending on the standard of health care.
Table 16.1, based on the United Nations Scientific Committee on the Effects of Atomic Radiation (UNSCEAR) 2000, summarizes the availability of radiologists and the number of specialized units, such as computed tomography (CT) scanners and mammography units in the United States, the United Kingdom, and several other industrialized countries.
The radiation doses involved in radiology other than interventional procedures are seldom sufficiently large to result in deterministic effects. By definition, a deterministic effect has a practical threshold in dose, the severity of the effect increases with dose, and it results from damage to many cells. One exception is inadvertent exposure of the developing embryo or fetus, with a possible consequence of reduced head diameter (microcephaly) and mental retardation. The threshold for radiation-induced mental retardation is about 0.3 Gy (International Commission on Radiological Protection [ICRP], 2006), so few procedures are likely to cause this effect.
Apart from this important exception, the potential deleterious consequences of diagnostic radiology involve stochastic effects, that is, carcinogenesis and heritable effects. The characteristic of stochastic effects is that there is no threshold in dose; that is, there is no dose below which the effect does not occur, and the probability of carcinogenesis or heritable effects increases with dose. A stochastic effect may result from irradiation of one or a few cells, and the severity of the response is not dose related. As a consequence, absorbed dose to a limited portion of a person’s body does not provide by itself the overall perspective on risk associated with a given procedure.
Effective dose is a more relevant quantity; it takes into account the tissues and organs irradiated, as well as the dose involved. This is important because some tissues and organs are more susceptible than others to radiation. (Effective dose is discussed in detail in
Chapter 17.) The technical definition of effective dose is the sum of the equivalent doses to each tissue and organ exposed multiplied by the appropriate tissue weighting factors (W
T). What
this amounts to in simpler terms is that effective dose is the whole body dose of x-rays that would have to be delivered to produce the same stochastic risk as the partial body dose that actually was delivered. This quantity provides an easy assessment of overall risk and makes comparison of risks much simpler; for example, risk from a diagnostic examination is more readily compared with that from background radiation if effective dose is quoted. The unit of absorbed dose is the
gray, whereas the unit of effective dose is the
sievert. Most current reports in the literature use effective dose in discussing the potential health consequences of diagnostic radiology.
Last but not the least, the overall population impact of diagnostic radiology can be assessed in terms of the collective effective dose, the product of effective dose and the number of persons exposed. In this case, the unit is the person-sievert. This quantity is a surrogate for “harm” resulting from a given event involving radiation exposure. For example, the collective effective dose from the Chernobyl accident multiplied by the risk coefficient (5% per sievert for fatal cancer) gives an estimate of the number of cancer cases resulting from the accident, and is therefore a measure of the harm done. Later in this chapter, the consequences of the collective effective dose from diagnostic radiology will be discussed.
These three quantities—dose, effective dose, and collective effective dose—are discussed in turn. (In general, whenever the term dose is used alone, it refers to the absorbed dose.)
Dose
Table 16.2 is a summary of entrance skin exposures, as well as absorbed doses to various organs, characteristic of a representative sample of standard diagnostic procedures. The data do not contain any big surprises. As would be expected, radiographs of the lumbar spine, barium enema series, and upper gastrointestinal (GI) series involve substantial doses of radiation because of the need to penetrate these thick and dense regions of the body. These are the procedures, too, that inevitably lead to large gonadal doses.
The Nationwide Evaluation of X-ray Trends (NEXT) is a series of reports that give doses for several common examinations:
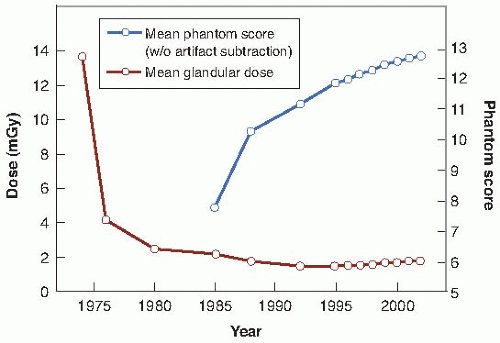
The 1992 report summarized mammography x-ray data. It was shown that over the years, the mean glandular dose per examination has fallen and is now about 2 mGy while the image quality has improved. This is illustrated in
Figure 16.7.
The 1994 report summarized data for adult chest x-rays. The average entrance air kerma was 0.14 mGy at an average clinical kVp (kilovolt peak) of 101, with an average exposure time of 31 ms.
The 1995 report referred to abdomen and lumbosacral spine x-ray data, which are shown in
Table 16.3.
The 1998 report focused on pediatric chest x-ray data. In contrast to the adult chest x-ray data of 1994, the average entrance air kerma was 0.05 mGy at an average kVp of 71, with an average exposure time of 12 ms.
Dental x-ray data were the subject of the 1999 survey. The average entrance air kerma was 1.6 mGy with an average clinical kVp of 71.
Some of the largest doses in diagnostic radiology are associated with fluoroscopy. In this case, the dose rate is greatest at the skin, where the x-ray beam first enters the patient. Dose rates from fluoroscopy from the NEXT 1996 upper GI fluoroscopy survey is shown in
Table 16.4. Although dose rates in the literature are now reported in the new Système International d’Unités (SI) unit of milligray per minute, existing regulations still specify limits in terms of an exposure rate (roentgen per minute). The entrance exposure limit for standard operation of a fluoroscope is 10 R per minute. Some fluoroscopes are equipped with a high output or “boost” mode, and the limit for operation in this mode on state-of-the-art equipment is 20 R per minute. There is no limit on entrance exposure rate during any type of recorded fluoroscopy, such as cinefluorography or digital acquisitions.
A typical fluoroscopic entrance exposure rate for a medium-built person is approximately 3 R per minute (corresponding to an absorbed dose rate of about 30 mGy per minute). Much higher dose rates may be encountered during recorded interventional and cardiac catheterization studies, such as those that involve a series of multiple stillframe image acquisitions.
The number of CT scanners in clinical use has risen steadily over the years, and varies enormously between various countries with very different health care systems. This is evident from
Table 16.5 taken from the UNSCEAR review in 2000, which is already way out of date.
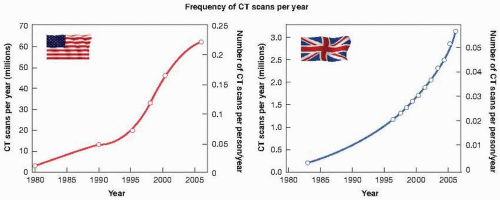
Figure 16.8 shows the dramatic increase in the number of
CT scans performed in the United States and in the United Kingdom in the past 25 years. By 2006, the number of CT scans performed in the United States reached 67 million, with about 10% of them in children. The rate of increase in the United Kingdom is just as rapid, but, taking into account the relative population sizes of the two countries, the frequency of use of CT (in terms of the number of scans/person/year) is about five times lower in the United Kingdom than in the United States. For CT scanning, organs in the beam can receive doses in the range of 10 to 100 mGy, but are usually in the range of 15 to 30 mGy for each single CT sequence. However, surveys emphasize the fact that doses can vary by a factor of 6 between different manufacturers, and by a factor of 5 for the same make scanner between different departments.
Effective Dose
Most recent surveys of diagnostic radiology quote effective dose, because this is related to the risk of stochastic effects, such as the induction of cancer or heritable effects.
Table 16.6 shows representative values (together with range of values) of effective doses from representative radiologic procedures reported in the literature and summarized by Mettler and colleagues in 2008.
It is not difficult to understand why CT scans involve relatively larger effective doses, because larger volumes of tissue are exposed to higher doses than with plain x-rays.
Table 16.7 shows representative values and ranges of values for effective doses from various CT procedures, again taken from the literature and summarized by Mettler and colleagues in 2008.
Pediatric CT scans are a special case. If the same parameters (kV and mA) are used for babies and small children as for adults, much larger doses and effective doses are received by the pediatric cases. This was common practice until 2001, when it was pointed out that children are at least 10 times as sensitive as adults to radiation-induced cancer. As a consequence, a major effort has been made by pediatric radiologists to tailor the appropriate parameters to the size of the person being scanned. This has led to a substantial dose reduction in children receiving CT scans. All major radiologic societies now support the “Image Gently” campaign to reduce doses in diagnostic radiology and to eliminate unnecessary procedures.