Dynamic functional connectivity adds another dimension to resting-state functional MR imaging analysis. In recent years, dynamic functional connectivity has been increasingly used in resting-state functional MR imaging, and several studies have demonstrated that dynamic functional connectivity patterns correlate with different physiologic and pathologic brain states. In fact, evidence suggests that dynamic functional connectivity is a more sensitive marker than static functional connectivity; therefore, it might be a promising tool to add to clinical functional neuroimaging. This article provides a broad overview of dynamic functional connectivity and reviews its general principles, techniques, and potential clinical applications.
Key points
- •
Dynamic functional connectivity in resting state functional MR imaging may provide information that cannot be determined with traditional connectivity analysis.
- •
Dynamic functional connectivity correlates with different brain physiologic states and alterations of dynamic functional connectivity have been seen in various brain pathologies.
- •
Because resting state function MR imaging is increasingly being used in preoperative brain mapping, dynamic functional connectivity may be useful as an additional tool in this clinical setting.
Dynamic resting state functional MR imaging
Resting state function MR imaging (rs-fMR imaging) demonstrates collections of distinct brain regions that exhibit low-frequency, temporally correlated blood oxygen level–dependent (BOLD) signal fluctuations in the absence of an explicit task, which are referred as resting-state networks. With rs-fMR imaging, the anatomic understanding of brain function has evolved from a localizationist perspective to a network-based structure. These networks tend to involve regions that are coactivated and observed with consistency across subjects and scanning periods, suggesting a general principle of brain functional organization. Currently, the analysis of resting-state networks typically uses techniques that assume temporal stationarity and measures of linear dependence are computed over the entire scan to characterize the strength of connections across regions.
Although evident in studies of higher temporal resolution such as electroencephalography or magnetoencephalography, the fluctuation of neurophysiologic processes was initially excluded from consideration when analyzing rs-fMR imaging data, which assumed stationarity across the time of acquisition. However, increasingly, time varying changes in network connectivity, or dynamic functional connectivity (dFC) have been seen across different physiologic or pathologic brain conditions. Additionally, evidence shows that inter-regional correlations can be modulated by cognitive processes that occur on time courses of a typical scan. The “resting state” is a condition of undirected wakefulness that may encompass varying levels of attention, mind wandering, and arousal superimposed on fluctuating patterns of intrinsic brain function. Studies suggest that dFC is in fact able to capture the alterations of intrinsic FC in various physiologic brain states and might be indeed a more sensitive marker than static FC. , In recent years, several studies have also discovered abnormal patterns of brain dFC (characterized by excessive of variability or stability over time) in schizophrenia, autism, dementia, multiple sclerosis, and depression disorders. , , In fact, other brain conditions in which excessive variability or stability of thought processes could occur at different times also appear as ideal candidates to benefit from dFC research.
In this article, we briefly review the underlying principles of dFC, examine techniques for assessing dFC in rs-fMR imaging and highlight selected patterns that emerge, and discuss potential clinical applications of dFC. Our goal is not to attempt a comprehensive review, for which there are many other resources available, but rather to provide a broad overview from which the interested reader can further add to their knowledge from the literature.
Intrinsic correlations of the brain and relevance to dynamic connectivity
The mainstay of rs-fMR imaging analysis is to examine time-varying BOLD signal changes across brain regions while the subject is at rest, often with simple measures such as calculation of the Pearson correlation coefficient ( Fig. 1 ). A collection of similarly time-varying regions is considered to represent intrinsic brain networks. , However, one must understand that the distinction between networks is not as clear-cut as expected. Although it is convenient to lump brain regions into different categories, the designation of brain networks is, to a certain extent, arbitrary. For example, subcomponents of the default mode network (DMN) have been shown to demonstrate variable patterns of correlation and anticorrelation with distinct brain regions. Regions of anticorrelation using a seed in the anterior portion of the DMN, the ventromedial prefrontal cortex, comprised mainly of regions subserving visuospatial attention, whereas a seed in the posterior portion of the DMN, the posterior cingulate cortex, demonstrated anticorrelation with prefrontal planning and control circuits. An interesting observation here is the distribution of primary anticorrelations with seed regions that are found toward the opposite parts of the brain. Therefore, subcomponents of what are often assumed to represent uniformly functioning networks (eg, the DMN), may in fact have different functional roles.
More interestingly, Chang and Glover demonstrated that, when separately measuring correlations (in actuality, the anticorrelations) of the posterior cingulate gyrus in different time periods of rs-fMR imaging image acquisition, slightly different patterns of whole brain connectivity emerged, indicating nonstationarity in internetwork connectivity ( Fig. 2 ). The DMN is a network that is thought to be active in states of spontaneous mind wandering and in situations without a specific goal-directed behavior, generally demonstrating highly opposing patterns of correlations with the somatomotor network, a network that is functionally diametrically opposed to the DMN. Although there have been discussions on whether this is an artifactual residue of processing methods that are beyond the scope of this review, the point still stands that there is a range of BOLD synchronicity across networks. An additional point that is often misunderstood is, in a sense, the equivalence of high correlations and high anticorrelations. In both situations, the fundamental process is a high level of interaction or communication. The lack of this communication or interaction would be manifest not as anticorrelation, but rather as no correlation.

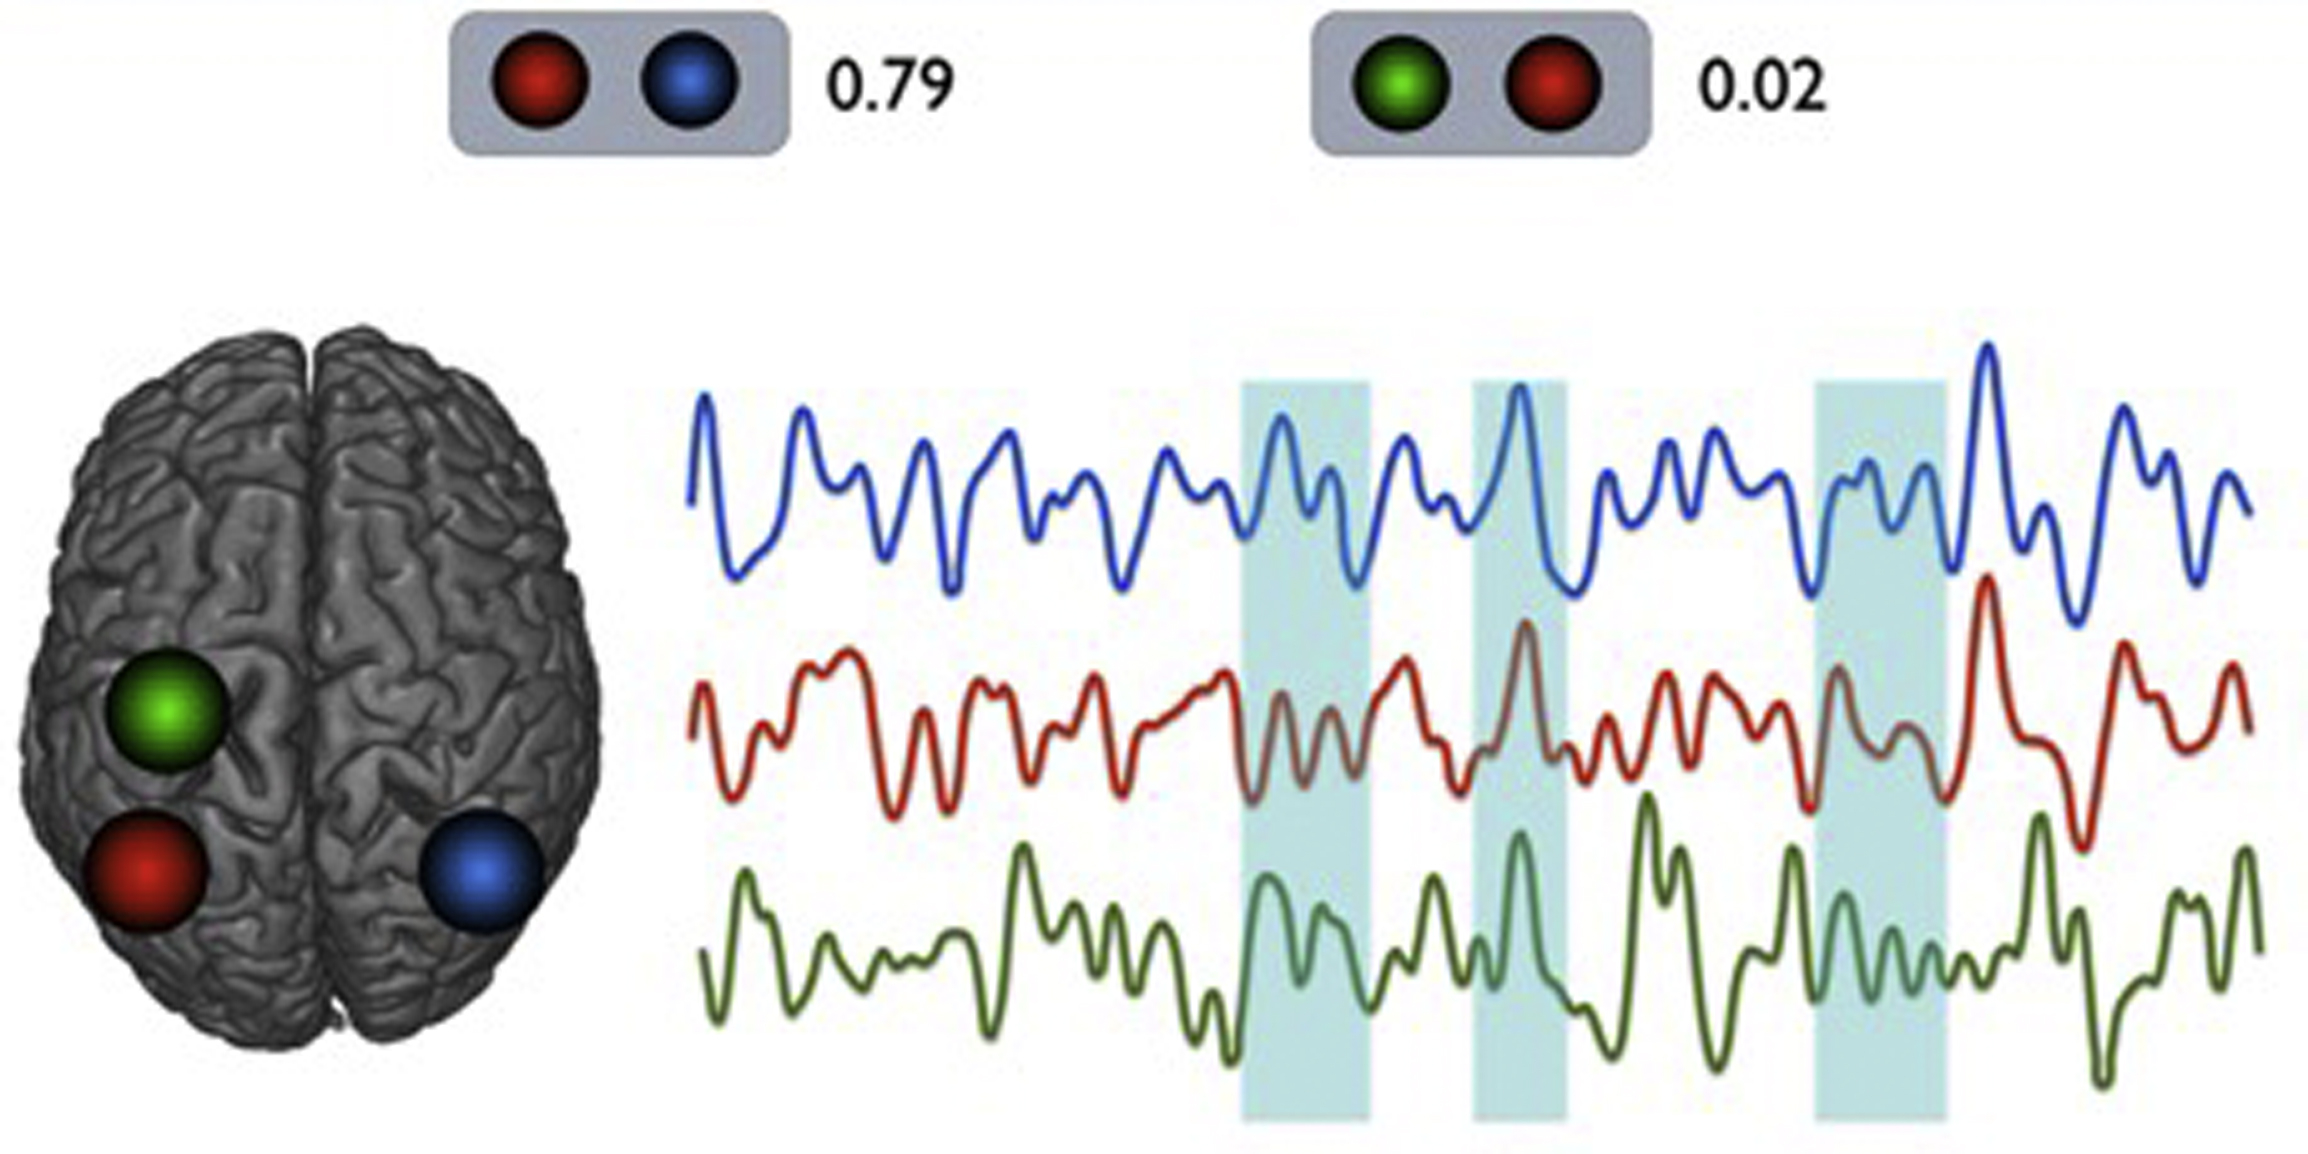
The nature of dynamic correlations, or nonstationarity that is, supported by Chang and Glover’s work, can be illustrated by sampling representative seed regions of the DMN and somatomotor network (see Fig. 2 ). Here, time courses from 2 regions of the DMN (involving the inferior parietal lobules on each side) and 1 region of the somatomotor network (the precentral gyrus) are examined. As expected, homotopic regions of the brain (left and right inferior parietal lobules) demonstrate very high correlations across time, although there seems to be a low overall correlation between an inferior parietal lobule seed and the ipsilateral precentral gyrus seed. However, there do seem to be short instances of transient high correlations, or synchronicity, between them. Furthermore, when individual seed regions within networks are also examined, similar findings emerge, of a variable set of general strength of overall correlations between subcomponents of a network, however with instances of more varying synchronicity, supporting both findings of Chang and Glover (time-varying correlations) and Uddin and colleagues (region-varying correlations).
General methods of assessing dynamic functional connectivity
The general principle of dFC being the determination of assessment of time-varying changes in function, several methods of obtaining the data exist; the simplest to use is sliding time windows to summarize epochs of correlations. Connectivity can be computed between each pair of time courses as a Pearson correlation coefficient within a specified temporal window that is then shifted by a step, and the same calculations are repeated over the time interval. This process is repeated until the window reaches the end point of time courses, to ultimately obtain the time-varying connectivity time course. Values are generally summarized into a matrix describing the connectivity pattern of the brain during the examined temporal interval. ,
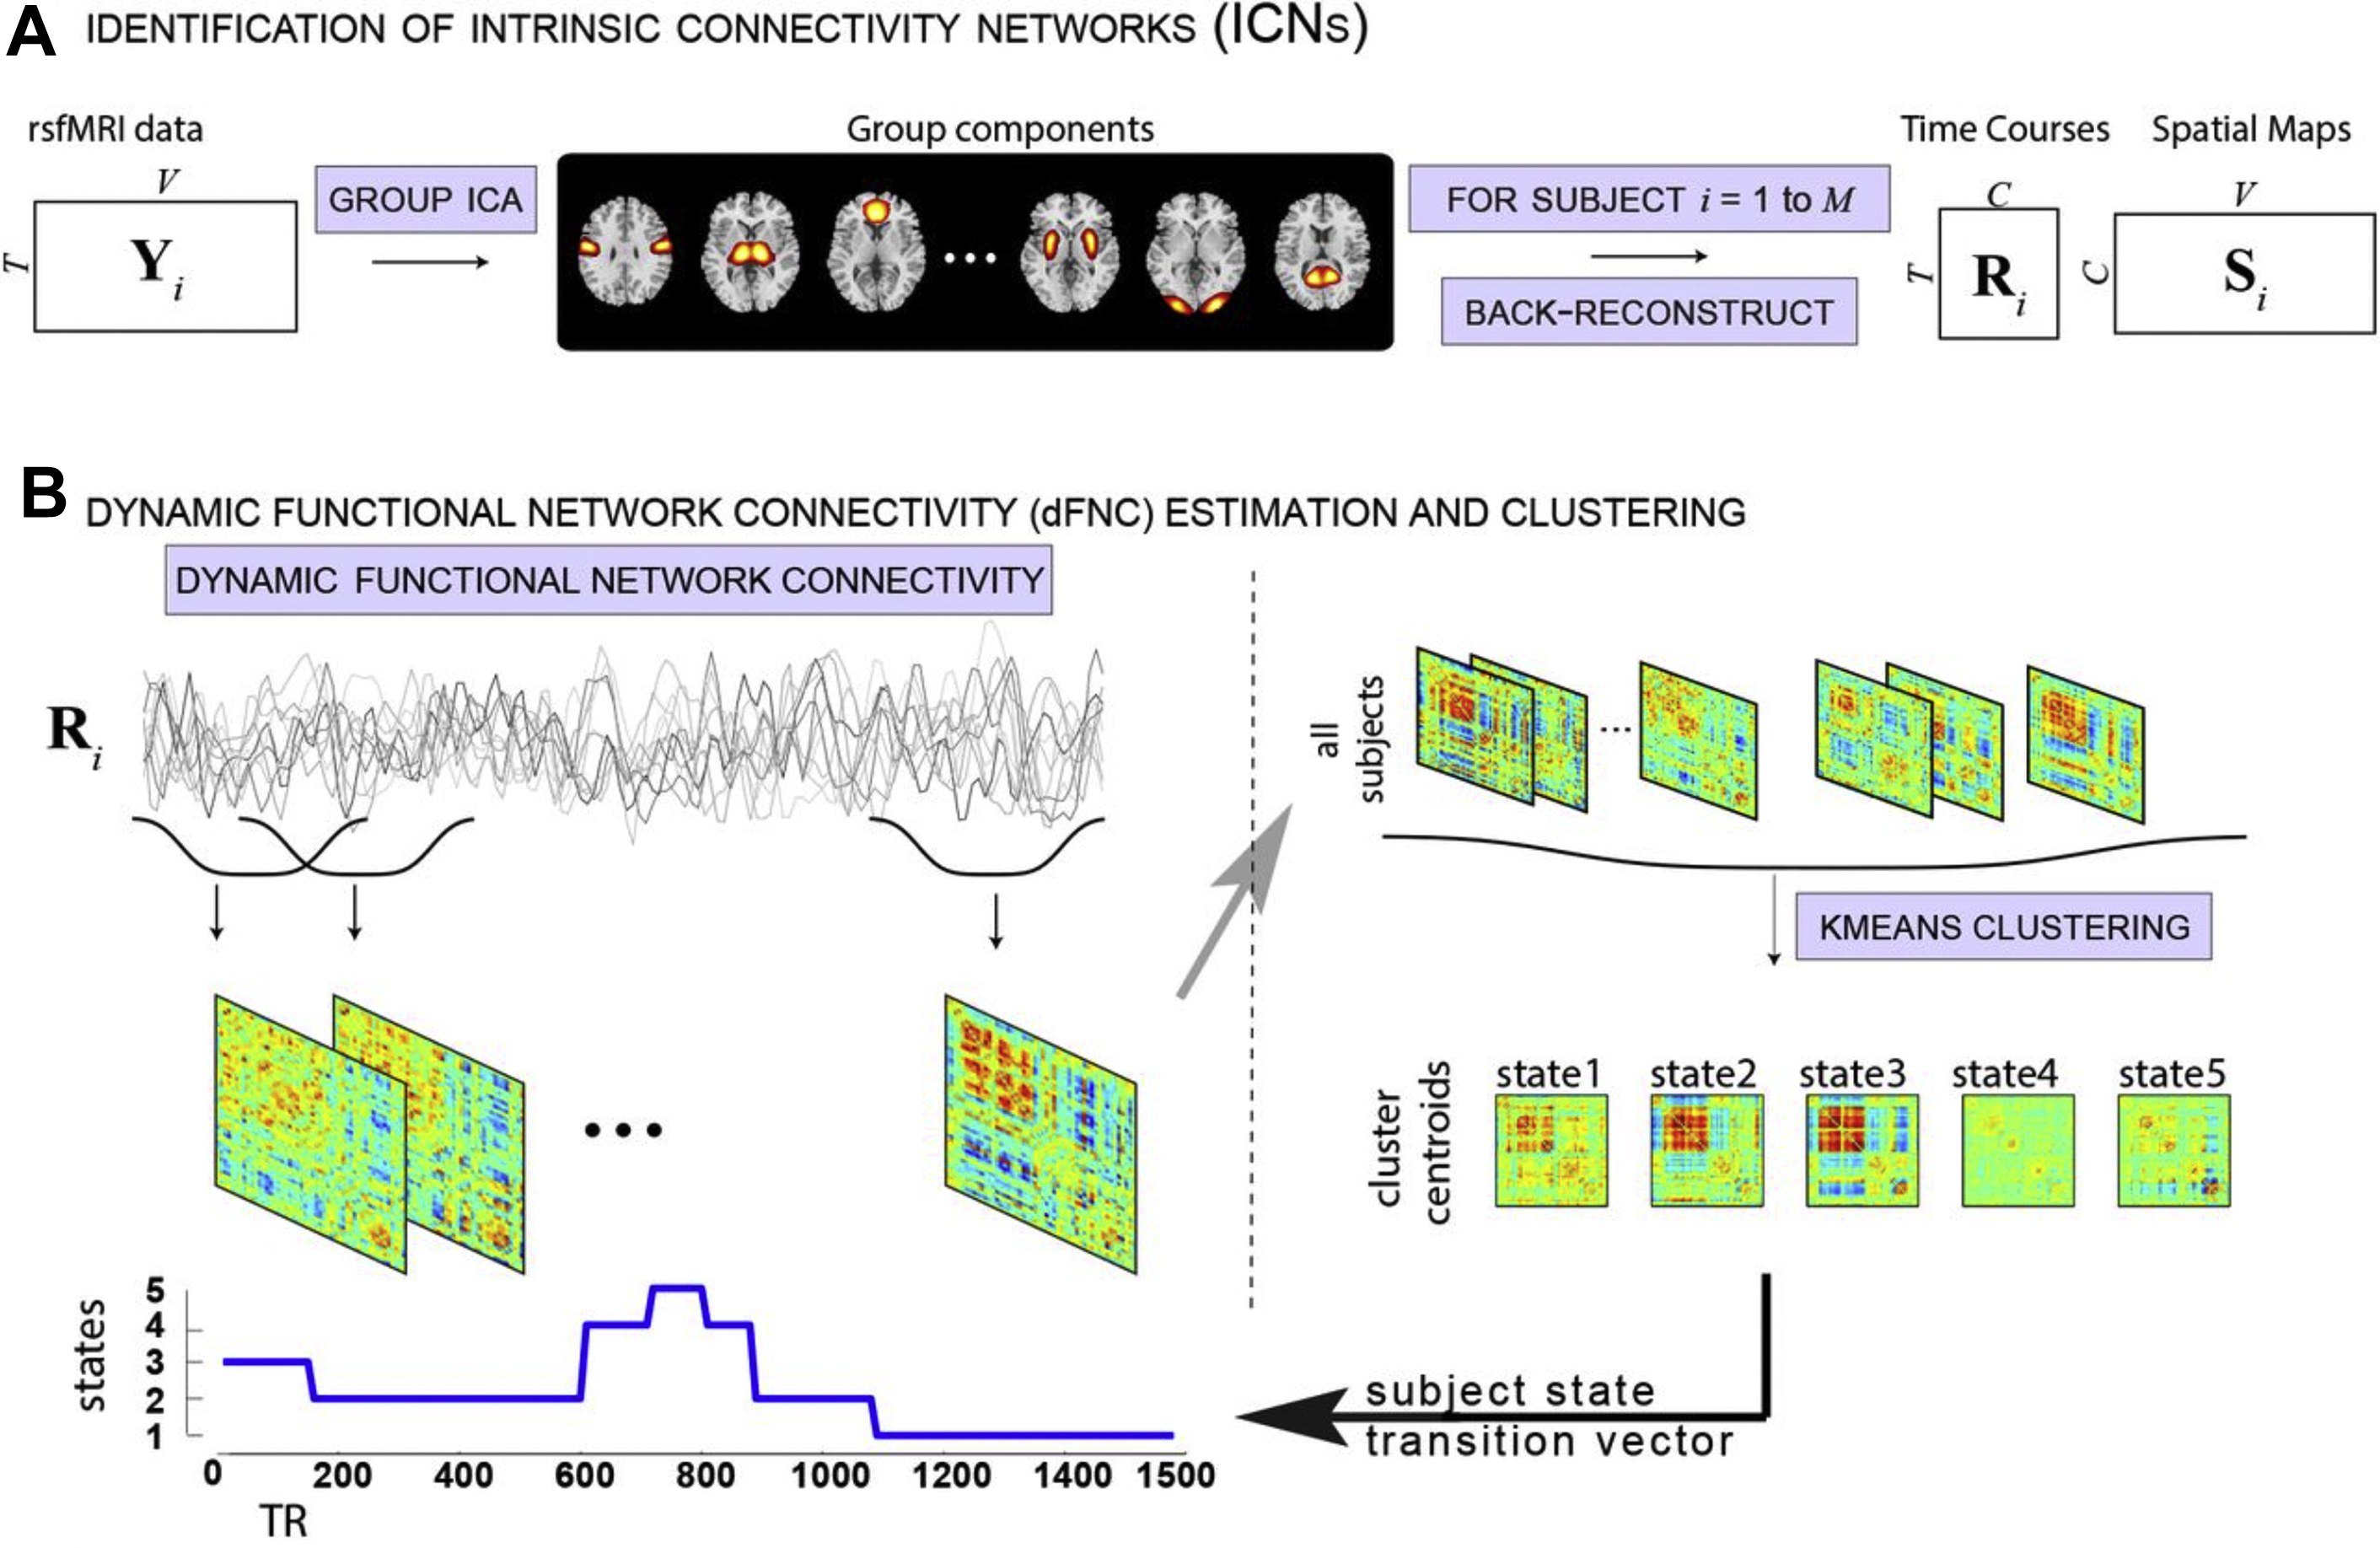
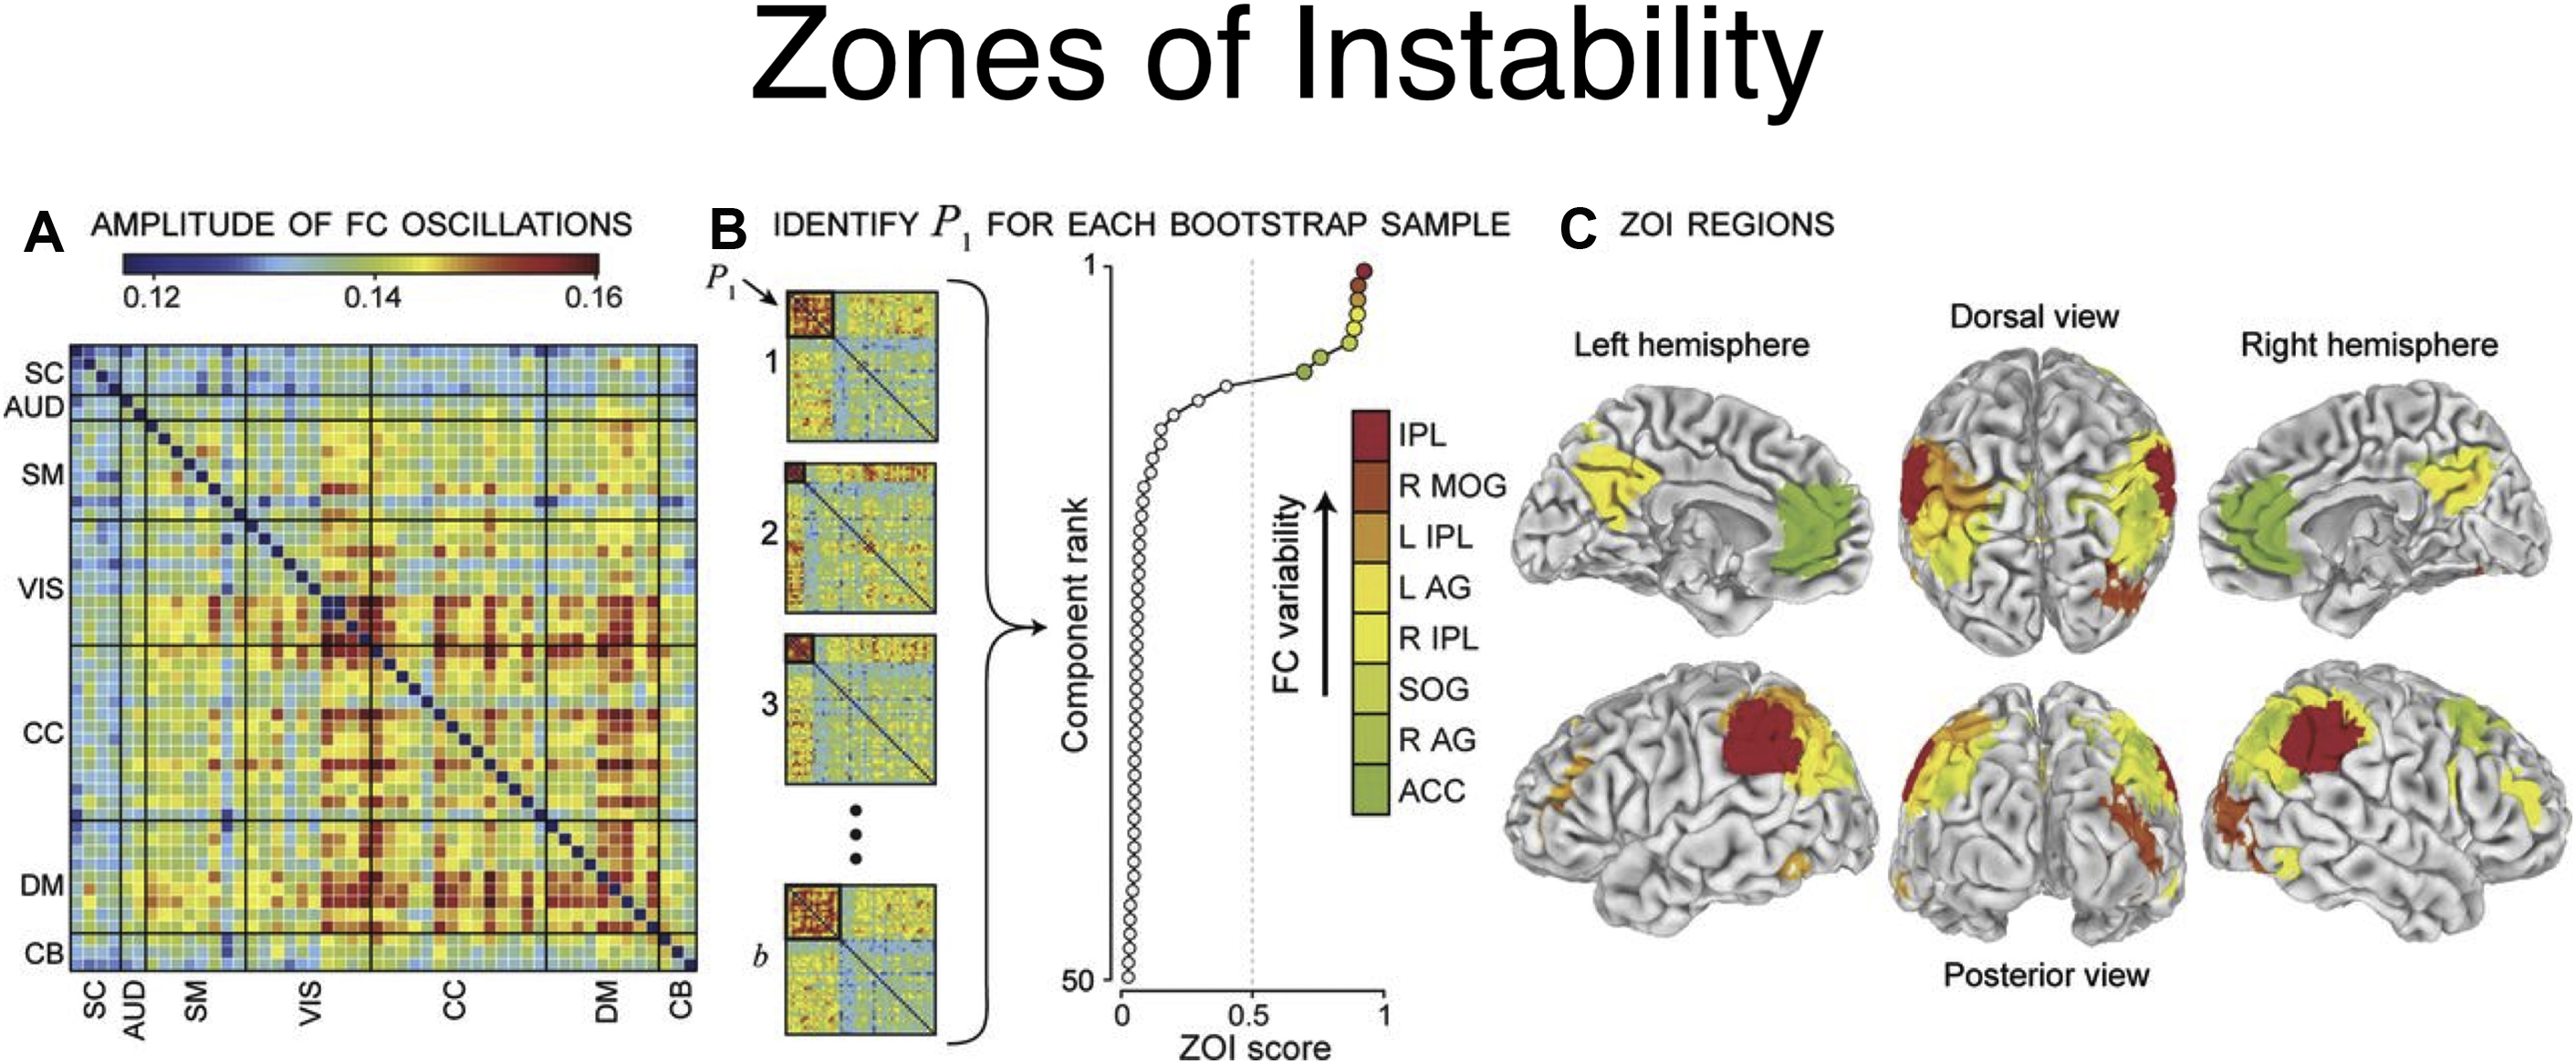
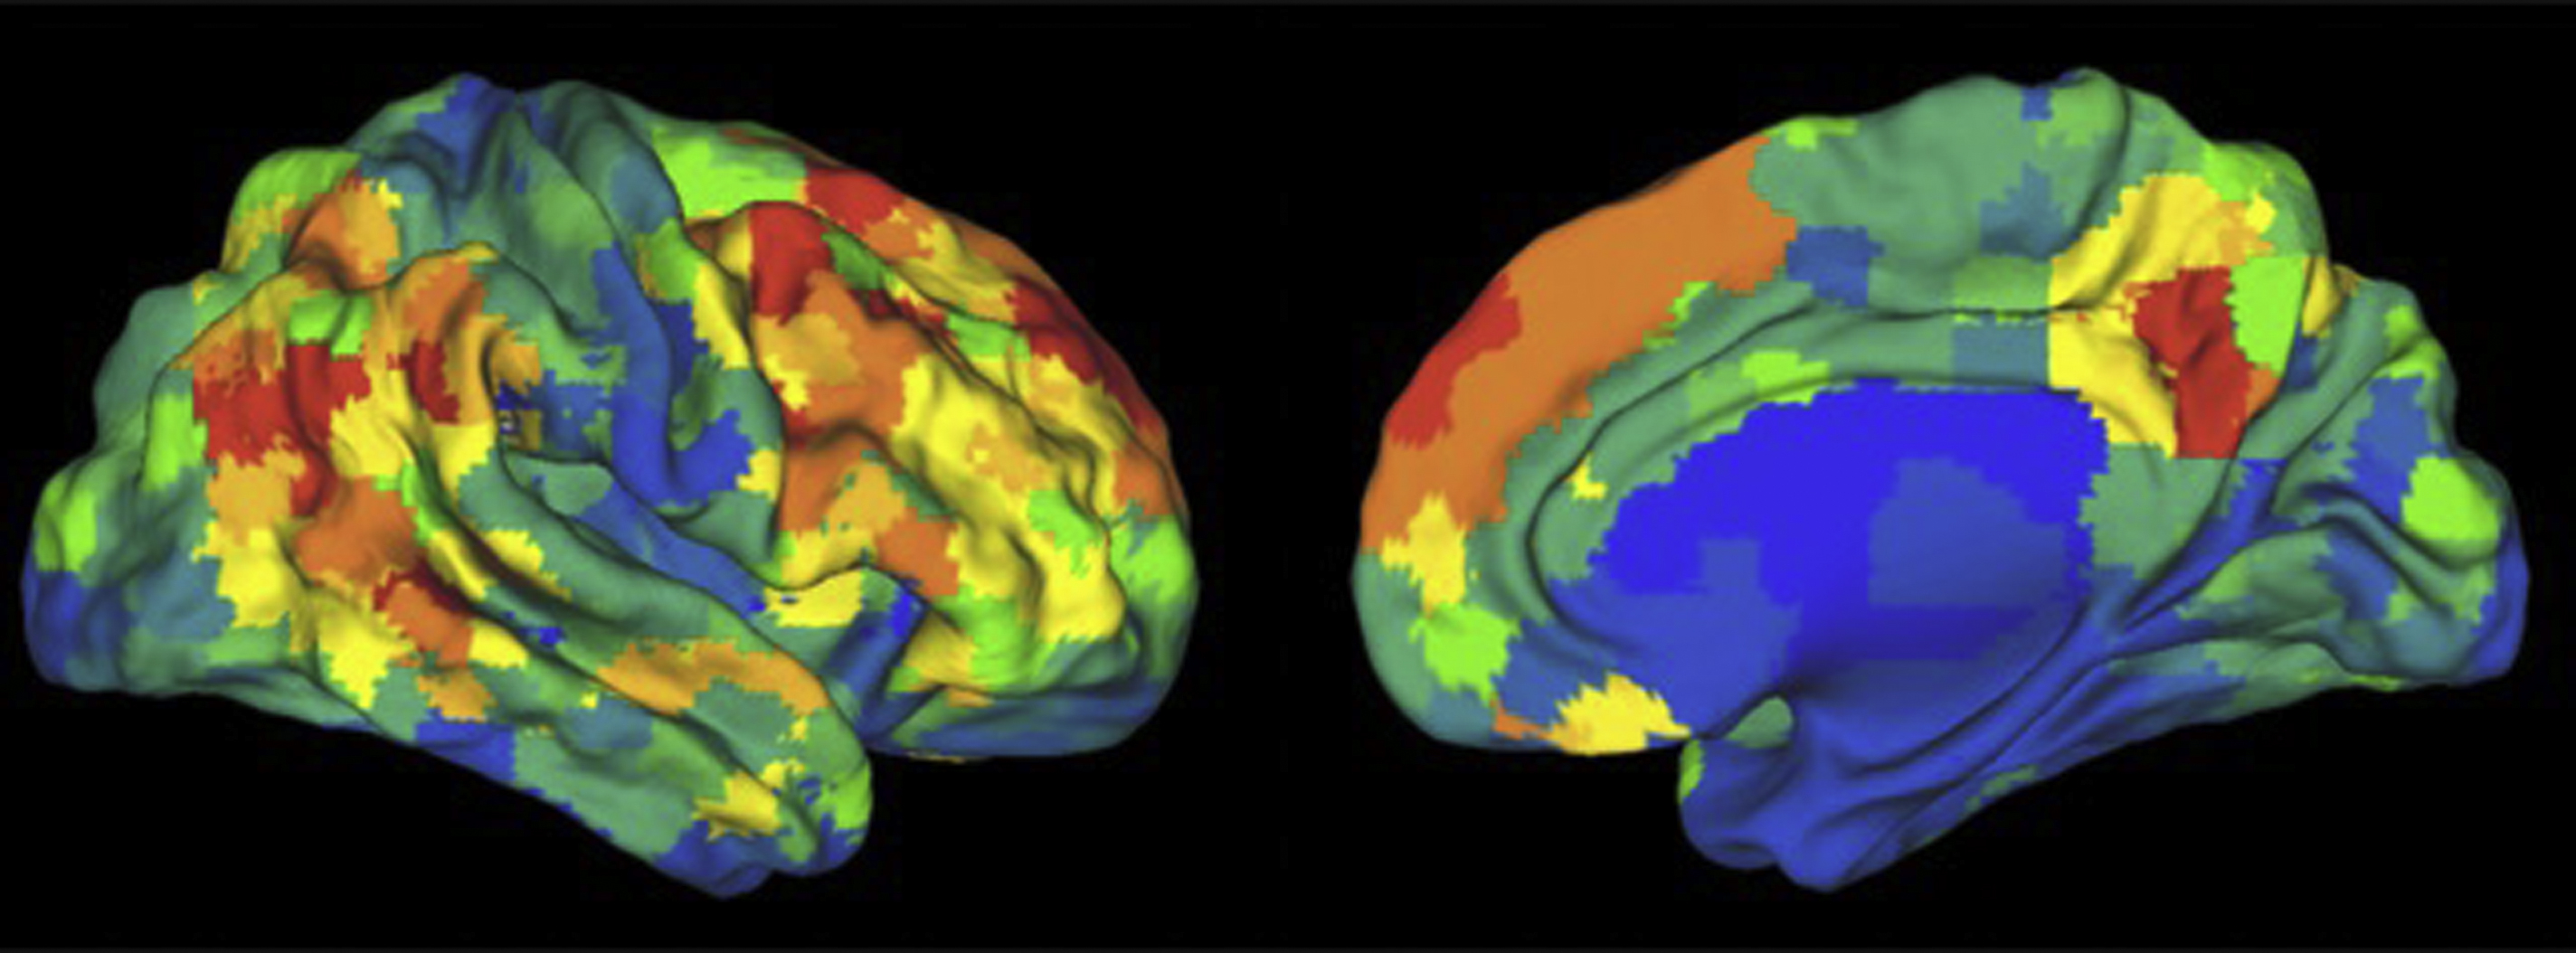
An extension of this method to identify the source time courses is to use network-based connectivity parameters rather than that which is seed based or region based. , Independent component analysis (ICA) can be performed at a group level on a set of subjects to generate a map of consistent brain networks across the cohort. The individual time courses now are generated from each individual ICA component that reflects the representative signal of each network or network subcomponent. Each individual’s unique corresponding subnetwork is back reconstructed to obtain the individual subnetwork time courses, and a subnetwork versus subnetwork correlation matrix generated. A sliding window approach to these data then yields a set of time-varying connectivity matrices for each subject. Allen and colleagues demonstrate that following clustering of these resultant dFC maps, a consistent set of “states” of connectivity can be seen ( Fig. 3 ). They extend the analysis to demonstrate limited sets of patterns of transitions that occur between the different states. Furthermore, when examining the range of variability of subnetworks across, time, an interesting property emerged ( Fig. 4 ). The different subnetworks exhibit different ranges of this variability, and mapping these regions coined the “zones of instability” to the brain demonstrate that the medial prefrontal cortex, the posterior cingulate cortex, and the inferior parietal lobules were the regions of the brain with the highest variability. All of these regions comprise subnetworks of the DMN. Of particular interest is the overlap between these brain regions of high variability or instability and the spatial distribution of brain regions that determine individuality ( Fig. 5 ). Here, Airan and colleagues used an unsupervised algorithm to pair together a set of unlabeled rs-fMR imaging from data that was comprised of test–retest rs-fMR imaging scans of healthy subjects. The algorithm was able to correctly pair the subjects’ rs-fMR imaging scans with high accuracy; the regions of the brain that contributed most to the algorithm’s ability to discriminate between subjects was then determined and was composed of the higher order association cortices, including regions associated with the DMN. It is, at a fundamental level, not surprising that the association areas of the brain, which drive unique processes of the individual as opposed to more functionally homogenous regions such as the primary cortices (motor, visual, etc), also show a high degree of instability.
Exogenous agents can also modulate the dFC states. In a study examining the effect of isoflurane levels on dFC, increased levels were shown to result in increased “dwell times,” or inertia, within a particular state, with decreased frequency of state-to-state transitions as well. The overall number of individual states also decreased as the level of anesthesia increased. Indirectly, this also supports the role of dynamic correlations in the manifestation of the “self” described elsewhere in this article.
More recently, the use of mind-altering agents (specifically hallucinogens) have been explored as a novel mechanism for conditions or situations that may be resistant to conventional methods of treatment. Psilocybin, for example, has been used in studies for intervention for smoking cessation or to treat depression. Indeed, dynamic connectivity patterns are shown to be altered when psilocybin is administered; although the authors did not specifically correlate the dFC changes with behavioral measures, it would be interesting to see whether similar findings are manifest between the changes in dFC after psilocybin administration and behavioral measures.
There are, however, other studies demonstrating a correlation of sliding window analyses with behavioral measures that may be not be evident using static connectivity analysis methods. For example, factor analysis of dynamic connectivity yields a set of edges with covarying connectivity that can be separated into defined groups. One specific factor of the dorsal attention network has been shown to predict performance on an attention task.
More broadly, a study specifically contrasting static FC and dFC in mind wandering demonstrated that while there was no correlation of static FC measures with levels of mind-wandering after the administration of a painful stimulus, sliding window analysis in fact showed a weak but significant correlation with greater variability in connectivity measures correlating with higher rates of mind wandering and thoughts unrelated to the painful stimulus. Conceivably, dFC measures such as this may be used in conjunction with neurofeedback mechanisms as a potential treatment for chronic pain syndromes.
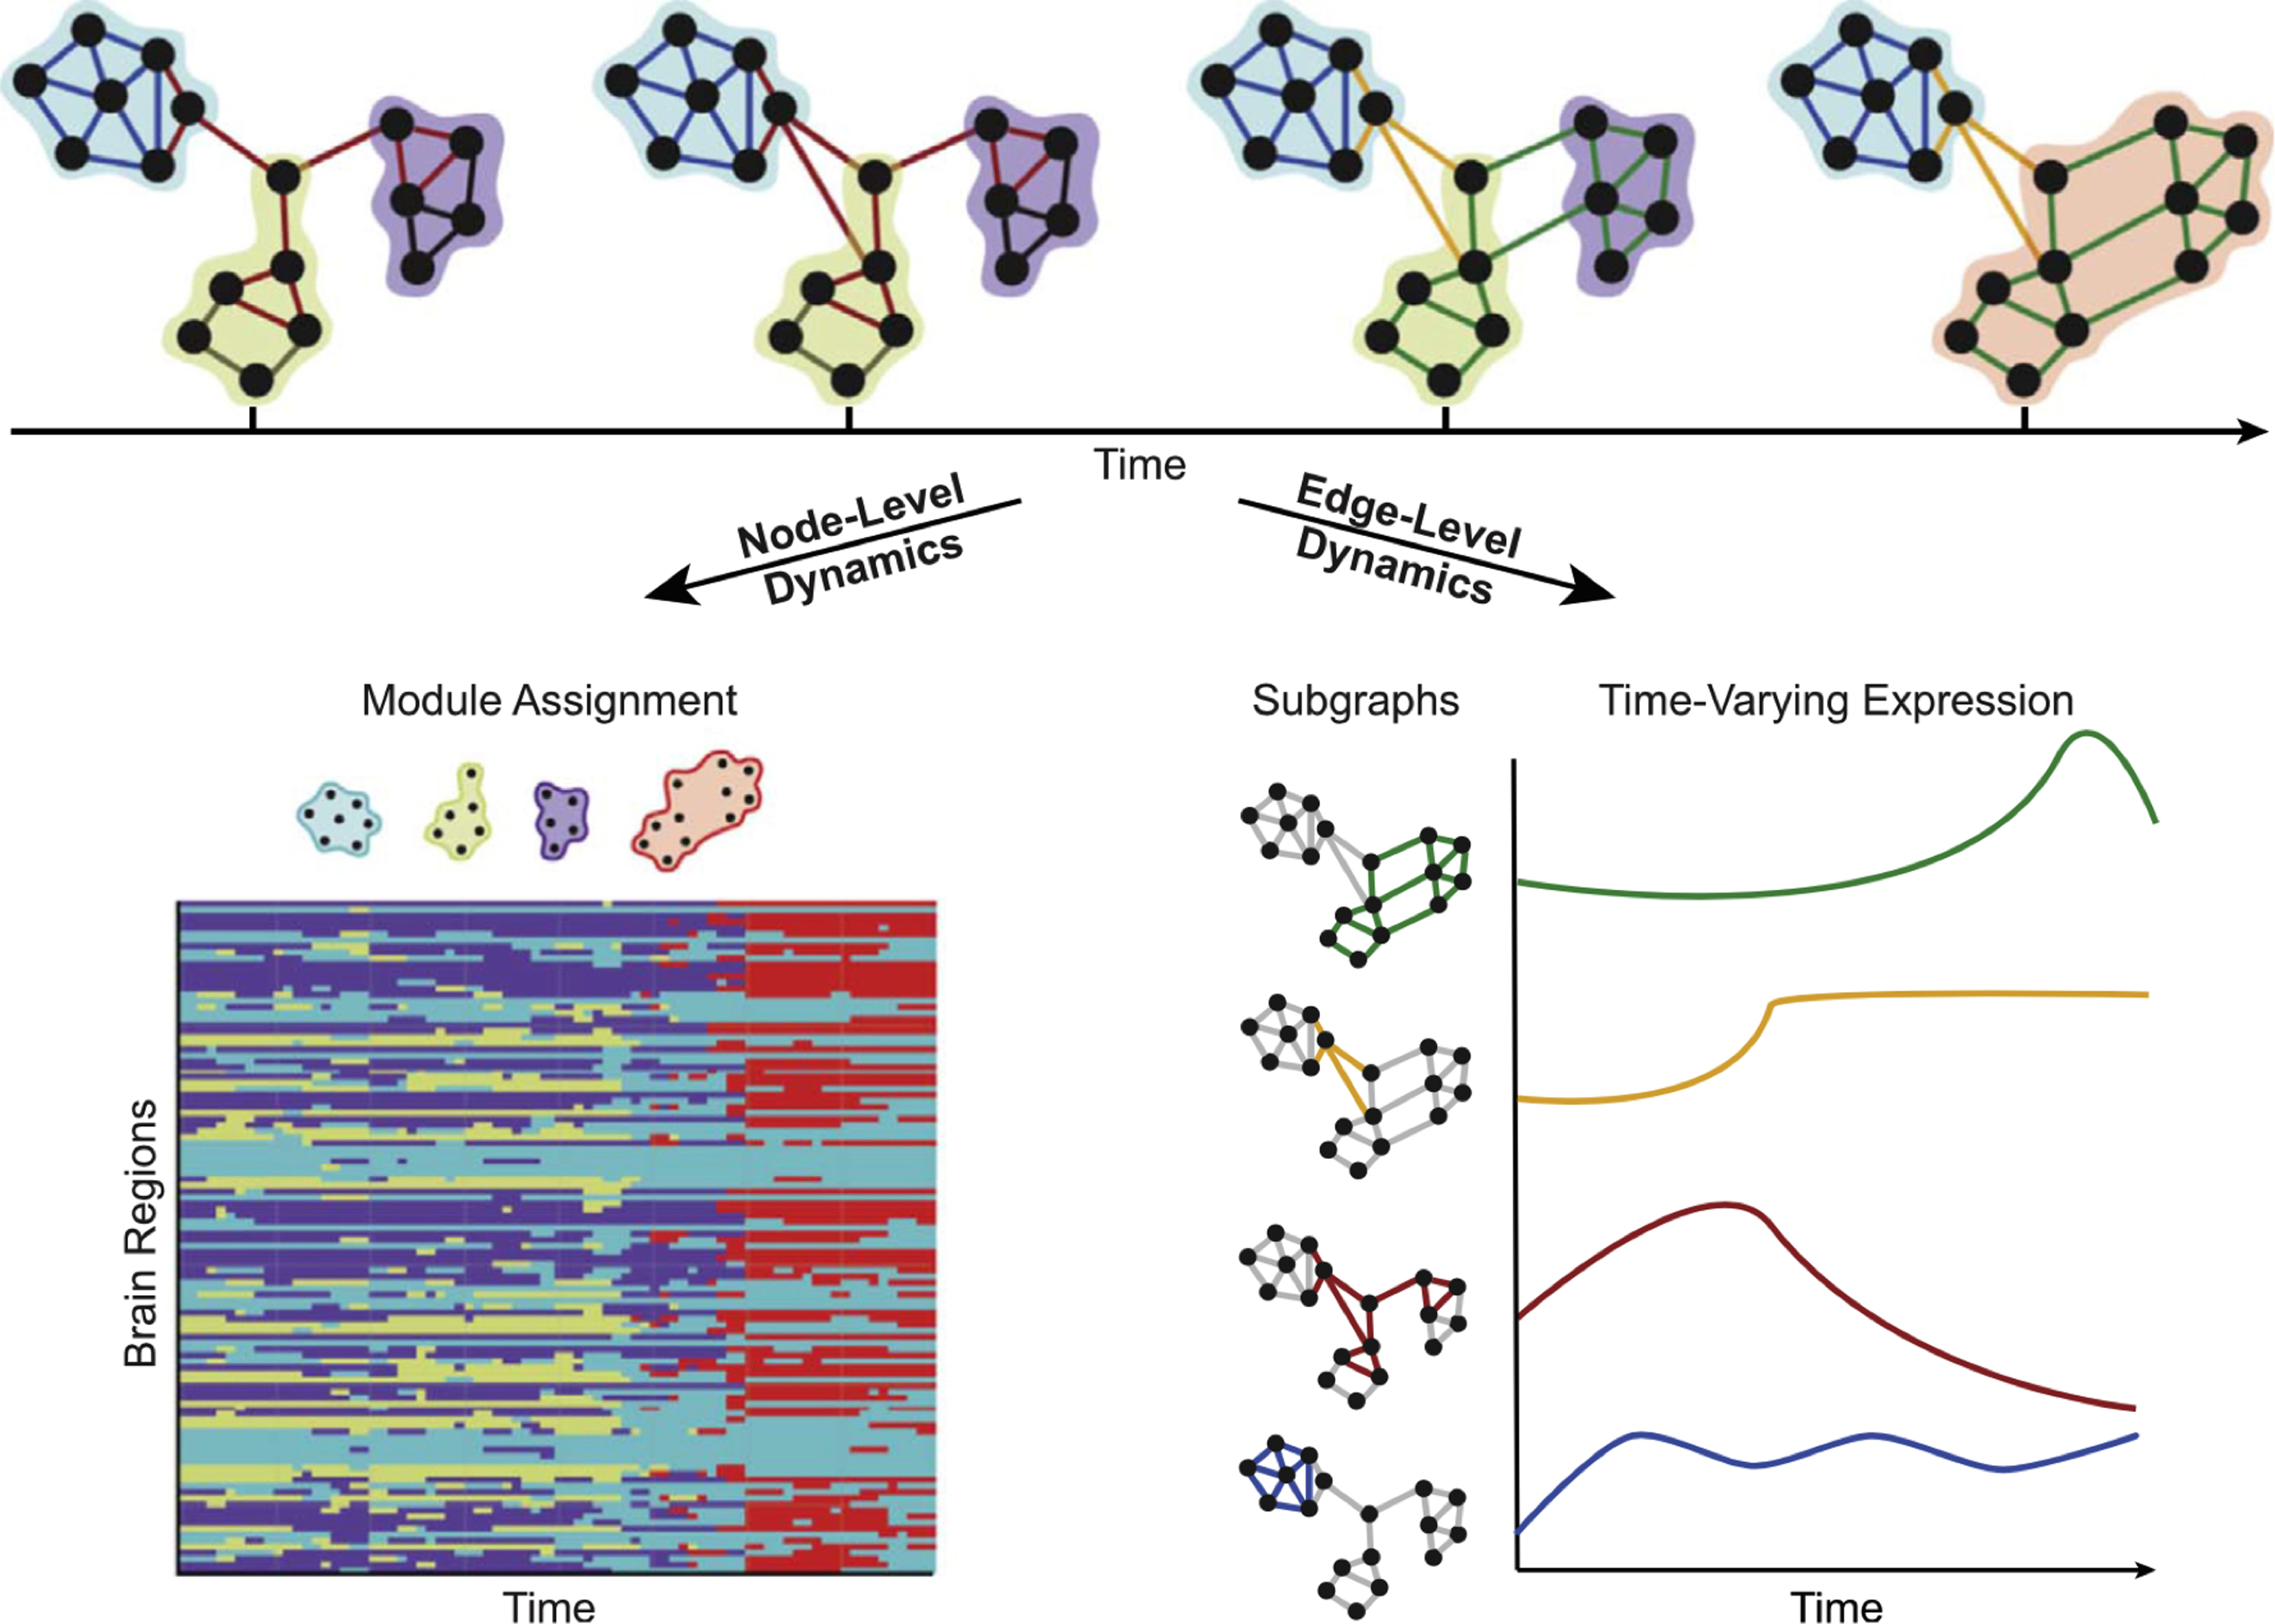
As an extension to seed/region of interest (ROI)–based analysis, graph theoretic approaches have been used to summarize network properties of functional connectivity, including dFC analysis. Nodes represent subsegments of brain regions, and edges represent the connectivity between them. Network properties such as efficiency or small worldness can be easily calculated. Modularity represents the product of clustering of nodes that share similar connectivity properties to detect community structure in networks. Two complementing sets of properties can then be described. First, the variability across time in the assignment of a particular node to a specific module or community, and second, the variability of the strength of the patterns of edges that describe a particular module ( Fig. 6 ). Annotated graphs extend the ability to inform characteristics of graph components by incorporating specific properties of the node itself to the overall graph structure. An example of intrinsic node properties would be, for example, the amplitude of BOLD activation for a region, as opposed to additional calculated graph metrics of a node such as node degree. By using annotated graphs, the discrepancy between BOLD magnitude of individual nodes (ie, the annotated nodes) and the community structure of the functional connectivity patterns (ie, the graph edges) was shown to predict individual differences in learning of a new motor skill.