Dynamic susceptibility contrast (DSC) MR imaging, a perfusion-weighted MR imaging technique typically used in neuro-oncologic applications for estimating the relative cerebral blood volume within brain tumors, has demonstrated much potential for determining prognosis, predicting therapeutic response, and assessing early treatment response of gliomas. This review highlights recent developments using DSC-MR imaging and emphasizes the need for technical standardization and validation in prospective studies in order for this technique to become incorporated into standard-of-care imaging for patients with brain tumors.
Key points
- •
The most common parameter measured with dynamic susceptibility contrast (DSC) MR imaging is relative cerebral blood volume (rCBV), a measure of microvascular density that augments conventional contrast-enhanced MR imaging in the initial evaluation and posttreatment monitoring of brain tumors.
- •
Lesions with high rCBV tend to distinguish tumor from nontumor, correspond with higher rather than lower tumor grade with worse prognosis, and designate biopsy sites with an increased likelihood of capturing the highest-grade portion of tumor.
- •
The rCBV values at or compared with baseline may help with response assessment for cytotoxic (progression vs pseudoprogression) and antiangiogenic (response vs pseudoresponse) therapies.
- •
Preliminary studies suggest that DSC-MR imaging may also have applicability to immunotherapies.
- •
DSC-MR imaging protocols and postprocessing techniques vary widely in the literature, and validation with standardization of methods providing clinically reliable measurements is needed, particularly in the setting of multicenter clinical brain tumor trials.
Basic principles of dynamic susceptibility contrast–MR imaging
As contrast-enhanced MR imaging is the standard of care for assessing brain tumors, perfusion-weighted MR imaging (PWI) techniques using gadolinium-based contrast agents (GBCA) are commonly used for neuro-oncology applications, which include DSC and dynamic contrast-enhanced MR imaging. DSC-MR imaging has been the most prevalent PWI methodology for measuring brain tumor perfusion and is the focus of this article.
DSC-MR imaging is a bolus tracking technique that rapidly acquires gradient echo (GRE) or spin echo (SE) echo planar images before (baseline), during, and after (tail) first-pass transit through the brain of an exogenous paramagnetic GBCA that transiently decreases signal intensity. Voxelwise changes in contrast agent concentration are determined by converting the signal intensity-time curves into relaxivity-time curves assuming that transient signal loss is due solely to changes in T2* (GRE) or T2 (SE) relaxivity. Because relaxivity change is assumed to be directly proportional to contrast agent concentration, the relaxivity-time curves are processed using tracer kinetic modeling and indicator dilution theory to estimate cerebral hemodynamic parameters, such as cerebral blood volume (CBV), cerebral blood flow (CBF), and mean transit time. rCBV compared with normal-appearing white matter is the most common DSC-MR imaging metric for evaluating brain tumors because it obviates measurement of an arterial input function, which can be prone to error. Nonetheless, absolute CBV can be determined if the arterial input function is quantified, which is commonly done in a semiautomated fashion by identifying signal-time curves that have arterylike morphology, usually from voxels in the middle cerebral artery or anterior cerebral artery. It should be noted that differences in contrast agent bolus delay and dispersion can introduce systematic error in hemodynamic parameter estimation across the brain.
DSC-MR imaging is based on the classic indicator dilution theory, a methodology used by physiologists to quantitate hemodynamics of whole-organ systems using nondiffusible tracers, such as dyes and radiotracers. The indicator dilution technique assumes intravascular compartmentalization of a nondiffusible tracer, which is violated for GBCA tracers in high-grade gliomas (HGGs) with blood-brain barrier (BBB) disruption and avid contrast enhancement. GBCA extravasation yields T1 shortening, opposing the susceptibility contrast-induced T2 or T2* relaxivity change from intravascular GBCA that forms the basis for CBV estimation. Methods for minimizing the T1 contamination from GBCA extravasation have been developed, although no standardized technique has been universally accepted. For single-echo (GRE or SE) DSC-MR imaging acquisitions, low flip angles (ie, 35°–60°) with longer repetition time and echo time (TE) can reduce T1 contamination, and gamma-variate fitting of the relaxivity-time curve can eliminate negative relaxivity changes due to contrast extravasation. However, these techniques may reduce the signal-to-noise ratio of the computed CBV maps. A preload dose of GBCA administered before the bolus dose of GBCA during dynamic imaging can help mitigate T1 contamination by saturating baseline T1-weighted signal contribution, thereby diminishing dynamic-injection T1-induced increased signal. Preload contrast administration combined with model-based postprocessing leakage correction that diminishes both T1 and T2* extravasation-induced contamination effects improves the accuracy of rCBV estimates in HGGs. Consensus recommendations for leakage-corrected, single-echo DSC-MR imaging are emerging and seem to be directed toward a technique combining a preload of GBCA with model-based leakage correction. Dual-echo DSC-MR imaging uses 2 GRE acquisitions with different TEs to estimate T2* relaxivity directly, thereby eliminating the T1 contamination effects entirely, but requires special pulse sequences that are less widely available. Contrast agent recirculation can introduce smaller periodic decreases in signal intensity after the primary bolus passage. These decreases are either assumed to be negligible or eliminated by using either abbreviated numerical integration or gamma-variate fitting applied to the associated relaxivity-time curve.
Applications of dynamic susceptibility contrast–MR imaging to brain tumors
DSC-MR imaging can augment conventional MR imaging in the initial evaluation and posttreatment monitoring of brain tumors. Although there are many potential neuro-oncologic applications, most fall within 2 distinct categories: (1) improving accuracy in diagnosis, prognosis, and predicting efficacy of a specific therapy before treatment initiation and (2) assessing response to therapy.
Initial Diagnosis, Prognosis, and Predicting Efficacy of Therapy Before Treatment
Distinguishing tumor from nontumor
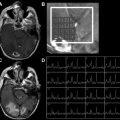
Differentiating neoplastic from non-neoplastic lesions can be difficult using conventional MR imaging, and often biopsy or follow-up imaging is needed. Multiple studies have shown that the rCBV of infectious lesions is significantly lower than that of metastases or glioblastoma multiformes (GBMs). This difference likely reflects the lower microvascular density found in infectious lesions like abscesses relative to that of high-grade tumors. In patients with AIDS, lower rCBV has been reported in toxoplasmosis compared with lymphoma ( Fig. 1 ). It should be kept in mind, however, that some infectious lesions like tuberculomas can have elevated rCBV values because of reactive neovascularization; but rCBV is still typically less than that for HGGs ( Fig. 2 ). In a recent report of 100 consecutive patients with neoplastic (54) and infectious (46) noncortical lesions, a mean rCBV value of 1.3 had 97.8% sensitivity and 92.6% specificity for distinguishing tumor from infection, with a positive predictive value of 91.8%, a negative predictive value of 98.0%, and an accuracy of 95.0%.


With regard to tumefactive demyelinating lesions, rCBV is found to be generally lower than in neoplasms ; however, very high rCBV is rarely reported in these lesions, possibly because of the consequence of inflammatory angiogenesis. An important caveat to keep in mind is the potential for overlap of rCBV values between low-grade tumors and non-neoplastic lesions.
The systematic incorporation of DSC-MR imaging as part of a multiparametric advanced MR imaging approach also uses magnetic resonance spectroscopy (MRS) and diffusion-weighted imaging (DWI), which have been proposed as a means for better differentiation between neoplastic and non-neoplastic lesions.
Glioma grading and prognosis
Glioma grade is established histopathologically following biopsy or resection. Sampling error can compromise the accuracy of tumor grading. Furthermore, low-grade tumors may evolve into high-grade lesions. Imaging has the advantages of noninvasiveness, global assessment of the tumor, and repeatability for longitudinal monitoring of tumor behavior.
Compared with low-grade gliomas (LGGs), HGGs grow more rapidly because of the higher cellular proliferation and tend to develop hypoxic regions, resulting in necrosis and increased angiogenesis. HGGs usually exhibit highly dense, albeit disorganized, microvasculature with increased capillary permeability. Thus, higher rCBV correlates with higher tumor grade ( Fig. 3 ). Unfortunately, substantial overlap of perfusion markers between tumor grades and histologies limits the ability of perfusion imaging to identify specific tumors. For instance, DSC-MR imaging cannot reliably differentiate between grade III and IV tumors. Furthermore, low-grade oligodendrogliomas can have elevated rCBV mimicking high-grade astrocytomas. Conversely, GBMs with oligodendroglial components have lower rCBV compared with GBMs with no oligodendroglial components. Although no standardized multimodal methodology has been developed thus far, the combination of other markers with DSC-MR imaging, such as MRS and DWI, may improve the accuracy of tumor grade designations.
MR imaging may generate prognostic information beyond tumor grade. For instance, grade III gliomas with necrosis reportedly have overall survival (OS) rates comparable with GBMs, possibly because of undergrading of grade III tumors secondary to sampling error. Contrast enhancement is generally a marker for high-grade tumor: it is found in up to 30% of grade II tumors and in more than 50% of grade III tumors, whereas almost all GBMs showed contrast enhancement. Enhancement, even within grade II tumors, is associated with poorer outcomes.
DSC-MR imaging may extend prognostic models for HGGs. As with LGGs, higher rCBV has been shown to correlate with poor outcomes. Specifically, maximum rCBV stratifies OS, and gliomas with mean rCBV greater than 1.75 progress earlier than those with rCBV less than 1.75.
Prognostic models may be improved by linking imaging features to molecular subtypes of GBM. Hierarchical clustering and random forest analyses have identified clusters of GBMs with high rCBV and gene expression associated with vasculogenesis and endothelial permeability; these patients have worse OS. Similarly, machine learning paradigms have analyzed 60 features from preoperative GBM MR imaging, including perfusion data and stratified survival, and predicted molecular subtype (classic, mesenchymal, neural, proneural) with an overall accuracy of 76%. Links between perfusion metrics and expression of molecular features of GBM, including vascular endothelial growth factor A (primary inducer of angiogenesis and a vasodilator that increases microvascular permeability), which are thought to impact survival, have also been demonstrated. Thus researchers are beginning to extract the molecular underpinnings of elevated perfusion, improving our understanding of tumor biology, and drawing connections to malignant phenotypes that are associated with increased aggressiveness and shorter survival.
Guiding biopsy
Stereotactic biopsy is commonly used for histologic diagnosis in patients with brain masses. However, because of the common heterogeneity in brain tumors and reliance on contrast enhancement to guide biopsy targeting, sampling error remains a significant concern. BBB disruption responsible for contrast enhancement may not necessarily correspond to the highest-grade portion of a tumor ( Fig. 4 ). Undergrading is thought to occur in approximately 30% of cases because 30% of HGGs may not enhance and up to 30% of LGGs may enhance. Of particular concern are nonenhancing gliomas, which have a greater tendency to be malignant in older patients. Furthermore, despite the use of sophisticated methods to identify a brain lesion during stereotactic biopsy, neurosurgeons still have limited ability to visually confirm the position of their needle.

Given the well-known association between rCBV and glioma grade, DSC-MR imaging may provide improved guidance for biopsy target selection. Recent studies have proposed that regions of increased rCBV, serving as a marker of angiogenesis, may better indicate suitable targets for biopsy in patients with gliomas.
Predicting therapeutic efficacy
DSC-MR imaging may help predict the response to specific therapies before treatment initiation. For instance, rCBV has been investigated as a predictive marker for GBM in the setting of antiangiogenic therapy. Although patients with bevacizumab-treated GBM generally show little improvement in survival, bevacizumab therapy could have a substantial positive impact on a subset of patients.
Two small studies found that baseline rCBV correlates with OS in patients with bevacizumab-treated HGG. Another study that examined 2 sizable cohorts of patients with recurrent GBM, only one of which received bevacizumab, found that baseline rCBV stratified progression-free survival (PFS) and OS in the bevacizumab-treated cohort only, with predictive accuracies of 82% for 6-month PFS and 79% for OS. High baseline rCBV (>3.92) was associated with a halving of the median survival in comparison with low baseline rCBV (≤3.92), indicating that rCBV may be a predictive, rather than prognostic, marker of outcome for patients with bevacizumab-treated GBM. Biomarker accuracy for selecting GBM therapy is critical given the extremely limited treatment options in patients with progressive or recurrent disease. These results may improve the selection of targeted therapy before treatment initiation.
Assessing Response to Therapy
Very early response assessment
Cytotoxic therapies
DSC-MR imaging may also provide an early response marker of treatment efficacy. For instance, rCBV may be more valuable than enhancing tumor volume for evaluating patients after initiation of cytotoxic therapy, as a greater than 5% increase in rCBV reportedly portends poor OS when acquired 4 weeks after chemoradiation, whereas no such relationship between enhancing tumor volume and OS could be demonstrated.
Parametric response maps (PRM) reflecting voxelwise changes in rCBV 1 to 3 weeks after treatment seemed to successfully stratify survival in HGGs following standard chemoradiation therapy. Conversely, neither mean rCBV nor rCBF were found to be prognostic of survival. In fact, neither the percentage change of whole-tumor rCBV nor the segmentation into low, medium, and high rCBV generated statistically significant correlates of survival, whereas PRM applied to serial rCBV measurements at baseline and after 1 and 3 weeks of chemoradiation in GBM were predictive of 1-year survival.
Antiangiogenic therapies
Perfusion imaging, reflecting normalization of the vasculature, has also provided early markers of response to antiangiogenic therapy. However, linking these changes to patient outcomes has proved challenging, likely because the impact of antiangiogenic therapy on OS in patients with recurrent GBM is modest at best and patients, although initially responsive, may subsequently develop resistance to antiangiogenic therapy. A recent study did find an association between rCBV measured both 60 days before as well as 20 to 60 days after bevacizumab therapy and both PFS and OS in recurrent HGGs ( Fig. 5 ). Conversely, no such association could be demonstrated for volumes of either abnormal fluid-attenuated inversion recovery (FLAIR) signal or contrast enhancement. Another study found that when bias resulting from rCBV variability is minimized using a population-based rCBV atlas, volumes of both pre–bevacizumab and post–bevacizumab hypervascular rCBV can stratify PFS and OS in GBM, whereas traditional perfusion metrics including mean and maximum rCBV do not. Large decreases in rCBV on DSC-MR imaging acquired within 1 to 2 months of bevacizumab initiation were found to predict longer OS in patients with recurrent GBM ( Fig. 6 ). And a multicenter, randomized, phase II trial of bevacizumab with irinotecan or TMZ in GBM (American College of Radiology Imaging Network [ACRIN] 6677/Radiation Therapy Oncology Group [RTOG] 0625) found an association between increasing rCBV from baseline at 2 or 16 weeks after bevacizumab initiation and worse OS ( Fig. 7 ). Thus, perfusion may serve as an early marker of response to antiangiogenic agents, but this hypothesis awaits confirmation in prospectively designed well-controlled studies.

Distinguishing response from pseudoresponse and identifying nonenhancing tumor
Antiangiogenic therapy normalizes the BBB, diminishing GBCA extravasation and contrast enhancement. This can yield pseudoresponse, defined as decreased contrast enhancement independent of antitumor effect, which likely contributes to reported discordance between high response rates and prolonged PFS without improved OS in bevacizumab-treated GBM. Recent results have shown that patients with progressive enhancement of recurrent GBM after 2 or 4 antiangiogenic therapy cycles had significantly shorter OS than nonprogressives. However, no survival benefit was found for improved versus stable enhancement, likely because of pseudoresponse. Other studies have demonstrated similar shortcomings of conventional imaging, posing limitations for early response assessment and leading to inclusion of FLAIR-based measurement of nonenhancing tumor in modified response assessment criteria. Although progressive postbevacizumab FLAIR hyperintensity often represents nonenhancing tumor, persistent edema, postchemoradiation effects, and leukoaraiosis can have a similar appearance, reducing specificity. The ability of FLAIR to identify nonenhancing tumor and predict OS has been debated. Whereas some studies have found no survival prognostication with FLAIR, others have found the converse to be true.
Emerging evidence suggests that DSC-MR imaging may help predict relative treatment success shortly after initiation of antiangiogenic therapy. Significant differences in OS between patients with recurrent GBM with positive versus negative changes in tumor rCBV at 2, 4, or 16 weeks posttreatment initiation compared with baseline have been found (see Fig. 7 ; Fig. 8 ). However, several studies found that 8-week changes in rCBV were nonpredictive of OS. Therefore, the ability of post-therapy rCBV changes to predict OS may depend on the time at which posttreatment imaging is performed.
Related posts:
 New State-of-the-Art and Cutting-Edge Advances in Brain Tumor Imaging
 Multiparametric Imaging Analysis
 Imaging Genomics in Glioblastoma Multiforme
Perfusion Imaging in Neuro-Oncology
Shedding Light on the 2016 World Health Organization Classification of Tumors of the Central Nervous System in the Era of Radiomics and Radiogenomics
Adult Brain Tumors
Imaging Genomics in Glioblastoma Multiforme
Perfusion Imaging in Neuro-Oncology
Shedding Light on the 2016 World Health Organization Classification of Tumors of the Central Nervous System in the Era of Radiomics and Radiogenomics
Adult Brain Tumors
Stay updated, free articles. Join our Telegram channel

Full access? Get Clinical Tree


