Perfusion imaging is a method for assessing the flow of blood occurring at the tissue level and can be accomplished by both CT and MR perfusion techniques. The use of perfusion imaging has increased substantially in the past decade, particularly in neuro-oncologic imaging, where it is has been used for brain tumor grading and directing biopsies or targeted therapy, as well as for the evaluation of treatment response and disease progression. This article discusses the basic principles and techniques of perfusion imaging, as well as its applications in neuro-oncology.
Key points
- •
Perfusion imaging allows for assessment of changes occurring at the tumor microvasculature level.
- •
Perfusion-based parameters have the potential to serve as important quantitative imaging biomarkers, providing information not routinely available with standard morphologic imaging.
- •
Perfusion imaging is increasingly used for neuro-oncologic applications, including brain tumor grading, directing biopsies or targeted therapy, and evaluation of treatment response and disease progression.
- •
Perfusion-based quantitative biomarkers, when used in conjunction with standard morphologic imaging, have the potential to provide early indication of treatment failure or treatment response.
- •
Increased use of perfusion MR in the routine surveillance imaging of brain tumors allows for evaluation of relative cerebral blood volume (rCBV) trends, which may bolster its effectiveness as an imaging biomarker.
What is perfusion imaging?
Perfusion imaging is a method for assessing the flow of blood occurring at the tissue level. Depending on the modality (eg, MR, CT) and method (eg, dynamic contrast enhanced [DCE], arterial spin labeled) used, several perfusion parameters can be evaluated, both qualitatively and quantitatively. These parameters include those related to the volume of blood within a given region of tissue, as well as those describing the movement of blood through that region over time. In addition to assessing blood volume and flow, these techniques also allow for the quantitative assessment of vessel leakiness through the measurement of vascular permeability.
What is measured and how is it used?
Blood Volume and Blood Flow
Blood volume (BV), mean transit time (MTT), and blood flow (BF) are all parameters used to describe the flow of blood within a particular region of tissue.
- •
BV refers to the total volume of blood flowing within a given area of tissue and is measured in milliliters of blood per 100 g of tissue (mL/100 g).
- •
BF refers to the volume of blood flowing within a given area of tissue per unit time and is measured in milliliters of blood per 100 g of tissue per minute (mL/100 g/min).
- •
MTT refers to the average time blood takes to traverse through a given area of tissue and is measured in seconds (s).
Measuring the volume and flow of blood in a particular region of brain can have important clinical implications. In the setting of acute ischemia, measurement of CBV, MTT, and CBF helps in differentiating the “core” of irreversibly infarcted brain tissue from the ischemic, but potentially salvageable, brain tissue (ie, penumbra). Similarly, CBV has also been used successfully to identify patients with hemodynamic impairment in the setting of major arterial occlusive disease, as well as in evaluating cerebrovascular reserve in patients with Moya-Moya. In addition, assessment of CBV has been used extensively in neuro-oncologic applications, including for brain tumor grading and directing biopsies or targeted therapy, as well as for the evaluation of treatment response and disease progression. These neuro-oncologic applications of perfusion imaging are the focus of this article.
Vessel Permeability
In addition to parameters describing the volume and flow of blood within a particular region of brain, perfusion imaging also allows for assessment of vessel permeability. This is particularly important for applications involving the brain, given the role of the blood–brain barrier (BBB), which serves as a physical barrier to the entry of lipophobic substances into the brain and can be disrupted by a number of disease processes, including brain tumors. This breakdown of the BBB, which accounts for the contrast enhancement seen on standard imaging, also provides a potential surrogate imaging marker. Various methods have been developed to quantify this vessel “leakiness,” most notably by measurement of the permeability surface-area product (PS), which characterizes the diffusion of contrast agent from the blood vessels into the interstitial space, or by the transfer constant ( K trans ).
Methods
CT Perfusion
CT perfusion (CTP) allows for the assessment of CBV and permeability with a single acquisition. The greatest advantage of CT perfusion is the linear relationship between iodine concentration and attenuation on CT. This easy conversion allows for a direct measurement of vascular parameters.
CTP protocols vary depending on the manufacturer and scanner model used, as well as depending on the reason for the examination (eg, tumor volume protocol vs acute stroke imaging). However, as a general concept, CTP is based on the principle of sequential acquisition of CT images during the washin and washout of iodinated contrast material from brain parenchyma ( Fig. 1 ) with the goal being to observe the distribution of contrast agent within tissues over time.
How Is It Done?
- •
Before obtaining the perfusion scan, a low radiation dose noncontrast CT head study can be performed.
- •
For the perfusion scan at our institution, 50 mL of nonionic contrast is injected at a rate of 4 to 5 mL/s through an intravenous line using an automatic power injector.
- •
A cine scan is then initiated at 5 seconds into the injection, using the following parameters: 80 kV (peak), 100 to 120 mÅ, and 1 second per rotation for a duration of 50 seconds. After the initial 50-s cine scan, 8 additional axial images are acquired, 1 image every 15 seconds for an additional 2 minutes, resulting in a total acquisition time of 170 seconds to assess delayed permeability.
- •
Perfusion maps can then be obtained through the use of a number of commercially available software applications with the superior sagittal sinus generally used as the venous output function and the artery with the greatest peak and slope on the time–attenuation curves as the arterial input function.
MR Perfusion
The measurement of vascular parameters with MR perfusion can be accomplished with both contrast-enhanced and non–contrast-enhanced (arterial spin labeling [ASL]) techniques. Dynamic contrast-enhanced MRI utilizes 2 techniques—a T1-weighted acquisition (DCE MR) and a T2*-based acquisition (DSC MR). Although the methods used by these techniques in quantifying cerebral perfusion differ, both rely on a trace of contrast agent concentration over time to estimate blood volume and permeability. In contrast to these contrast-enhanced methods, evaluation of perfusion with ASL is accomplished through the use of magnetically labeled arterial blood water as a freely diffusible tracer.
In contrast with CT perfusion, which directly images the iodinated contrast agent, contrast agents utilized in MR perfusion are not imaged directly and instead rely on signal intensity to provide an estimate of CBV. However, regardless of the technique used, MR perfusion offers 2 major advantages over CT perfusion. First, MR perfusion requires no radiation, which is very important in oncologic imaging, because patients often require frequent imaging for tumor surveillance. Second, particularly in neuro-oncologic imaging, MR is the standard of care for assessing treatment response or progression of disease. Therefore, the acquisition of perfusion parameters with MR perfusion requires only additional sequences to be obtained rather than an entirely separate examination as in the case of CT perfusion.
Dynamic Contrast Enhanced-T1 Imaging
DCE-T1 imaging is based on the fact that an increase in the concentration of contrast agent results in a proportional increase in the rate of T1 relaxation from which a time–concentration curve can be generated and is tracked over a longer time period (5–10 minutes; Fig. 2 ).
DCE-T1 MR allows characterization of the vascular microenvironment through the measurement of a number of different parameters, including K trans (influx transfer constant), K b (reverse transfer constant), V e (volume of the extravascular extracellular space), and V P (blood plasma volume). The clinical application of these parameters, however, is often limited by the complicated, multicompartment physiologic models required to obtain the quantitative metrics. To improve the clinical utility, model-free “semiquantitative” indices have been developed to assess tissue perfusion. These methods have been used to both assess the shape of the uptake and washout of contrast (ie, curveology), as well as to provide objective indices for evaluation. These indices include maximum slope of enhancement in the initial vascular phase (MSIVP), which assesses change of signal intensity per second; normalized slope of the delayed equilibrium phase (nSDEP), which is the slope of the fitted linear curve to final 25% samples; as well as the initial area under the time–intensity curve (IAUC) at 60 and 120 seconds (IAUC 60 and IAUC 120 ).
How Is It Done?
- •
At our institution DCE-MRI studies are performed on a 3T MR system using a standard 8-channel phased array radiofrequency (RF) coil and receiver with the following sequence parameters: TE/TR ∼ 0.84/5.8 ms; flip angles, θi, of 2, 5, 10, 15, 20, and 25°; asset number = 2; matrix of 256 × 128; field of view, 240 mm; 16 slices of 5 mm; no gap.
- •
The precontrast T1 maps are used to establish baseline T1 values before the administration of contrast.
Dynamic Susceptibility Contrast T2* Imaging
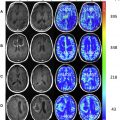
DSC-T2* MRI is based on rapid imaging of the first pass of gadolinium-based contrast material through the tumor vasculature and utilizes susceptibility weighted imaging to generate a time–concentration curve after contrast administration. The contrast agent results in an initial drop in signal intensity owing to the T2* shortening effects, which in turn leads to loss and then recovery of signal in the tumor bed as the agent is redistributed or diluted ( Fig. 3 ). This drop in signal intensity, also known as “negative enhancement,” is proportional to the concentration of the contrast agent. As such, the area under the time concentration curve can be calculated and used to derive the rCBV map, which is the most widely used quantitative variable derived from DSC imaging.
Because the bolus transit time for DSC-T2* imaging is so short, a fast acquisition technique, such as echo planar imaging (EPI) is typically performed, which provides the necessary temporal resolution to adequately characterize the transient drop in signal intensity. Although both spin echo (SE) and gradient echo (GRE) techniques are used, GRE is most commonly used because it has been shown to be more sensitive to broader ranges of vessel size, an important feature when evaluating the morphologically abnormal vessels commonly seen in tumors undergoing neovascularization. This finding is in contrast with the SE technique, which is more sensitive to capillary-sized vessels. The downside, of course, to the use of GRE DSC-MRI technique is its susceptibility to artifacts related to adjacent bony structures, air, or blood products, which is commonly encountered in the setting of brain tumors, particularly in the postoperative follow-up period.
In addition to these limitations related to susceptibility artifacts, DSC-T2* methods are also prone to errors related to contrast leakage, a common problem in high-grade gliomas owing to the leakiness of the BBB owing to significant neovascularization. The leakiness of the vessels, coupled with the use of low-molecular-weight extravascular contrast agents (eg, gadolinium-DTPA), results in rapid extravasation of contrast from the vascular compartment into the interstitium. This leakage results in both enhanced T1 relaxation effects, as well as increased or decreased T2* effects. These effects can either result in overestimation or underestimation of rCBV, depending on the relative magnitude of the T2* or T1 effects, respectively.
How Is It Done?
- •
At our institution, studies are performed on either a 1.5-T or 3-T MR system. Routine unenhanced MRIs are performed before the perfusion portion of the study.
- •
Perfusion images are performed during the injection of contrast agent, which is infused via a power injector at a constant rate of 5 mL/s.
- •
Perfusion images include the acquisition of a series of 95 phases of T2*-weighted GRE-EPI (repetition time ms/echo time ms, 1900/40; flip angle, 90°) with an acquisition matrix of 128 × 128 with a 26-cm field of view and 5-mm section thickness. The temporal resolution is 2.0 s. The number of sections obtained varies according to tumor size with the goal of including the entire tumor in the acquisition.
- •
T1-weighted contrast-enhanced images are then acquired after the perfusion study.
Arterial Spin Labeling
MR perfusion with ASL utilizes the magnetic labeling of arterial blood water through the use of an RF pulse. After this proton labeling, a period of time referred to as the postlabeling delay is necessary to give the labeled blood time to reach the brain parenchyma. In addition to the labeled images, all ASL techniques require the acquisition of control, or unlabeled, images. The signal remaining after subtraction of the labeled and control images can then be used to provide information regarding the CBF. Owing to the low signal-to-noise ratio between the labeled and control images, multiple control and label image pairs must be obtained.
Different methods are used for labeling arterial water, including continuous ASL (CASL), pseudo-continuous ASL (PCASL), pulsed ASL (PASL), and velocity-selective ASL methods. In CASL, a prolonged RF pulse continuously labels arterial blood water below the imaging slab. The major advantage of CASL compared with the other labeling methods is its higher perfusion sensitivity. The downside, however, to the prolonged RF pulse is 2-fold. First, the prolonged pulse lead to magnetization transfer effects that, if not appropriately balanced in the control acquisition, can lead to overestimation of perfusion. In addition, these prolonged RF pulses result in greater energy deposition to the patient, which can exceed US Food and Drug Administration guidelines. Finally, continuous RF transmit hardware is not available commonly on commercial MR scanners, which limits its widespread application in clinical practice. In contrast with CASL, PASL utilizes a short RF pulse to label a thick slab of arterial blood at a single point in time. There are various methods of PASL differing in the labeling plane location and magnetic state of the labeled blood; however, this is beyond the scope of this article. Whereas PASL offers a high labeling efficiency with lesser RF power deposition, its perfusion sensitivity is less when compared with CASL. The third technique to discuss briefly is PCASL, which mimics CASL through the use of a train of RF pulses in addition to a synchronous gradient field. PCASL offers high inversion efficiency, but with reduced magnetization transfer effects and RF power deposition when compared with CASL. Despite these advantages, however, PCASL is susceptible to both B0 inhomogeneity and eddy currents.
Finally, once the blood has been labeled appropriately, ASL imaging is performed typically using an EPI technique, allowing for a fast acquisition speed. Unfortunately, as with DSC-T2* perfusion images, EPI is also sensitive to susceptibility artifacts caused by adjacent bony structures, air, or blood products, which are frequently encountered, particularly in neuro-oncologic applications.
Aside from the advantages of the various labeling methods described, in general there are several advantages to using ASL versus other perfusion imaging methods. First, as with contrast-enhanced MR perfusion techniques, ASL requires no radiation and requires only an additional sequence to the standard of care surveillance MRI, which provides important advantages over CT perfusion. Second, contrary to the other perfusion methods described, ASL does not rely on the use of an exogenous tracer, such as iodinated contrast material or gadolinium-based contrast material as is required for CT perfusion and contrast-enhanced MR perfusion techniques, respectively. This is particularly advantageous in patients with chronic renal failure, given concerns regarding nephrogenic systemic fibrosis.
Related posts:
 New State-of-the-Art and Cutting-Edge Advances in Brain Tumor Imaging
 Dynamic Susceptibility Contrast MR Imaging in Glioma
 Response Assessment in Neuro-Oncology Criteria and Clinical Endpoints
Imaging Genomics in Glioblastoma Multiforme
Shedding Light on the 2016 World Health Organization Classification of Tumors of the Central Nervous System in the Era of Radiomics and Radiogenomics
Adult Brain Tumors
Response Assessment in Neuro-Oncology Criteria and Clinical Endpoints
Imaging Genomics in Glioblastoma Multiforme
Shedding Light on the 2016 World Health Organization Classification of Tumors of the Central Nervous System in the Era of Radiomics and Radiogenomics
Adult Brain Tumors
Stay updated, free articles. Join our Telegram channel

Full access? Get Clinical Tree


