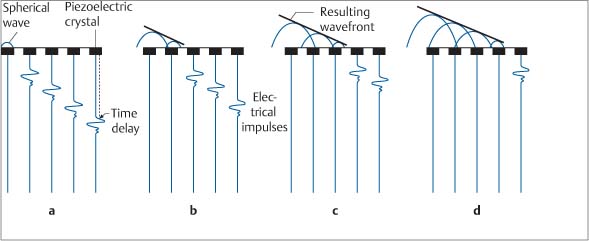
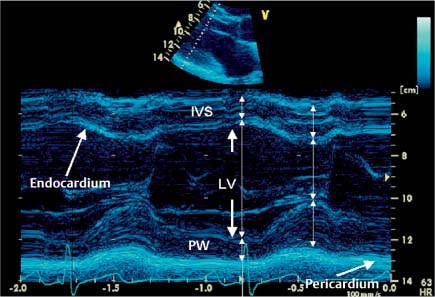
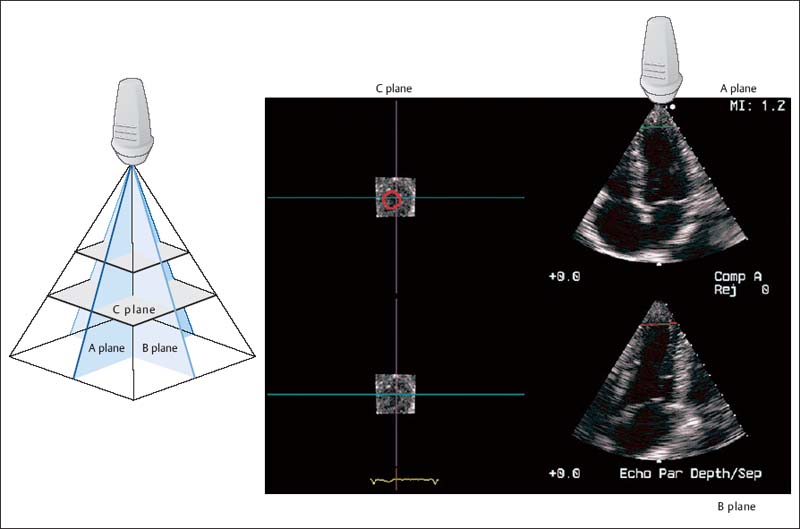
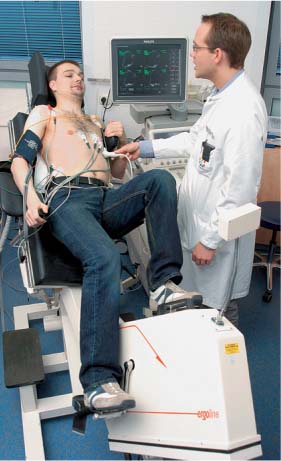
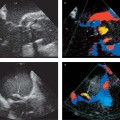
2 Echocardiography Echocardiography is a procedure in which the heart and surrounding vessels are examined with ultrasound. Ultrasound is a mechanical wave that requires a medium in which to propagate and is characterized by alternating compression and decompression of the medium. The audible range of ultrasound waves is from 8000 to 20 000 Hz (cycles per second). Ultrasound frequencies of 2–7 MHz, or sometimes as high as 45 MHz, are used in cardiac imaging. Piezoelectric crystals are used to produce ultrasound waves. These act by transforming electrical energy into mechanical energy and vice versa (Fig. 2.1). Ultrasound waves are reflected at interfaces. The reflection may be partial or complete, depending on the structure encountered by the waves. The greater the density difference between the interfaces, the greater the reflection. Because air reflects up to 99% of incident ultrasound waves, a medium must be used to couple the transducer to the body surface. Other factors that affect the amplitude of the reflected echo are the insonation angle, surface texture, and penetration depth. The deeper the structure is located, the greater the need to amplify the returning echoes. The higher the frequency of the sound, the less its penetration depth. Because of this depth relationship, transducers operating in the 2–4 MHz range are used in adults while 5- to 7-MHz transducers are preferred in children. Transducers are now available that can be operated over a variable frequency range of 2–7 MHz. The sound energy densities used in human patients are safe and do not pose a health risk. At present, phased-array transducers are used almost exclusively for echocardiography. This type of transducer provides up to a 90° sector angle with steering and focusing options within that range. The array consists of 64 to 256 piezoelectric crystals that can be individually excited with electrical impulses to generate ultrasound waves. The crystals then receive the reflected waves and covert them back into electrical signals. Time-delayed excitation of the crystals creates a broad ultrasound wavefront that can be steered by varying the time delays between successive excitations. Other technical means can be used to filter the ultrasound signals that are returned from a specific direction and from a specified depth. The ultrasound beam can be focused by applying excitation pulses to the outer crystals earlier than to the more central crystals. With advances in microtechnology, transducers have already been developed that can provide real-time 3D imaging based on the simultaneous excitation of 3000 separate elements with parallel processing of the signals. Parallel data processing has resulted in higher image frame rates for 2D and 3D echocardiography and for tissue Doppler echocardiography. Ultrasound waves may undergo multiple reflections between an interface and the transducer. If the first reflection is disregarded and the second or third reflected ultrasound signal (2nd or 3rd harmonic) is evaluated, it is possible to achieve better suppression of near-field signals and obtain a clearer image. This technique is particularly important for endocardial delineation and can be used with or without ultrasound contrast agents. The broadband scattering of ultrasound waves reflected at interfaces can also be evaluated. The cardiac-phase–dependent change in these scattered echoes has been used to differentiate viable ischemic tissue from scar tissue, to detect graft rejection, and to characterize cardiomyopathies. Reproducibility is poor, however. This technique, called integrated backscatter, is used in automated border detection and tracking during cardiac motion (“acoustic quantification,” “color kinesis”). Fig. 2.1 Two-dimensional echocardiography. Diagrams show the principle of electronic ultrasound scanning with a phased-array transducer. The ultrasound wavefront can be steered by applying electrical impulses to the crystals with a time delay. Distances can be determined in ultrasound images by assuming that ultrasound has a velocity of 1540 m/s in tissue. Most scanners emit ultrasound pulses 1μs long and receive the reflected ultrasound waves during the next 999μs, resulting in a pulse frequency of 1000 s−1. If ultrasound waves are continuously transmitted and received and the deflections are recorded over time, a motion-mode (M-mode) image is obtained. If numerous ultrasound pulses are transmitted and received with a phased-array transducer, a two-dimensional echocardiogram (2D image) is produced. The reflected sound waves returning to the transducer can be displayed on an oscilloscope in three forms: • A-mode: Amplitude display in which the intensity of the reflected ultrasound waves is displayed as a vertical deflection along a baseline. • B-mode: Reflected A-mode ultrasound signals are displayed as spots of varying brightness (bright mode) proportional to the intensity of the reflected ultrasound signal. • M-mode: The motion of the B-mode spots is displayed over time. The M-mode display is still used today, whereas A-mode imaging has fallen from use. The M-mode display has an extremely high temporal resolution that permits the tracking of interfacial echoes over time. One M-mode beam can be displayed in the 2D image (Fig. 2.2), and two M-mode beams can be displayed in some systems. To facilitate analysis, tissue depth is indicated in 1-cm increments on a vertical scale, while time calibration marks are spaced at half-second intervals along the M-mode scan. An ECG is recorded simultaneously with the M-mode trace to allow temporal correlation. A phonocardiogram is also recorded if necessary. A simultaneous respiratory curve is recorded to check for signs of tamponade, pericardial constriction, or restrictive cardiomyopathy. Concomitant pressure measurements are also useful for certain applications but are generally reserved for scientific studies. Fig. 2.2 2D-based M-mode recording. M-mode echocardiography includes a standard sweep from the aortic valve across the mitral valve to the apex of the left ventricle. M-mode traces are documented at specific, characteristic sites. Two-dimensional echocardiography allows a section of tissue to be imaged in real time, usually over a 90° sector. The typical frame rate is 25/s, but parallel image processing can achieve frame rates up to 100/s. Even higher rates can be obtained by narrowing the sector angle. Echocardiography has the highest temporal resolution of all clinical imaging modalities. Acoustic quantification employs the real-time detection of interfaces—in this case the boundary between the myocardium and its cavity—to quantify global and regional myocardial function. It permits the beat-by-beat tracking of cardiac wall motion. The addition of color encoding, called “color kinesis,” makes it possible to track the velocity of endocardial border motion by encoding both the direction and velocity of the motion. The frame rate is about 25/s. This method is particularly useful in stress echocardiography. Three-dimensional echocardiography has developed rapidly during the past 15 years. Today it is no longer restricted to off-line analysis but is available in real time, thanks to improvements in transducer geometry and parallel data processing (matrix array). The following methods are available in 3D echocardiography: • Offline reconstruction – External reference systems – Mechanical arm – Acoustic locator – Electromagnetic sensor – Internal reference system – Linear transducer motion – Sweep motion – Transducer rotation • Real-time 3D imaging Offline reconstruction has assumed special importance because it helps the cardiac surgeon in the preoperative planning of cardiac valve surgery. It can provide moving images of the heart that are otherwise unavailable to surgeons. The new matrix transducer (Fig. 2.3) contains 3000 individual crystal elements operating at 2–4 MHz. These elements are used for both the transmission and reception of signals to image the moving heart. Three-dimensional echocardiography is particularly useful for structure identification, the diagnosis of valvular disease and structural cardiac pathology, and the detection of ischemia during stress echocardiography. At present 3D echocardiography is still limited in its spatial and temporal resolution, but this is gradually improving with the development of faster computers and more powerful computer processors. In the future 3D data sets will be used in the planning and virtual testing of cardiac surgical procedures. Three-dimensional images also have training applications, as they can be used to simulate transducer positioning relative to the heart (www.sonocard.de). Miniaturization and digital technology have led to a decrease in the size of ultrasound systems and to the development of battery-powered instruments for portable use (Fig. 2.4). This type of instrument is called an ultrasound stethoscope because it is useful not only for physical examination and auscultation but also for bedside echocardiography. These systems have been expanded with capabilities that include transesophageal echocardiography (TEE). Ultrasound stethoscopes can already provide a prompt and accurate diagnosis of pericardial effusion, decreased ejection fraction, cardiac hypertrophy, and valvular diseases such as aortic and mitral stenosis. These findings can be an important aid to surgical planning; for example, permitting the fast and reliable detection of conditions such as right heart enlargement, a hyperdynamic circulatory state, and complications of acute myocardial infarction. Any lingering questions can be investigated later by a detailed transthoracic or transesophageal study of the heart. Fig. 2.3 Real-time 3D echocardiography. Matrix phased-array transducer insonates in three planes (A–C). Planes A and B are longitudinal, and the C planes are transverse. Fig. 2.4 Miniaturized ultrasound systems for bedside or ambulatory imaging (Optigo, Philips Sonoline, ViVid I GE). When an ultrasound beam encounters air, almost all of the sound is reflected at the air interface. For this reason, even the tiniest bubbles and cavitations in the blood or myocardium are visible in an ultrasound image. The ultrasound signal is enhanced, a property that is used mainly to amplify a weak Doppler signal. Any injection of saline solution, medications, or infusions may produce microbubbles that are detectable with ultrasound. Various methods are used to produce these contrast agents for echocardiography. Ultrasound contrast agents for the right heart: Saline. Saline solution (5–8 mL) is drawn into a 3-way stopcock and syringe system and mixed with 1 mL of air. The air–saline mixture can immediately be injected intravenously to accentuate ultrasound contrast in the right heart. Shunt flow is detected by noting microcavitation at the level of the interventricular or interatrial septum. Washout effects may be seen in the presence of a right-to-left shunt. Caution should be exercised when right–left shunts of the heart are present because of the problem of potential neurological side-effects. Gelatin solution (Gelifundol, Braun, Melsungen, Germany) gelatin solution prepared in house). This solution agitates better than saline, and it is unnecessary to draw air into the syringe. The residual air present in the 3-way stopcock is sufficient to produce dense opacification, which is confirmed when the clear, yellowish liquid turns cloudy. Only 0.5–1 mL of the solution must be injected to produce good contrast enhancement in the right heart. This method is widely utilized, has excellent reproducibility, and is nontoxic at the recommended dose. After five cardiac cycles, the solution may cause slight opacification of the left atrium after passing through the lung. Echovist 300 (Bayer-Schering AG, Berlin). Echovist is the only agent that is currently approved for contrast echocardiography of the right heart and pulmonary circulation. Good enhancement is obtained with the agent, which must be prepared strictly according to instructions provided. Other contrast agents. Other contrast agents, such as injected radiographic contrast agents, Cardiogreen, and infusion solutions can also produce echocadiographic contrast. Ultrasound contrast agents for the left heart: Levovist (Bayer-Healthcare Schering AG, Leverkusen, Germany). Contrast agents with extremely small microbubbles on the order of 4–8μm have been developed that will opacify the left heart following intravenous injection. The agent is supplied in an injection bottle in granular form. It is dissolved in 20 mL of water, shaken, drawn into a syringe, and injected into a peripheral vein. Optison (GE Healthcare, Amersham, UK). Optison is supplied in a bottle as a milky-white solution but was recently withdrawn from the market. Similar agents in current use are Sulfur hexafluoride, SonoVue (Bracco-Altana, Milan, Italy) and Perflutren, Luminity (Bristol-Myers Squibb, Medical Imaging, New York). New approaches that show promise in oncology are also being applied to cardiology. These include binding pharmacological agents to microbubbles and releasing them in the cardiovascular system by specific stimuli (e. g., shock waves or ultrasound), or using antibodies to bind agents to specific receptors in the heart identified by their contrast-enhanced effect. This may be done to detect endothelial dysfunction, fibrin deposition, thrombus formation, or allograft rejection as well as to provide a mechanism for local delivery of medication and for gene delivery as in antisense therapy. Resting myocardial perfusion in patients with coronary heart disease is not decreased until a stenosis has reduced the luminal diameter by more than 90%. Stress testing is used to induce a reduction of myocardial perfusion, which is possible when the stenosis is >75%. Stress echocardiography can be used for the detection of coronary artery disease, the localization of decreased blood flow, and the quantification of its effects. Stress echocardiography is also useful for risk stratification in coronary patients. The indications for stress echocardiography are the same as in nuclear medicine imaging. Stress echocardiography should always be done in clinically suspicious cases with a negative stress ECG, as its sensitivity is 85–90%, which is 20–25% higher than calculated for the stress ECG. Numerous stress protocols have been proposed and are based on the use of physical exercise or a pharmacologically induced increase of oxygen demand or perfusion heterogeneity. For exercise stress echocardiography (maximum increase in O2 consumption), it is advantageous to test the patient in a semi-sitting position (Fig. 2.5). The ECG and echocardiogram are recorded simultaneously, and the development of wall motion abnormalities can be detected at an early stage. The echocardiogram is not taken after the end of exercise (e. g., after treadmill exercise), because at this point an induced wall motion abnormality may quickly disappear (reversible ischemia) within few seconds (<60 s). A pharmacological stress can be induced by the infusion of dobutamine, with or without atropine, to raise the heart rate to a maximal level. Vasodilation can be induced with dipyridamole or adenosine to test for a coronary steal effect. While these methods are also popular in nuclear medicine studies, they appear to be inferior to other techniques. The goal is not to increase O2 consumption (as with dobutamine) but to induce a “steal effect” in which the heterogeneous blood flow will trigger wall motion abnormalities. In the resting state, autoregulation maintains coronary perfusion (which occurs mainly during diastole) within a constant range of 80–220 mmHg. The administration of dipyridamole or adenosine leads to a dilatation of the resistance vessels, the normal autoregulation is abolished, and a linear relationship can be found between pressure and perfusion (Fig. 2.6). The coronary flow reserve (CFR) is calculated by determining the ratio of the maximum flow increase to resting perfusion at a given pressure. Because the pressure remains constant after adenosine, the CRF can be calculated on the basis of the Doppler analysis of flow velocities. The lower normal tolerance value is 3.0, with a range from 4 to 6. When stress testing is done with dobutamine (Fig. 2.7), myocardial viability can also be assessed. Viable but ischemically compromised myocardium will show functional abnormalities at rest that improves with low-dose dobutamine and may decreases at higher dosages. The accuracy of dobutamine echocardiography for detecting viable myocardial function is in the range of 85–90%, comparable to that of positron emission tomography (PET), which is the “gold standard” for the detection of viability though its role may be taken over by magnetic resonance imaging. Digital imaging techniques are best for stress echocardiography, as they permit the simultaneous display of resting and stress results side by side and provide greater analytical accuracy. The use of contrast agents, especially in stress echocardiography, also helps to improve discrimination by improving endocardial border delineation. Fig. 2.5 Semi-sitting position for stress echocardiography with equipment for simultaneous ECG monitoring and echocardiography. Exercise stress is advantageous as it produces a maximum rise in O2 consumption. Fig. 2.6 Autoregulation of coronary perfusion. Constant conditions between 50 and 180 mmHg at rest (lower curve) versus linear relationship after dilation of the resistance vessels. A possible increase in the resting flow velocity or a fall in the maximum flow velocity will diminish the coronary flow reserve (CFR) between the curves for a given initial pressure. Fig. 2.7a–d Dobutamine stress. a Normal. b Ischemia. c Scar. d Viable myocardium. Fig. 2.8 Diagram showing the three standard scan planes used by TTE/TEE. Transgastric and transesophageal planes: four-chamber view, short axis, long axis. With the miniaturization of ultrasound transducers, flexible probes tipped with ultrasound crystals can now be introduced into the esophagus and stomach—orally or via the nose—to scan the heart and great vessels from various locations. The transducer can be rotated from a transverse to a longitudinal scan, rotating the imaging plane by up to 180°. Numerous transverse and longitudinal sections can be acquired in this way (Fig. 2.8). The angle setting is indicated on the monitor. The endoscope tip is freely deflectable in all three planes, making it possible to optimize contact with the mucosa and also optimize the Doppler signals. Owing to the small penetration depth and high transducer frequency, the TEE probe can provide exceptionally detailed views that are even useful for surgical decision making. The real-time 3D-capable probes further improve the application to TEE. The risk of TEE is less than that of other endoscopic procedures, since biopsy samples are not obtained. Generally no problems will arise when standard precautions are followed. The examination can be done with or without sedation (e. g., 2–10 mg midazolam) and is particularly easy to perform intraoperatively and in ventilated intensive-care patients. The tolerance of the probe is further improved when the nasal route is chosen. The main limiting factors are esophageal strictures, tumors, and diverticula. The transesophageal endoscope can be used in all situations where an endoscope can be introduced. TEE is appropriate in acute emergency situations, critically ill patients, and intraoperative imaging. The Swan–Ganz catheter is used less frequently since the advent of TEE. New insights have been gained into the pathophysiology of acute aortic syndrome, and new discoveries have been made regarding prosthetic valves, endocarditis, and pulmonary embolism. Transesophageal echocardiography has become a standard procedure in intensive care units. TEE is a useful aid for management in critically ill patients. Intraoperative ultrasound is also used to direct surgeons in valve reconstructions, endoscopic procedures, and congenital heart disease. Miniaturized endoscopes can also be passed transnasally. Pediatric probes are commonly used for this purpose. These probes can even be introduced at drainage sites to monitor cardiac function during the postoperative period and nowadays in neonates. Echocardiography can be performed intraoperatively using a transesophageal, an epicardial, or an epiaortic approach. Epicardial scanning is used mainly to detect diseases of the ascending aorta and may function as a “third eye” for the surgeon. An interesting innovation is postoperative subcostal ultrasound using a drain for probe access. Ultrasound catheters with a built-in single mechanical rotating element (9 MHz, 9 Fr catheter) or phased-array transducer (5.5–10 MHz, 10 Fr catheter) are available for intracardiac and intravascular echocardiography. The phased-array probe can in addition provide flow information. The transducers have a resolution of 100–150 m. Ultrasound catheters are introduced over guidewires. Especially promising is a new 8 Fr catheter with a linear transducer array for longitudinal scanning of the heart and vessels. Because the catheter itself is steerable in three planes, it can provide detailed, high-resolution information. The new intravascular ultrasound probe allows flexible steering in all directions (Fig. 2.9), eliminating the need for a guidewire. The aorta can be imaged by scanning from the inferior or superior vena cava, or the probe can be advanced into the aorta itself. This device is particularly useful for directing interventional procedures with less radiation exposure, such as repairs of atrial septal defects and patent foramen ovale, intra-aortic fenestration, and intra-aortic or intracardiac biopsy. Transseptal puncture is also facilitated by intracardiac echocardiography. The disadvantages of TEE for such applications as imaging of the ascending aorta are not found for intracardial ultrasound. Fig. 2.9 Diagram showing the almost limitless scanning options available with catheter-based intracardiac ultrasound. An optimal transthoracic echocardiographic examination requires imaging in the left lateral decubitus position, as this moves the heart closer to the chest wall and gives better access for scanning the parasternal and apical planes. The supine position is best for suprasternal and subcostal echocardiograms. From each transducer position, longitudinal and transverse views are obtained by angulation and rotation of the transducer (Fig. 2.10). The gray-scale and gain settings should be optimized to obtain the best delineation of interfaces, which is provided in newer systems automatically. Images are acquired at end-expiration with simultaneous ECG monitoring. 2D echocardiography also directs the orientation of M-mode echocardiograms as well as Doppler and color Doppler imaging. The preparations for TEE are the same as for gastroscopy. The patient should be fasting for at least 4 hours and receives local pharyngeal anesthesia. Sedation with midazolam, propofol, or a similar agent is recommended. An IV line is placed and heart rate, blood pressure, and oxygen saturation are continuously monitored. The ultrasound probe is fitted with a bite block to prevent probe damage. A rubber sleeve provides electrical isolation and prevents infections. The echo probes must be stored under sterile conditions. The procedure should be explained to the patient and informed consent should be obtained on the previous day, but the examination can be done immediately in an emergency situation. After the echo probe has been passed into the esophagus, it is first advanced to the gastric level to obtain transverse and longitudinal scans of the left ventricle and right ventricle. It is then drawn back into the esophagus and maneuvered in transverse and longitudinal planes to identify the superior and inferior vena cava and the coronary sinus. Next the operator scans the right atrium and right atrial appendage as well as the tricuspid valve and right ventricle. A longitudinal section displays the right ventricular outflow tract with the pulmonary valve and main pulmonary trunk. The pulmonary veins are located first in transverse and then in longitudinal sections, and the left atrial appendage is identified. Next the mitral valve and left ventricular inflow tract are imaged in transverse and longitudinal planes, followed by the left ventricular outflow tract and the aortic valve. The probe is withdrawn further to image the ascending aorta, the origin of the coronary arteries, the main pulmonary artery trunk, and the right pulmonary artery. It is more difficult to image the left pulmonary artery and right pulmonary veins owing to the interposition of the trachea and left main bronchus. Fig. 2.10a, b Standard longitudinal and transverse planes for scanning the heart and great vessels from parasternal and apical transducer positions. Rotating the probe to scan behind the heart brings the descending thoracic aorta into view. That vessel is surveyed in a series of transverse and longitudinal sections (measured in centimeters aboral distance) from the stomach to the aortic arch, scanning as far as the origin of the subclavian artery. The ascending part of the aortic arch is a “blind spot” not accessible to transesophageal scanning owing to interposition of the trachea. Echocardiography is a technique that can yield not only qualitative information but also quantitative data related to dimensions and temporal relationships. Two-dimensional echocardiography provides spatial orientation and guidance for orthogonal scan alignment that avoids erroneous measurements based on tangential planes of section. The reference values for M-mode echocardiography are listed in Table 2.1. Despite the availability of 3D echocardiography, M-mode echocardiography is still the most widely used technique for the determination of left ventricular muscle mass, both clinically and in research studies. The diastolic diameter of the left ventricle measured in the short-axis view provides the basis for calculating the LV volume and LV myocardial mass. Volume (V) of the left ventricle: V = (π/6)L × D2 Assuming that the ventricle has an ellipsoidal shape with L = 2D and taking the value of π/6 as 1.047, we can simplify the formula to: V = 1.047 × D3 By adding the thickness of the posterior wall and interventricular septum (TPW, TIVS), we can calculate the total muscle volume of the left ventricle (Fig. 2.11). The ventricular volume can be subtracted from the total volume to obtain the LV muscle mass: Myocardial volume = 1.047 (D + TPW + TIVS) 3 − D3−13.6/m2 BSA LV mass (grams) = (1.04 × myocardial volume) × 0.8 + 0.6 where 1.04 g/mL is the specific gravity of the myocardium and 0.8 is the correction factor. Normal values for the left ventricular muscle mass: • < 134 g/m2 in males • < 110 g/m2 in females
Basic Principles of Echocardiography
 Essential Point
 Essential Point
Basic Principles of Ultrasound Imaging
Types of Echocardiography
M-Mode Echocardiography
Two-Dimensional Echocardiography
Acoustic Quantification and Color Kinesis
Three-Dimensional Echocardiography
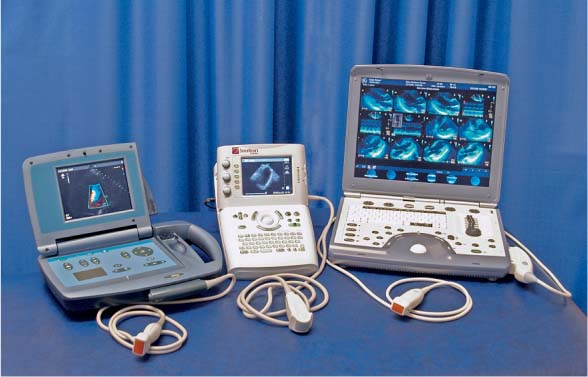
Ultrasound Stethoscope
Specific Applications of Echocardiography
Contrast Echocardiography
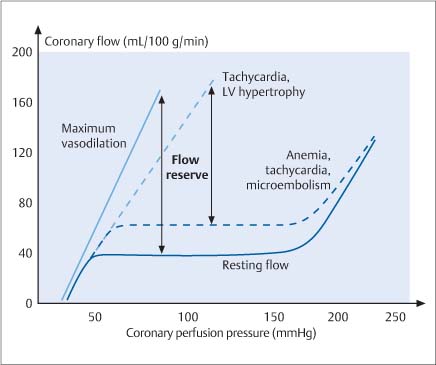
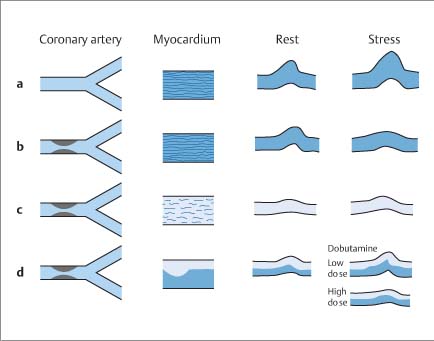
Stress Echocardiography
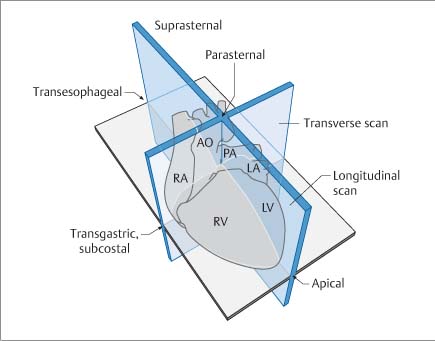
Transesophageal Echocardiography
Intraoperative Echocardiography
Intracardiac Echocardiography
Examination Techniques
Transthoracic Echocardiography
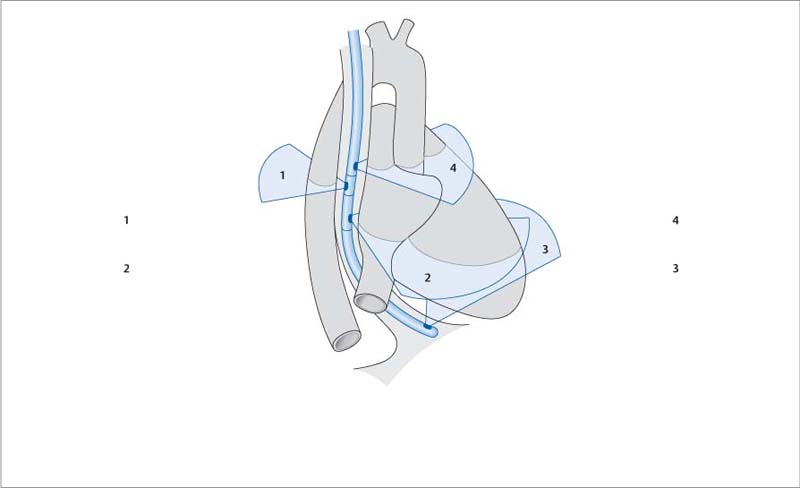
Transesophageal Echocardiography
Quantification Using M-Mode and 2D Echocardiography
M-Mode Echocardiography
| Males | Females |
Aortic root (mm) | 26 – 36 | 23 – 34 |
Left atrium (mm) | 30 – 40 | 26 – 38 |
Right ventricle (mm) | < 30 | < 30 |
Left ventricle (mm) | ||
• End diastole • End systole • Fractional shortening | • 47 – 58 • 28 – 37 • > 25% | • 43 – 55 • 28 – 40 • > 25% |
Interventricular septum (mm) | 8 – 12 | 7 – 12 |
• Systolic wall thickening | • > 30% | • > 30% |
Posterior wall (mm) | 7 – 12 | 6 – 11 |
• Systolic wall thickening | • > 30% | • > 30% |
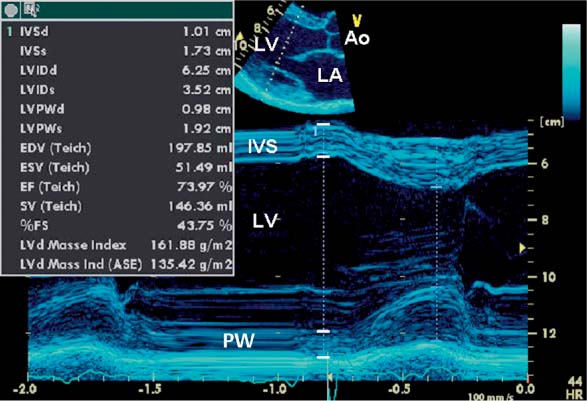
Fig. 2.11 M-mode echocardiogram of the left ventricle. The bars indicates the borders used in the Penn method of calculating LV muscle mass. This method is based on the thickness of the ventricular septum and posterior wall. It excludes the endocardial and pericardial echo thicknesses, which are included in diameter measurements for the calculation of LV volume.
Teich = Teichholz formula,
ASE = American Society of Echocardiography,
IVS = intervertricular septon,
LVID = left ventricular diameter,
LVPW = LV Posterior Wall,
EDV = end-diastolic volume,
ESV = end-systolic volume,
SV = stroke volume,
FS = fractional shortening,
d = diastole,
s = systole.
Two-Dimensional Echocardiography
Two-dimensional echocardiography is a routine tool in cardiac testing. Diameters can be precisely determined (Figs. 2.10, 2.12) and fractional shortening can be calculated, especially when the endocardium is optimally delineated in plain images or after contrast administration.
It is important to note that in many cases an apical transducer position will not insonate the cardiac apex, but will scan a site above the anatomical apex at the level of the left ventricular outflow tract (Fig. 2.13). This results in tangential scan planes that tend to underestimate volume and overestimate the myocardial muscle mass.
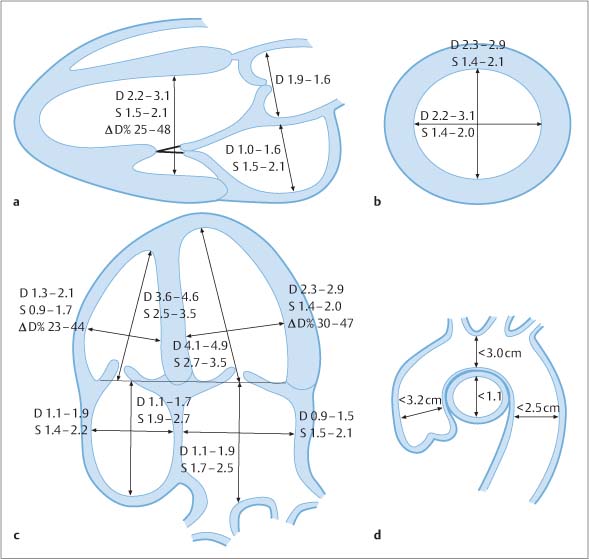
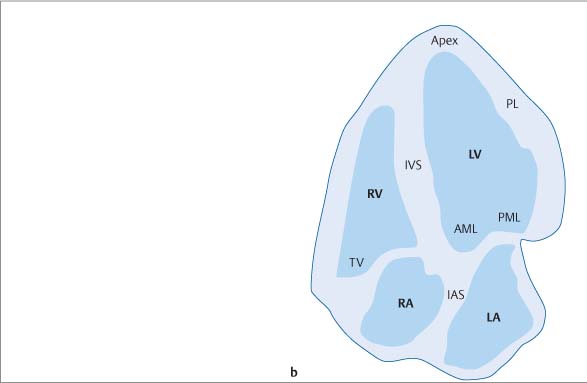
Fig. 2.12a–d Determination of cardiac and aortic diameters (cm2) in various scan planes. Values given corrected for body surface area (m2).
Volume of the Left Ventricle
The mathematical model for volume calculation is an ellipsoid of revolution. The volume of the left ventricle is best determined using the disk summation method in one or two planes in order to calculate the volume of an ellipsoid of revolution. This is also called the “modified Simpson method” in the literature, although there is no mathematical connection with Simpson’s rule for volume determination using a summation of trapezoids. In the disk summation method (Fig. 2.14), the cross-sectional area of the ventricle is determined in one or more planes and its volume is calculated from the thickness of the disks. The more disks are used, the more accurate the volume determination. The biplanar method is superior to the single-plane method. Each ventricle should be divided into at least 12 transverse disks.
The area–length method is less accurate than the disk summation method. The ellipsoid method is even less accurate.
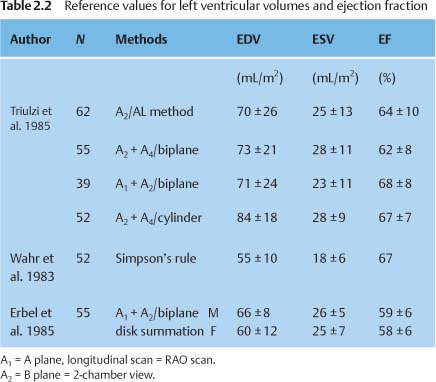
Table. 2.2 lists the reference values and normal limits for left ventricular volume determination based on 2D echocardiography.
Volume of the Right Ventricle
Right ventricular volume is more difficult to determine because the right ventricle is not a rotational ellipsoid but a somewhat flattened, shell-shaped structure that abuts the left ventricle. The biplane disk summation method is often used in the literature but is imprecise. A new type of calculation is the subtraction method, in which the total volume of the left and right ventricles including the interventricular septum (IVS) is determined, and the volume of the left ventricle and IVS is subtracted from the whole.:
RV= (LV + IVS + RV) – (LV + IVS)
Three-dimensional echocardiography has helped to reduce the problem of geometry in the determination of left and right ventricular volumes, but does not eliminate the fundamental problem of the underestimation of ventricular volumes.
Volume of the Left Atrium
The determination of left atrial (LA) volume has proved particularly important in recent years, as the LA volume has been identified as a risk factor for atrial fibrillation and cardiovascular morbidity and mortality. It is not enough to determine the diameter alone, as this underestimates the longitudinal extent of the atrium. The disk summation method and the area–length method can both be used (Fig. 2.15) in order to take into account the 3D structure of the left atrium. Additionally, an ellipsoid method has been published that does not require contouring of the atrium:
VLA = (π/6) × D × L × S
where D is the diameter of the left atrium in the parasternal M-mode view, L is the longitudinal dimension of the atrium in the four-chamber view, and S is the transverse dimension in the apical long-axis view.
Three-dimensional echocardiography can also be used for the determination of left atrial volume.
Normal value: < 30 mL/m2 BSA.
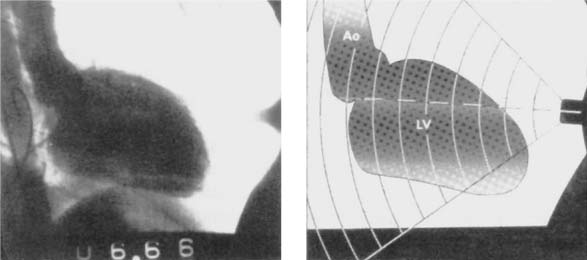
Fig. 2.13 LV angiogram illustrates the transducer position for apical long-axis scanning of the heart, resulting in a tangential plane of section (right panel).
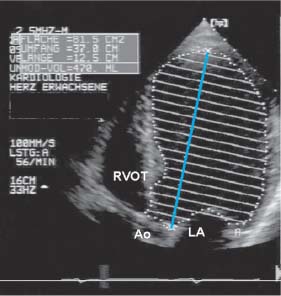
Fig. 2.14 Illustration of the method of disks (disk summation method) for determining left ventricular volume.
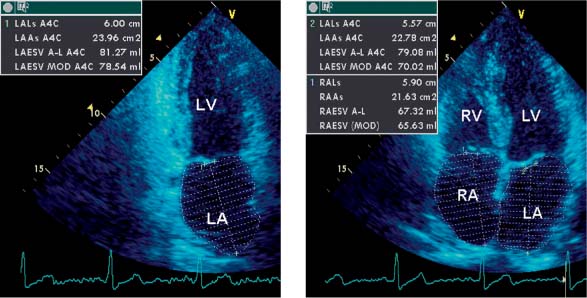
Fig. 2.15 Illustration of left and right atrial volume determination at end systole.
Principles of Doppler Echocardiography
Doppler echocardiography is based on the principle of the phase shift that occurs in ultrasound waves that encounter a moving object. The degree of the phase shift depends on the velocity of the moving object and is directly proportional to it. If the object is moving toward the transducer, the ultrasound signals move closer together; if it is moving away from the transducer, the signals are spaced farther apart.
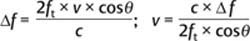
where Δf is the Doppler frequency shift, ft is the transducer frequency, v is the velocity of the moving object, cos is the angle between the ultrasound beam and the direction of object motion, and c is the sound velocity in tissue.
If the measured Doppler velocity exceeds a certain value called the Nyquist limit, an apparent reversal of velocity occurs that is visible in the frequency spectrum. This means that an attempt should be made to find an optimum position for the transducer, which should have the lowest possible operating frequency and should be placed as close to the object as possible.
Related posts:
Stay updated, free articles. Join our Telegram channel

Full access? Get Clinical Tree


