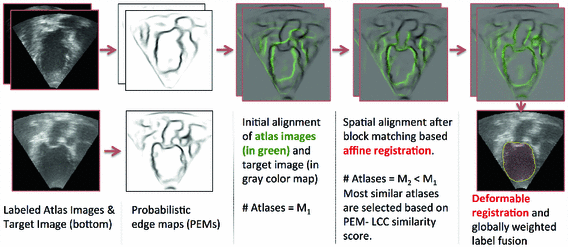
Fig. 1.
(a) 3D cardiac US image, (b) phase congruency [13], and (c) PEM which captures missing structures (orange arrows) and provides smoother edge response (green arrows). In (d) SDF training is illustrated, where the label patches ( ) are clustered at each node split, and the weak learners (
 ) search for the optimal threshold value (
 ) and feature (
 ) to separate the two clusters (Color figure online).
) are clustered at each node split, and the weak learners () search for the optimal threshold value () and feature () to separate the two clusters (Color figure online).In the tree structure of SDF, the output space ( ) is assumed to be structured. In our case, this means that the output labels (
 ) of size
  represent the edge labelling for image patches. In general, any type of multi-dimensional output can be stored at each tree leaf node, as long as labels can be clustered into two or more subsets by determining the optimal splitting function (
 ) at each tree branch, as shown in Fig. 1(d). In the PEM classifier training, this is achieved by mapping each image patch label to an intermediate space (
 ) where label clusters can be generated based on the Euclidean distance in
  (cf. [6]). Similar to decision forests, SDFs operate on standard input feature space which is defined by the high dimensional appearance features (
 ) extracted from image patches of fixed size
  . These features are computed in a multi-scale fashion and correspond to image intensities, gradient magnitudes, soft-binning based histogram of oriented gradients, and local phase features. Weak classifiers
  , e.g., 1D and 2D decision stumps, are trained by maximizing the entropy based information gain criterion at each tree node with one of the selected image features. The parameter vector
  contains the stump threshold value and selected feature identifier. At testing time, each target image voxel is voted for
  times by
  number of trees and these votes are aggregated by averaging all the predictions. Multiple and overlapping patch label predictions are the main advantage of PEMs, as these result in smooth, regularized and complete delineations of the cardiac chambers.
) is assumed to be structured. In our case, this means that the output labels () of size represent the edge labelling for image patches. In general, any type of multi-dimensional output can be stored at each tree leaf node, as long as labels can be clustered into two or more subsets by determining the optimal splitting function () at each tree branch, as shown in Fig. 1(d). In the PEM classifier training, this is achieved by mapping each image patch label to an intermediate space () where label clusters can be generated based on the Euclidean distance in (cf. [6]). Similar to decision forests, SDFs operate on standard input feature space which is defined by the high dimensional appearance features () extracted from image patches of fixed size . These features are computed in a multi-scale fashion and correspond to image intensities, gradient magnitudes, soft-binning based histogram of oriented gradients, and local phase features. Weak classifiers , e.g., 1D and 2D decision stumps, are trained by maximizing the entropy based information gain criterion at each tree node with one of the selected image features. The parameter vector contains the stump threshold value and selected feature identifier. At testing time, each target image voxel is voted for times by number of trees and these votes are aggregated by averaging all the predictions. Multiple and overlapping patch label predictions are the main advantage of PEMs, as these result in smooth, regularized and complete delineations of the cardiac chambers.2.2 Multi-atlas Left Ventricle Segmentation
Next, we detail our proposed multi-atlas LV segmentation framework as outlined in Fig. 2, employing the generated edge maps. Initial affine alignment, atlas selection and deformable registration between target (I) and atlas images ( ) are performed based on the PEMs (
 ,
,  ) generated from the US images. A dataset consisting of a number of manually annotated US images is used in the atlas formation. The annotations for these atlases contain only the LV endocardial labels. The composite spatial transformations transfer the atlas labels to the target, followed by a globally weighted label fusion based on PEM similarity.
) are performed based on the PEMs (, ) generated from the US images. A dataset consisting of a number of manually annotated US images is used in the atlas formation. The annotations for these atlases contain only the LV endocardial labels. The composite spatial transformations transfer the atlas labels to the target, followed by a globally weighted label fusion based on PEM similarity.Fig. 2.
A block diagram of the proposed multi-atlas segmentation framework.
Global Alignment: The PEMs from both target image and atlases are first aligned using a block matching technique [11] which maximizes the normalized correlation coefficient between image blocks. The set of vectors defined by the displacement of each block is regularized before finding the global affine transformation  . A least trimmed squared regression based regularization (cf. [11]) removes the influence of displacements for the atlas blocks which have no target block correspondence due to missing features in the images. For this reason, this approach is robust to shadowing and anatomical variations and can provide an accurate spatial alignment for atlas selection and good initial segmentation.
. A least trimmed squared regression based regularization (cf. [11]) removes the influence of displacements for the atlas blocks which have no target block correspondence due to missing features in the images. For this reason, this approach is robust to shadowing and anatomical variations and can provide an accurate spatial alignment for atlas selection and good initial segmentation.Atlas Selection: It was shown in multi-atlas brain segmentation [1], that a selection of most similar atlases is beneficial. Therefore, after affine registration, all  atlases are ranked according to their average local correlation coefficient [5] score,
 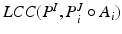 , and the
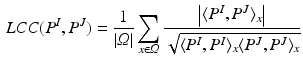
  top scoring atlases in the upper quartile are selected. The LCC similarity metric is defined in (1), where
  denotes the target voxels within a region defined by the dilated LV mask.
A Gaussian window  with variance
  locally weights the PEMs and
![$$= G_\sigma *(P^I.P^J)[x] - (G_\sigma *P^I)[x] (G_\sigma *P^J)[x]$$](/wp-content/uploads/2016/09/A339585_1_En_26_Chapter_IEq28.gif) , where . denotes the Hadamard product, and
, where . denotes the Hadamard product, and  the convolution. As the SDF classifier makes use of image intensities in node splits
  , local intensity changes in the input images can influence the edge probabilities in PEMs. For this reason, LCC is a more suitable similarity measure for PEMs than global metrics such as sum of squared differences.
atlases are ranked according to their average local correlation coefficient [5] score, , and the top scoring atlases in the upper quartile are selected. The LCC similarity metric is defined in (1), where denotes the target voxels within a region defined by the dilated LV mask.(1)
with variance locally weights the PEMs and , where . denotes the Hadamard product, and the convolution. As the SDF classifier makes use of image intensities in node splits , local intensity changes in the input images can influence the edge probabilities in PEMs. For this reason, LCC is a more suitable similarity measure for PEMs than global metrics such as sum of squared differences.Local Alignment: To correct for residual misalignment, a registration based on free-form deformations (FFDs) [14] follows the atlas selection. The total energy 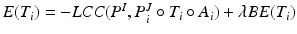 is minimised in a multi-resolution scheme, where BE is the bending energy of the cubic B-spline FFD
  and
and  defines the trade-off between local PEM alignment and deformation smoothness.
is minimised in a multi-resolution scheme, where BE is the bending energy of the cubic B-spline FFD and defines the trade-off between local PEM alignment and deformation smoothness.Label Fusion: Finally, the transferred atlas labels are fused using a globally weighted voting1 [2] based on the dissimilarity  . The LV segmentation of the target image is then given by the labelling function
  , where
  is the Dirac delta function and global weights
  . In this fusion strategy, atlases more similar (higher LCC score) to the target image have a stronger influence on the final segmentation and those with a relatively lower score are downgraded.
. The LV segmentation of the target image is then given by the labelling function , where is the Dirac delta function and global weights . In this fusion strategy, atlases more similar (higher LCC score) to the target image have a stronger influence on the final segmentation and those with a relatively lower score are downgraded.3 Algorithm Evaluation
The proposed segmentation framework is evaluated on a benchmark dataset used in the MICCAI 2014 CETUS challenge [12]. It consists of 4D echo sequences acquired from an apical window in healthy volunteers and patients with myocardial infarction and dilative cardiomyopathy. The dataset is divided into 15 training and 30 testing image sequences. Contours of the heart chambers were outlined by three experts, but only those of the training set are publicly available. Therefore, the CETUS web site2 is used for evaluation. Submissions are automatically evaluated based on surface distance errors and clinical LV volumetric indices.
In all experiments, segmentations are computed only for end-diastolic (ED) and end-systolic (ES) phases. Table 1 lists the surface distance errors obtained in the first experiment. The proposed PEM-MA framework achieves better results than the challenge top performing algorithms: AAM [15] (active appearance model), BEAS [3, 4] (B-spline active contours), SDF-LS (structured decision forest followed by level-set segmentation), and SE-MA [10] (spectral embedding multi-atlas method). The inter-observer manual segmentation [12] variations are reported for comparison. We can conclude that PEMs provide a better boundary representation than spectral features [10] based on mean ( ) and Hausdorff distance (
 ). Moreover, the proposed approach does not require landmark selection [10] or manual affine alignment of LV surface template to initialize the segmentation [7].
) and Hausdorff distance (). Moreover, the proposed approach does not require landmark selection [10] or manual affine alignment of LV surface template to initialize the segmentation [7].Table 1.
 Motion Estimation Using Ultrafast Ultrasound Imaging Tested in a Finite Element Model of Cardiac Mechanics
 Recognition in Cardiac CT Images
 Anisotropic Myocardial Stiffness from Magnetic Resonance Elastography: A Simulation Study
 Feature Learning for Myocardial Segmentation of CP-BOLD MRI
 Biomechanical Modeling of Cardiac Amyloidosis – A Case Study
 of the Electrocardiography Inverse Solution to the Torso Conductivity Uncertainties


LV segmentation results on 30 subjects (CETUS challenge testing dataset [12]). Mean distance (MD [mm]), Hausdorff distance (HD [mm]) and Dice coefficient (DC [%]) results are listed separately for ED and ES frames.
Related posts:
Motion Estimation Using Ultrafast Ultrasound Imaging Tested in a Finite Element Model of Cardiac Mechanics
Anisotropic Myocardial Stiffness from Magnetic Resonance Elastography: A Simulation Study
Biomechanical Modeling of Cardiac Amyloidosis – A Case Study
Stay updated, free articles. Join our Telegram channel
Full access? Get Clinical Tree
