Overview of Breast Elastography
Elastography should be performed in conjunction with conventional breast ultrasound. It is an additional imaging mode, like color Doppler, to evaluate a breast lesion or nonmass lesion. At this time, elastography cannot be used as a screening technique, but it is an excellent diagnostic technique to characterize a lesion as benign or malignant. Both SE and SWE are FDA approved for determining if a lesion is soft or stiff. Both SE and SWE have been shown to improve characterization of breast abnormalities.10,12,15,16,17,18,19,20,21,22,23,24 The choice of which to use is a personal preference and is often influenced by experience or equipment availability. Both techniques, SE and SWE, can be performed on an abnormality within a few minutes and can increase confidence of the results if they are concordant. If the results are not concordant, it can be an alert that the lesion is atypical and additional evaluation may be necessary to further characterize it.
Elastography can also be helpful in characterizing isoechoic lesions. If a palpable lesion is not identified on B-mode imaging, the use of elastography can often identify the lesion based on its stiffness. It is not uncommon for it to be difficult to determine if an isoechoic lesion is truly an abnormality or a fat lobule.
It has been suggested that the main advantage of elastography could be improved characterization of BI-RADS category 3 and category 4A lesions. Elastography could be used to upgrade or downgrade these lesions by one BI-RADS score. As elastography continues to improve and more clinical experience is gained, a better understanding of how elastography could be included in the BI-RADS classification will be obtained. Guidelines have been recommended by several organizations.25,26
We have used elastography on all our diagnostic breast ultrasound cases for several years and as a research tool for 15 years. In our experience, we have significantly decreased our biopsy rate and significantly increased our positive biopsy rate. The bull’s eye artifact has been extremely helpful in increasing confidence that a lesion is a benign complicated cyst and that short-term follow-up or biopsy is not required.27 Correlation of elastography with pathology has added an additional check for adequacy of our image-guided biopsies.
There are many methods of displaying the elastographic data. Several color scales have been used. In this book we will use the convention of black is stiff and white is soft for SE and red is stiff and blue is soft for SWE. We use the color image in SWE because it depicts the quantitative value of the stiffness and therefore any lesion that is stiff enough to color-code, (i.e., that is above our cutoff value) is easy to identify. We use a grayscale image in SE because we believe we can identify the changes in relative stiffness more accurately than when we use a color image, in which a small change in relative stiffness may be depicted as an abrupt color change. We also believe we are able to measure a lesion more accurately on the elastogram using the grayscale.
5.3 Strain Elastography Imaging
5.3.1 Techniques
The technique of monitoring how a lesion changes shape when an external force is applied is SE. The external force can be patient movement, such as breathing and heartbeat, from ARFI, or from external compression with rhythmic motion of the transducer.10 In SE the absolute strain value (stiffness) cannot be calculated because the amount of the displacement force cannot be accurately measured. The real-time elasticity image, with a scale based on the relative strain of the tissues in the image, illustrates the strain distribution, indicating the relative stiffness of the tissues. The clinical implications of this are discussed in detail 5.3.8 Interpretation of Results.
An ultrasound pulse (a push pulse) tailored for energy transfer can be used as the source of the displacement. This technique is called acoustic radiation force impulse (ARFI).28,29 Using ARFI and analyzing the displacement shape changes, a strain image can be obtained. Note that this is different than shear wave imaging where the shear wave speed generated from the pulse is measured.10
SE of the breast is performed with a conventional ultrasound unit and standard ultrasound breast transducer. Specific software analysis of frame-to-frame difference in deformation in tissue with mild compression allows for the display of the “softness” or “stiffness” of a lesion.
The technique required to obtain the optimal images varies with the type of elasticity imaging being used as well as the manufacturer of the system. With some manufacturer’s systems, very little if any manual compression is needed; with others, a rhythmic compression–release cycle is required. With experience and practice, one can optimize the compression used to obtain optimal image quality.
The algorithm used in compression elastography requires the strain changes to remain within the imaging plane. The same slice of the lesion needs to remain in the imaging plane during the compression–release cycle. Monitoring of the B-mode image to confirm the same slice of the lesion is only displaced in depth during scanning and otherwise is unmoving in the FOV will allow for optimal images. To avoid having the lesion move in and out of the imaging plane, positioning the patient so that an imaginary line through the transducer and lesion is perpendicular to the floor, with patient breathing moving the lesion in the same plane, is helpful (▶ Fig. 5.1). The transducer should not be angled either superiorly or inferiorly or to the right or left (▶ Fig. 5.2). Using SE one cannot be surveying the breast; scanning must be done in one stationary position.
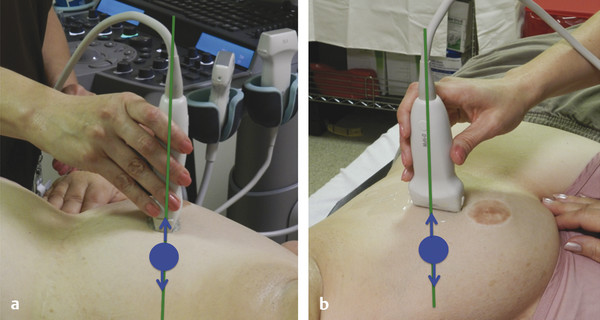
Fig. 5.1 (a, b)For optimal elastography results, the patient should be positioned so that the transducer is perpendicular to the table and the patient rolled so that the area of interest moves within the imaging plane during patient respiration. The green line corresponds to the imaging plane. The lesion (blue circle) should move within the imaging plane (arrows).
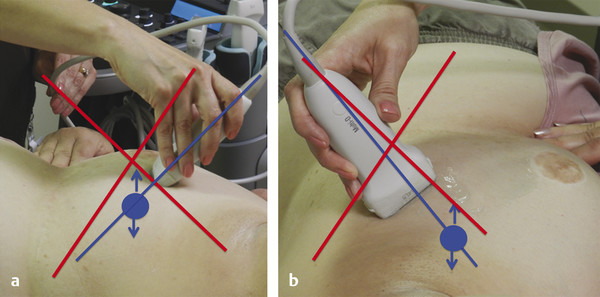
Fig. 5.2 Suboptimal elastography results will be obtained if the transducer is angled. (a) The blue line corresponds to the imaging plane. The lesion (blue circle) is moving in and out of the imaging plane because the transducer is angled superiorly (angling inferiorly would also be suboptimal). (b) The blue line corresponds to the imaging plane. The lesion (blue circle) is moving in and out of the imaging plane because the transducer is angled to the left (angling to the right would also be suboptimal).
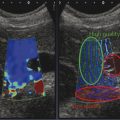
In most systems a dual display is utilized, one with the B-mode image and the other with the elastographic data. The elastographic data can be superimposed over a B-mode image. In this case, the B-mode image is usually displayed in grayscale and the elastogram in a color (▶ Fig. 5.3). If a grayscale is used, it should not be superimposed on the B-mode image, as the use of two superimposed grayscale maps in one image interferes with interpretation. Preference of maps is often determined by the user’s exposure to elastography and interpretation. If color maps are used, be careful to document which color scale you are using, as some have red as stiff and others blue as stiff. The color scale should always be included with the image for accurate interpretation.
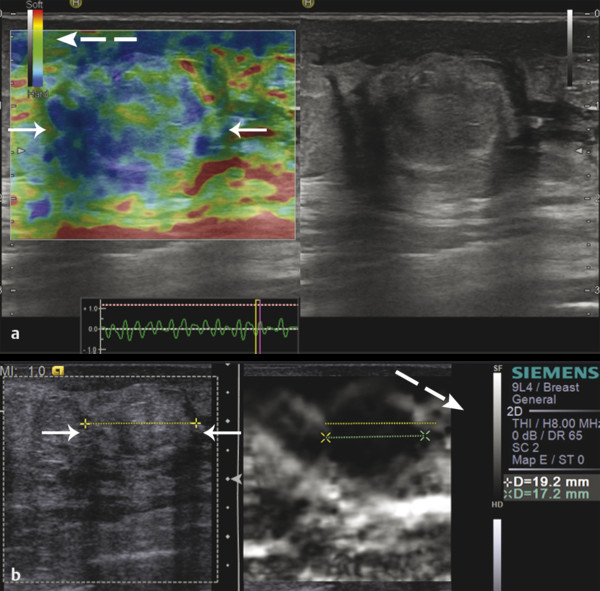
Fig. 5.3 Strain elastography results can be displayed (a) using a color-coded display superimposed on a background grayscale B-mode image or (b) using a grayscale display without the background grayscale B-mode image. The solid white arrows indicate the lesion and the dash white arrows indicate the display scale, which notes the color that represents soft and the color that represents hard.
5.3.2 Performing an Examination
Strain images are generated from the raw data of B-mode images. Therefore it is important to obtain quality B-mode images before activating the strain mode. It is important to maintain the transducer perpendicular to the skin. Find a scanning window that allows for stable positioning of the transducer with the compression–release cycle.10 Placing the palm of the hand on the patient helps stabilize the transducer and allows for more sensitive movements (▶ Fig. 5.4).

Fig. 5.4 If the sonologist places his or her palm on the patient, it stabilizes the transducer and allows fine control of compression–release by movement of the fingers.
Better quality elastograms can be obtained if the patient raises the ipsilateral hand above their head; the patient is positioned so the transducer is perpendicular to the floor; motion with respiration moves the lesion within the imaging plane; and the patient refrains from talking during the data acquisition.
Because SE is a relative technique comparing the stiffness values of the tissues within the field of view (FOV), a lesion may appear a different shade of gray (or color) depending on the other tissues in the FOV. If only one tissue type is present in the FOV, then the dynamic range of stiffness will be very small. For example if only fat is present in the FOV, some of the fat will code as stiff because it is the stiffest tissue in the FOV even though it is a very soft tissue (▶ Fig. 5.5).

Fig. 5.5 In this elastogram (a), the FOV is only fat, which is soft. However, because the stiffness scale in SE is relative, some fat reads as soft (white) while other fat reads as stiff (black). The range of stiffness in the scale is very small. In (b), the FOV has been increased to include pectoral muscle. The range of stiffness has been adjusted so that the pectoral muscle is displayed as black and all the fat is displayed as white.
This dynamic range variability of the SE scale can cause difficulty in interpretation. By including some fat, normal dense breast tissue, pectoralis muscle, and the lesion in the elastogram FOV, one can minimize these changes between images. Having a soft tissue (fat) and a harder tissue (muscle) helps maintain a similar dynamic range of grayscale or color display. A large FOV is helpful in image interpretation because including more tissue of differing stiffness will allow for a scale that allows for better differentiation between tissues.
The appropriate amount of compression–release for the system used is critical in obtaining diagnostic elastograms. The presently available systems vary in the amount of compression needed from no manual compression to moderate compression. The amount of compression may vary with the size of the breast or the depth of the lesion. With experience and practice, the compression–release needed for optimal elastogram quality for a given system can be learned. The B-mode image is useful to monitor the amount of tissue displacement.
5.3.3 No-Manual-Compression Systems
Place the probe on the area of interest without consciously applying any vibration/compression. Keep the probe lightly touching the skin and try not to apply pressure. It is important to keep your hands perpendicular with no pressure (minimal precompression) and still on the skin above the area of concern. A technique to confirm that minimal compression has been used has been described in the literature30 and is detailed section 5.3.4. Usually mild compression is used to obtain B-mode images as it decreases refractive artifacts.
In these no-manual-compression systems the compression–release cycle results from vibration caused by involuntary muscle movements of the sonographer’s hand and motion caused by the breathing and heartbeat of the patient. However, in some cases (in patients with large breasts or deep lesions), minimal additional vibration may be required. In patients with small breasts, the motion may still be too great and having the patient hold his or her breath may be helpful.
5.3.4 Minimal- and Moderate-Compression/Vibration Systems
Place the probe on the area of interest and apply very mild rhythmic vibration or compression/decompression making sure not to compress the breast with the transducer (do not apply precompression). Find the “sweet spot” for the ultrasound system and lesion depth by varying the degree and frequency of compression. The amount of compression needed may be between less than 1mm to 2 – 3mm.
Some manufactures have a display bar or number which can help you confirm you are applying the appropriate amount of displacement (compression–release) to generate the elastogram (▶ Fig. 5.6). Some provide a visual scale on the frequency and amount of displacement you are generating. This real-time feedback bar only evaluates the amount of lesion displacement (tissue deformation relative to the lesion). Other factors are important in obtaining optimal images, and so a high quality factor does not mean you will have optimal images.
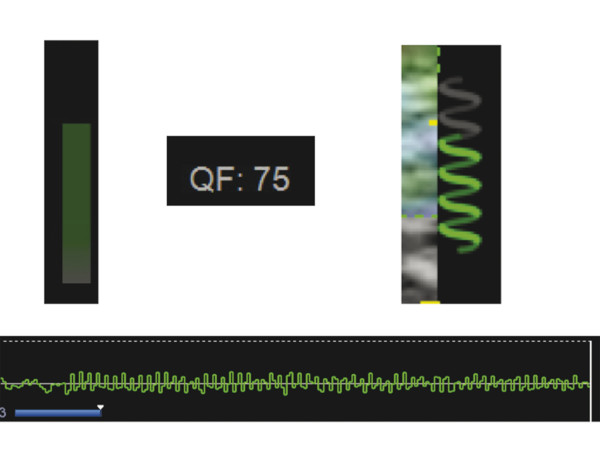
Fig. 5.6 In all systems a compression bar, quality measure, or movement map is provided to guide the sonologist to the appropriate frequency and amount of displacement for the compression–release cycle for that system. Several examples are provided here.
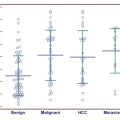
A critical factor in generating a diagnostic elastogram is the amount of pressure you apply with the transducer when scanning. This is called precompression (▶ Fig. 5.7). This is different than the amount of displacement you are generating. If you scan with a “heavy hand,” the tissues are compressed and their elastic properties are changed. This precompression markedly changes the image quality and can significantly affect results (▶ Fig. 5.8). This is confirmed with shear wave technology where the shear wave speed can change by a factor of 10 based on precompression. In ▶ Fig. 5.9 we graph the effects of precompression for various tissues. Note that as precompression increases, the differences in shear wave speed between tissue types decreases, leading to less conspicuity between tissues. If enough precompression is applied, all tissues are similar in stiffness and the elastogram is mostly noise.
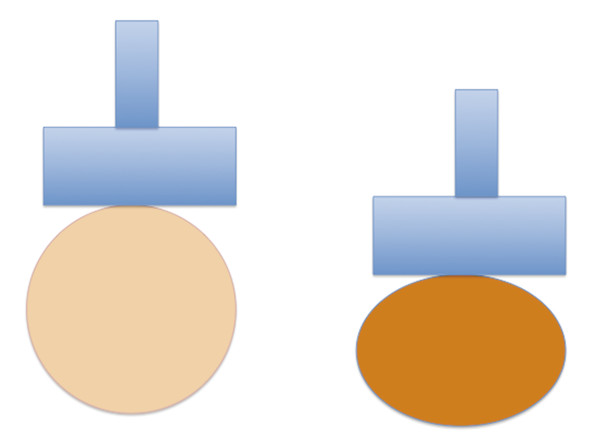
Fig. 5.7 A pictorial diagram demonstrating precompression. The image on the right depicts the breast when precompression is applied; the image on the left depicts the breast when minimal precompression is applied. The addition of precompression makes all tissues stiffer and affects elastography results.
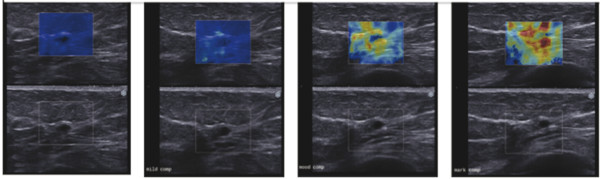
Fig. 5.8 Effect of precompression as seen in this set of images of a benign cyst. No precompression is applied in the image on the left. This color-coding is accurate. Increasing precompression is applied moving to the right. Note the color-coding changes. With enough precompression, the benign cyst has color-coding suggestive of a malignant lesion.
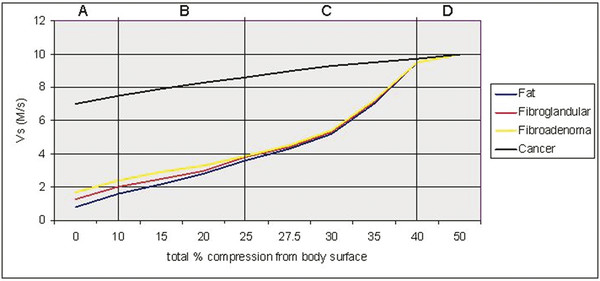
Fig. 5.9 When precompression is applied to breast tissue, the stiffness values increase. This diagram plots the shear wave speed for various breast tissues and pathologies with increasing precompression. Note that the stiffness values increase with precompression, and, if the maximum shear wave speed is used to characterize lesions as benign or malignant, a benign lesion can be made to have the stiffness of a malignancy with precompression. For SE, the differences between tissues are what is displayed. As precompression increases, the difference in stiffness between tissues decreases and therefore the quality of SE results decrease. (Reproduced with permission from Barr RG, Zhang Z. Effects of precompression on elasticity imaging of the breast. J Ultrasound Med 2012; 31:895–902.)
Generally some precompression is used when obtaining B-mode images as this decreases artifacts. A technique has been demonstrated to allow for consistent application of minimal.30 Identify an object in the far field of the image such as a rib. Lift the transducer from the skin. The object will be displaced deeper in the image. When the object is as far in the deep field as possible and there is still adequate contact with the skin for imaging, the elastographic images are obtained. Use of adequate coupling gel is very helpful. This technique has been shown to be highly reproducible both intraoperator and interoperator. This is a similar technique to that used for color Doppler imaging, as precompression can occlude blood vessels. It should be noted that the “quality factor” or “compression bar” used in some manufacturers’ equipment to assess adequacy of the amount of displacement does not assess the amount of precompression being applied.
The center of the lesion does not have to be used to obtain the elastogram. In fact it is better if a lesion position is chosen where the lesion measures between 1 and 1.5 cm. This allows for other tissues to be included in the field of view and account for size changes that occur in cancers in elastography. The size changes are discussed in detail in 5.3.8 Interpretation of Results..
5.3.5 Systems Using ARFI
If an ARFI push pulse is used to generate the tissue displacement (Virtual Touch imaging [VTi], Siemens Ultrasound, Mountain View, CA), no manual displacement should be used. The probe should be held steady and the patient asked to hold their breath and remain motionless during the acquisition. The patient should refrain from talking during data acquisition. The algorithm used to generate the elastogram is similar to SE using manual displacement on the same system. In general the ARFI push pulse is limited and cannot produce displacement deeper than 4 cm with the breast imaging transducer. If the lesion is deeper, a satisfactory elastogram may not be obtained. The images are displayed similar to SE using manual displacement images with the B-mode image on the left and the VTi elastogram on the right. When using an ARFI push pulse to generate a strain image, an ROI is placed at the site of the lesion. The ARFI pulse is only generated within the ROI box, therefore only the ROI box has strain data within it on the elastogram (▶ Fig. 5.10).
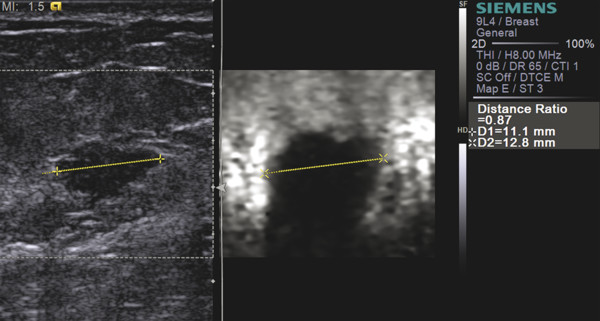
Fig. 5.10 Strain image obtained by using an ARFI pulse as the stress. In this 56-year-old female with an invasive ductal carcinoma (yellow line), the B-mode image is presented on the left. The dashed box is the FOV in which the ARFI pulse will generate stress to produce a strain image. This is different than using an ARFI pulse to generate and measure shear waves as in SWE. The image on the right is an strain elastography image. Like all SE images generated with manual compression, the lesion is stiffer than adjacent tissue and appears larger on SE than on B-mode (E/B > 1).
5.3.6 Tips and Tricks
Keep the FOV large to include fat, normal breast tissue, pectoralis muscle if possible, and the lesion. This will maintain a more constant color map (consistent dynamic range of strain values) between images.
If the lesion is large (>2 cm) select an image plane where the lesion is between 1 and 1.5 cm to obtain the elastogram.
Use the B-mode image to determine the amount of tissue displacement being applied.
Maintain the transducer perpendicular to skin and floor.
Use the B-mode image to confirm that the scan plane through the lesion remains constant.
Position the patient so the displacement motion is in the plane of the transducer.
Do not apply precompression with the transducer.
Compare the lesion stiffness to that of other tissues (i.e., fat and normal breast tissue).
Have the patient hold still and maintain uniform shallow breathing. No talking during data acquisition.
5.3.7 Artifacts and Pitfalls
Several artifacts can occur with SE. Some of these artifacts occur when technique is suboptimal, while others can contain diagnostic information.
Bull’s Eye Artifact
The Siemens and Philips SE systems have a unique artifact, the bull’s eye artifact, that occurs with cystic lesions.27 A different artifact can occur with other systems, the blue-green-red (BGR) artifact, and is described in the next section. The bull’s eye artifact is characterized by1 a black outer ring with2 a white central area and a3 white distal spot posterior to the lesion. The shape of the artifact mimics the shape of the cystic lesion. An example of the artifact is shown in ▶ Fig. 5.11, and it is described in detail in Chapter 2.15,27 This artifact occurs when the fluid in the cyst is moving and there is decorrelation of the signals between images. This artifact has a high predictive value for the lesion being a benign simple or complicated cyst. If the fluid within the cyst is very viscous, the artifact does not occur. This artifact does not occur in colloid or mucinous cancers. If there is a solid component within the cyst, the solid component will appear stiff and deform the artifact. The artifact can be seen in lesions that appear solid on B-mode imaging but these lesions have been proven to be benign complicated cysts. In these cases the lesions can be aspirated to confirm that they resolve after aspiration. In the case where a solid-appearing lesion on B-mode has the artifact and a core biopsy is performed, notifying the pathologist that a cystic lesion is suspected will help with radiology–pathology correlation as many pathologists do not report cysts routinely in their reports.
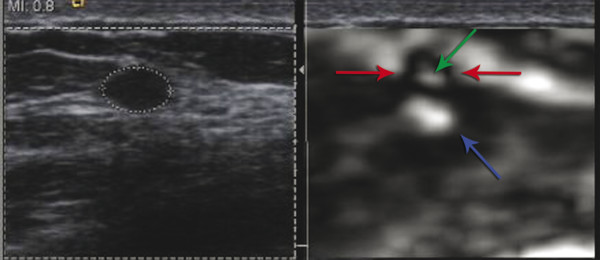
Fig. 5.11 In some systems’ strain elastograms, a bull’s eye artifact is seen in both simple and complicated cysts . The complicated cyst in the image on left (dotted white circle) has the bull’s eye artifact seen in the elastogram on the right. The bull’s eye artifact is composed of a black outer ring (red arrows), a white central signal (green arrow) and a distal white area (blue arrow). All three components are required to classify the lesion as a benign cystic lesion.
The bull’s eye artifact has been reported to decrease the number of biopsies performed. In one series, 10% of complicated cysts appeared solid on B-mode and were identified as benign cysts with this technique.27
Blue-Green-Red Artifact
Some systems have a different artifact that occurs with cystic lesions: a three-color layered pattern of blue, green, and red (called the BGR artifact).26 An example of this artifact is shown in ▶ Fig. 5.12. This artifact has not been evaluated in detail and the sensitivity and specificity of this artifact has not been reported.
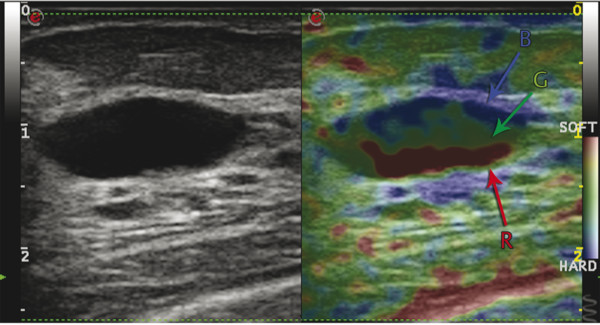
Fig. 5.12 Strain elastogram from a system that produces the blue-green-red (BGR) artifact instead of the bull’s eye artifact in simple and complicated cysts.
Sliding Artifact
If the lesion is moving in and out of the imaging plane when the SE image is being obtained, a white ring or group of waves occurs around the lesion (▶ Fig. 5.13). This has been named the sliding artifact.10,15 Having the same location of the lesion remain in the imaging plane during the acquisition can eliminate this artifact. Repositioning the patient, using less compression, or having the patient hold his or her breath may help keep the lesion in the scanning plane. This artifact occurs because the lesion is freely moveable within the surrounding tissues and is therefore most likely benign. It can occur with fibroadenomas or lipomas, and has been proposed as a method to determine if there is an invasive component to an intraductal malignancy.31
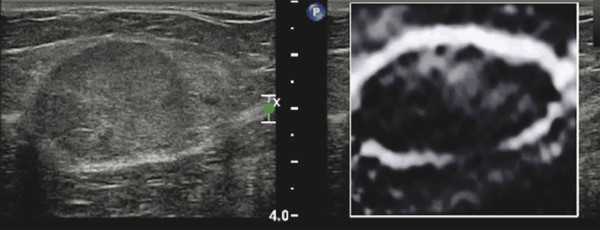
Fig. 5.13 If a lesion moves in and out of the imaging plane, a sliding artifact occurs. This artifact appears as a white ring around the lesion in the elastogram. In this image of a lipoma on the left, the lesion is imaged moving in and out of the imaging plane. In the elastogram on the right, there is a white ring around the lesion, the sliding artifact.
Worm Pattern Artifact
If there is very little variability in the elastic properties of the tissues within the FOV, the dynamic range of the SE scaling is very small and a pattern of varying signal is noted representing noise. This can occur when significant precompression is applied or only one tissue type is present in the FOV (▶ Fig. 5.14). This has been named the worm pattern.10,15 These images do not contain any clinically useful information. This artifact can be eliminated by the use of minimal precompression and including tissue types of varying stiffness within the FOV.
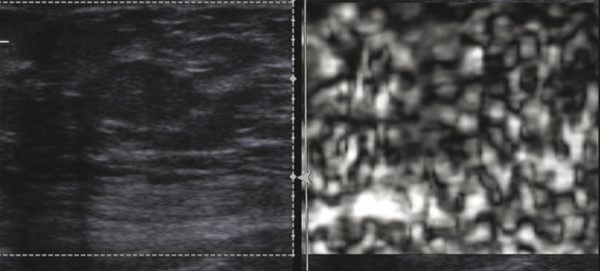
Fig. 5.14 When an image contains only tissues of very similar stiffnesses, as occurs when precompression applied, the elastogram image is all noise. This is depicted as alternating white and black blotches and is called the worm artifact.
5.3.8 Interpretation of Results
Three methods of interpreting strain images have been proposed: evaluating the size change between the elastogram and the B-mode image (E/B-mode ratio); a 5-point color scale (Tsukuba score); and the ratio of the lesion stiffness to fat stiffness (strain ratio or FLR). The relative stiffness (i.e., is the lesion stiff or soft compared to other breast tissues) can also be helpful clinically in interpreting images.
E/B Ratio
Using a real-time manual displacement strain system displaying the B-mode image and the strain elastogram simultaneously, Hall32 demonstrated that there was potential to use this technique to characterize breast lesions as benign or malignant. It was noted on SE elastography that benign lesions measured smaller in size than on the corresponding B-mode image while malignant lesions measured larger (▶ Fig. 5.15). They proposed utilizing the ratio of the lesion size on elastography to that on B-mode imaging (E/B ratio) as a diagnostic criterion for benign or malignant lesions.
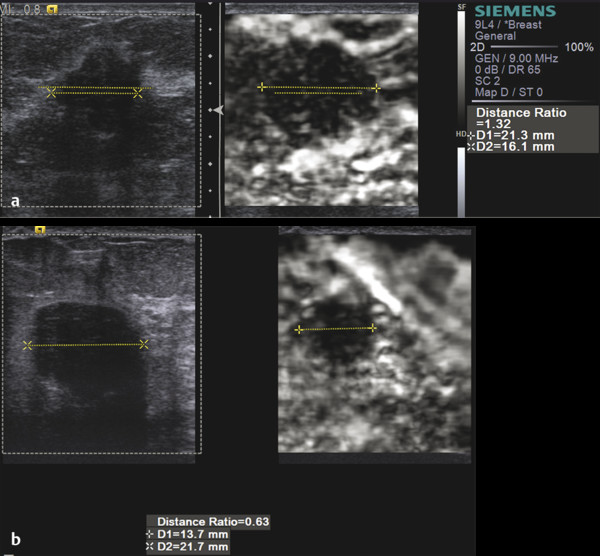
Fig. 5.15 In strain elastography (SE), malignant lesions appear larger in the elastogram than in B-mode imaging, while benign lesions appear smaller. (a) An invasive ductal cancer measures 16.1mm on B-mode imaging and 21.3mm in the elastogram with an E/B ratio of 1.32. (b) A benign fibroadenoma measures 21.7mm on B-mode imaging and 13.7mm in the elastogram with an E/B ratio of 0.63.
The location of the lesion within the elastogram does not affect results.10 Either the lesion length ratio or the lesion area ratio can be used. Measuring the length is usually easier and faster to perform. The lesion is measured in the same position on both the elastogram and B-mode image. The use of a copy, shadow, or mirror function in the measurement technique is helpful. These software keys allow one to measure the lesion on either the B-mode image or elastogram image in a dual mode display and have the length measurement depicted on the opposite image in the exact same position (▶ Fig. 5.16).
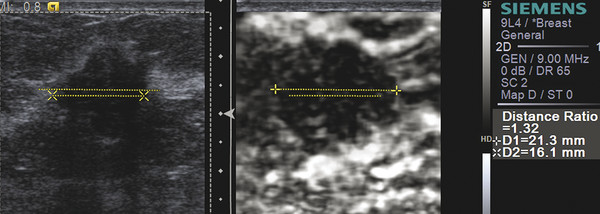
Fig. 5.16 Most vendors have a copy or duplicate function when measuring a lesion. As noted in this case, the lesion was measured on the B-mode image (x dotted line x) and then it is duplicated on the elastogram (dotted lower line) in the same location. The lesion can then be measured on the elastogram (+ dotted line +) and duplicated on the B-mode image (upper dotted line). The system then calculates the E/B ratio, which in this case is 1.32 suggesting a malignancy. Some systems copy the measurement made initially on either the B-mode image or the elastogram. The copied measurement can then be adjusted to the correct measurement and the E/B ratio is calculated.
Related posts:
Stay updated, free articles. Join our Telegram channel

Full access? Get Clinical Tree


