Conventional Ways of Diagnosing Lymphadenopathy
Lymph nodes are the guardians at checkpoints in the human body and send alarm signals in response to many pathologic conditions. Often, they are the first organs that become clinically detectable due to secondary involvement in diseases like infections, inflammatory conditions, and metastases. Status of lymph node involvement can be the most powerful prognostic indicator in the case of certain malignancies such as breast carcinoma, and it can influence management in such cases.2 Localized, or regional, lymphadenopathy indicates involvement of specific anatomical areas. For example, occipital lymph nodes are frequently involved in infections of the scalp, while left supraclavicular nodal involvement indicates primary malignancy in the gastrointestinal tract (Virchow’s node). Generalized lymphadenopathy may point to lymphoma or to nonmalignant systemic disorders, such as certain infections (HIV, infectious mononucleosis, etc.) and connective tissue disorders.3,4 Thus, the clinical importance of detection and characterization of enlarged lymph nodes and its eventual impact on patient management cannot be overemphasized.
Conventionally, manual palpation and ultrasonographic evaluation (B-mode and Doppler) are used for detection of lymph node abnormalities. Invasive techniques (like ultrasound-guided fine needle aspiration cytology and core needle biopsy), though being sensitive and specific for detecting macrometastases, have serious limitations in case of micrometastases.5
Manual palpation gives information about size, temperature, tenderness, and consistency of the nodes. Though it is a good fundamental technique, it fails to assess the internal structure of the nodes and has practical limitations in the evaluation of nodes situated deep to the skin. The sensitivity and specificity of manual palpation for detecting malignant lesions is low (64% and 85%, respectively).6.
Ultrasound imaging of lymph nodes (B-mode and Doppler) can assess the internal structure of the nodes and their vascularity. It helps to characterize clinically suspicious nodes and to identify occult nodes.7 These ultrasonographic techniques and their limitations are briefly described here.
8.2.1 B-Mode Ultrasound
With the advent of better resolution ultrasound machines and high-frequency probes with smaller footprints, the sensitivity of ultrasound to detect lymph nodes has increased manifold. These advances have also made the detailed study of the size, shape and internal structure (with respect to overall echogenicity, presence of central echogenic hilum, calcifications, margin definition and regularity, intranodal necrosis, and focal cortical hypertrophy) of lymph nodes possible, which contributes substantially to their characterization.
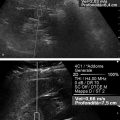
Lymph node size, as represented by its short axis diameter, has been considered as one of the criteria to differentiate malignant lymph nodes from benign ones (▶ Fig. 8.1). Various cutoffs ranging from 5 to 30mm have been described. However, this criterion, being an absolute value, depends on lymph node location and has either low sensitivity or low specificity.8,9,10 A short-to-long axis diameter ratio of 0.5 is a more useful parameter with moderate sensitivity, specificity, and overall accuracy of 75%, 81%, and 79%, respectively.11 Absence of a hyperechoic hilum (▶ Fig. 8.2) is characteristic of metastatic lymph nodes, with specificity and sensitivity of 88% and 90%, respectively, for detection of metastasis from papillary thyroid carcinoma.12 Yet, in general, it is not a definite criterion for differentiating between malignant and benign lymph nodes.8,11 Calcifications in lymph nodes are almost exclusively due to metastases from medullary and papillary carcinoma of the thyroid, besides those seen with benign diseases such as tuberculosis.8 This feature has a high specificity for metastasis but a low sensitivity.11 Eccentric cortical hypertrophy due to focal tumor infiltration is a useful sign to identify metastatic nodes. Metastatic lymph nodes are predominantly hypoechoic relative to adjacent musculature, as are reactive, lymphomatous, or tuberculous nodes. However, metastatic nodes from papillary or medullary carcinoma of the thyroid are usually hyperechoic.8 Intranodal necrosis may be found in tuberculosis and abscessed lymphadenopathy, along with metastatic nodes.8
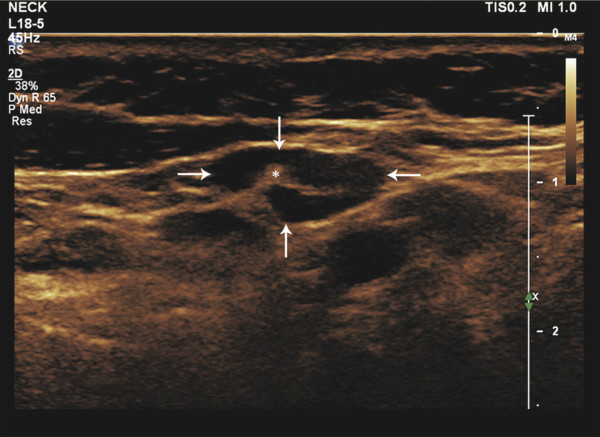
Fig. 8.1 B-mode ultrasound image of the neck showing a less than 1 cm lymph node (arrows). The node with an echogenic hilum (asterisk), which is one of the characteristics of a benign lymph node, measures around 0.8 × 0.5 cm.
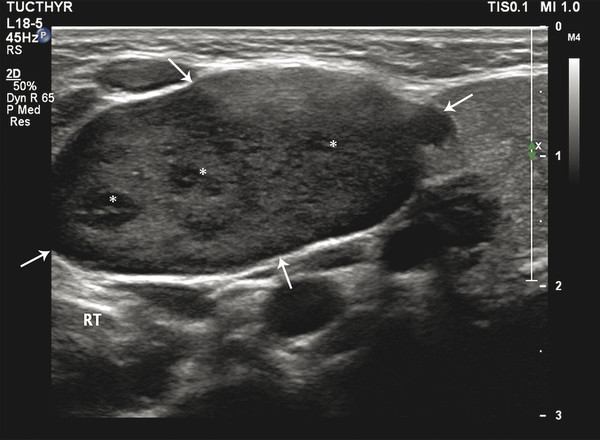
Fig. 8.2 B-mode ultrasound image of the neck showing a lymph node (arrows) with loss of central hilum and presence of internal hypoechoic nodules (asterisks). The node measures around 2.5 × 1.5 cm. These findings indicate malignancy.
8.2.2 Doppler Ultrasound
Doppler ultrasound evaluation of lymph nodes involves assessment of vascular distribution as well as vascular resistance within a lymph node.
Vascular Distribution
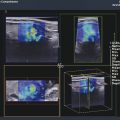
Evaluation of the vascular pattern of cervical lymph nodes shows a hilar type of flow (▶ Fig. 8.3) or absence of vascularity in the case of normal and reactive nodes. Peripheral or mixed vascularity is common in metastatic nodes (▶ Fig. 8.4). This criterion has moderate to high specificity (76%–99%) but low sensitivity (47%).11,13
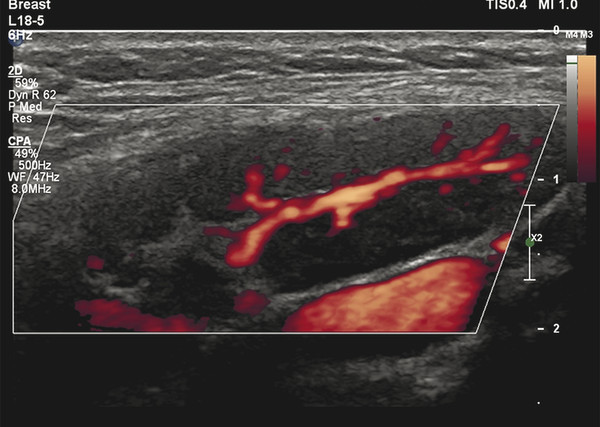
Fig. 8.3 Power Doppler ultrasound image of a benign lymph node showing normal branched hilar flow.
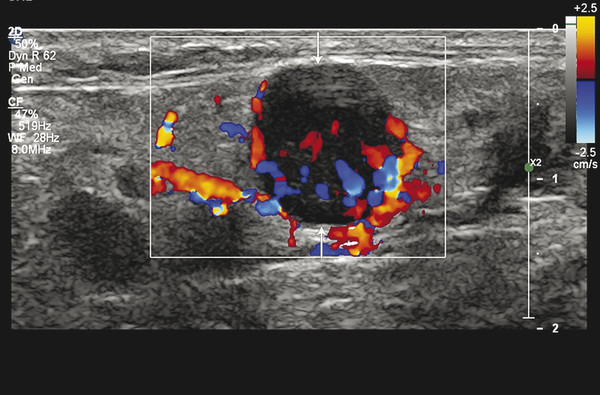
Fig. 8.4 Color Doppler ultrasound image showing mixed peripheral-central flow in a lymph node, a feature favoring malignancy. Also, note the round shape of the node (arrows).
Vascular Resistance
A high nodal vascular resistance (pulsatility index [PI] > 1.6 and resistivity index [RI] > 0.8) is generally indicative of metastatic lesions, while normal and reactive nodes tend to have PI < 1.6 and RI < 0.8.13 In view of the low sensitivity (47% and 55%, respectively14) of these indices and the technical difficulties involved in obtaining suitable and/or repeatable values, their role in routine clinical practice is limited.
Considering the limitations of the above modalities, there is a need to further improve diagnostic accuracy. Ultrasound elastography is a potential tool to fill this void.
8.3 Elastography for Diagnosis of Lymphadenopathy
Various studies have shown the usefulness of elastography in differentiating benign from malignant cervical lymph nodes.11,15 Simultaneous use of B-mode ultrasound, Doppler ultrasound, and elastography in various combinations could potentially improve diagnostic performance for lymphadenopathy.1 There are two main elastography techniques—strain imaging and shear wave imaging—that are widely used for the assessment of suspicious lymph nodes.
8.3.1 Strain Elastography Imaging
Strain elastography imaging is the more commonly used elastography technique for the study of lymph nodes. It is also known by the names of sonoelastography, real-time tissue elastography (RTE), tissue type imaging (TTI), and real-time sonoelastography (RTSE).16 The technique has been described in detail in Chapter 2. Here, its use pertinent to the study of lymph nodes is discussed.
Techniques
Strain imaging is commonly used for evaluating cervical lymph nodes. The anatomy of cervical nodes is shown in ▶ Fig. 8.5 for reference. According to the 2009 American Joint Committee on Cancer (AJCC) classification, cervical lymph nodes are classified into seven anatomical levels.17 Elastography is helpful for examining nodes of all the levels except for level VII, as level VII nodes are not accessible for ultrasound evaluation. The technique of performing cervical node strain elastography is discussed below. Practical tips include:
Position the patient similar to routine neck ultrasound imaging with neck extended over a pillow.
Hold probe perpendicular to the skin and apply a steady compression in the direction of ultrasound beam, followed by a slow release (decompression).
Apply adequate compression as guided by the compression bar. It should be at least at three-fourths of its maximum height.
Choose a field of view (FOV) so as to include the target lymph node and the surrounding tissue in approximately equal proportions.
Select an image with optimum FOV and compression for further analysis.
For the strain ratio (SR) calculation, select a small region of interest (ROI) that includes the hardest area of the node.
Use the freehand technique for all neck lymph node levels except level VII.
Adopt a similar technique for examining various superficial lymph nodes with an appropriate change in patient position during examination.
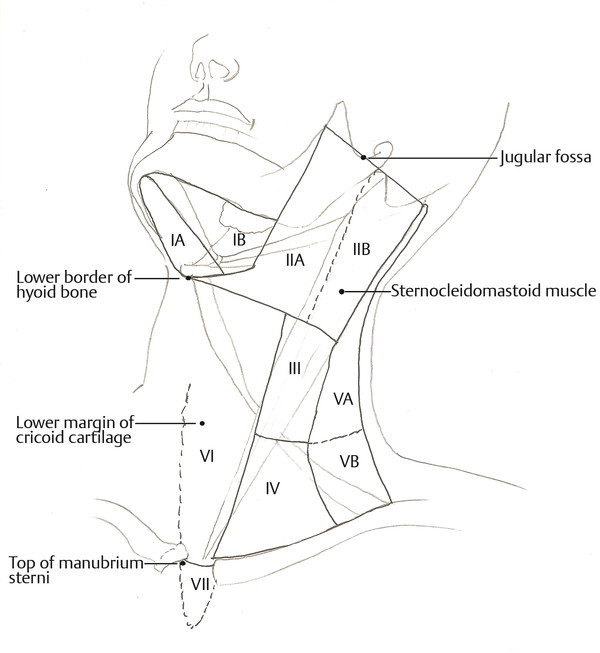
Fig. 8.5 Anatomical levels of cervical lymph nodes (Reproduced with permission from AJACC Cancer Staging Manual, 7th edition).17 Level I: submental (IA) and submandibular (IB); level IIA and IIB: upper jugular; level III: middle jugular; level IV: lower jugular; level VA and VB: posterior triangle group; level VI: anterior compartment group; and level VII: superior mediastinal group.
Patient Positioning and Initial Examination
The patient is made to lie comfortably in a supine position similar to that adopted for a standard neck ultrasound examination with neck slightly extended over a pillow. The examination begins with B-mode neck ultrasound using a linear array probe with a wide range of ultrasound frequency (5–18 MHz). After a systematic assessment of the position, size, and B-mode characteristics of each lymph node, the elastography mode is switched on and using the same probe the elastogram is obtained. A dual panel image is displayed, allowing one to see the B-mode image alongside the elastogram.1,11,18,19
Acquisition of Elastograms
The freehand technique for acquiring elastograms in described in ▶ Fig. 8.6. The probe is placed perpendicular to the skin surface overlying the lymph node under assessment. The patient is asked to avoid swallowing and hold his or her breath to prevent movement of the lymph node. A small precompressive force is applied to stabilize the node and hence to minimize its lateral movement. Unlike thyroid elastography, using intrinsic compression from carotid artery pulsations is not feasible for lymph nodes at all levels. Furthermore, due to their mobility, lymph nodes tend to get laterally displaced by arterial pulsations. Therefore, a freehand steady compressive force is applied with the probe followed by steady release. Images are obtained as a cine loop during multiple compression–release cycles. A compression scale displayed by the side of the image helps to optimize the compressive force. Different manufacturers have different grading systems for the compressive force, but in general a 75% rise in the display bar or a quality factor of 3 or 4 is considered optimal. An image with optimal compression is chosen for further assessment.11,18,19,20
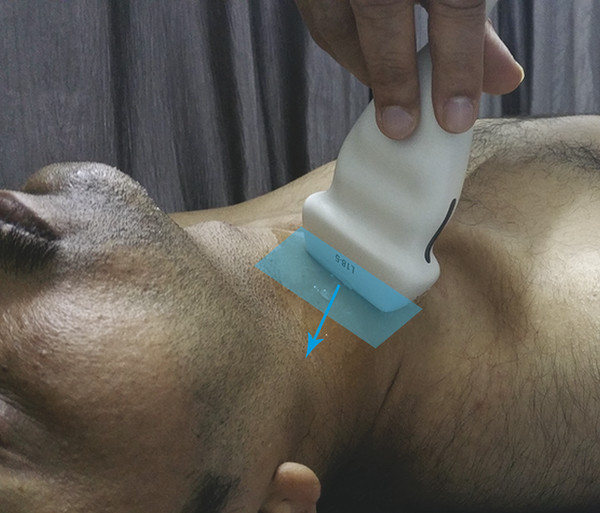
Fig. 8.6 The freehand technique of acquisition of data for an elastogram. A linear ultrasound probe is held perpendicular to the plane parallel to the skin overlying a cervical lymph node (blue polygon). A constant precompression is applied to fix the node against the underlying structures and a controlled compression is applied in the direction of propagation of the ultrasound waves (blue arrow) followed by decompression. A cine loop of elastograms is recorded during a few such cycles of compression–release. In the figure, level IV nodes lying adjacent to the sternal head of the sternocleidomastoid muscle are being investigated in a transverse direction.
The field of view (FOV) of the elastography map (elastogram) is chosen such that it includes the target lymph node and the surrounding reference tissue in the same plane in almost equal proportions. Ideally, at least 5mm of surrounding reference tissue beyond the lymph node margins should be included. The upper margin of the FOV is kept as close to the probe as possible. Surrounding tissues which can interfere or alter the strain ratio calculations, like bones and vessels, are excluded from the FOV.1,18,20
The Elastogram
Two types of elastograms are utilized for evaluation, grayscale and color, of which the latter is preferred. On the grayscale elastogram, hard and soft areas appear dark and bright, respectively. On the color elastogram, red represents the softest and blue represents the hardest areas, while intermediate stiffness is indicated by green. These colors represent relative hardness of the tissues on the elastogram. Many manufacturers provide an option of a color scale which is reversed with respect to the above-mentioned one; that is, where blue represents hardest areas and red, softest (▶ Fig. 8.7).21
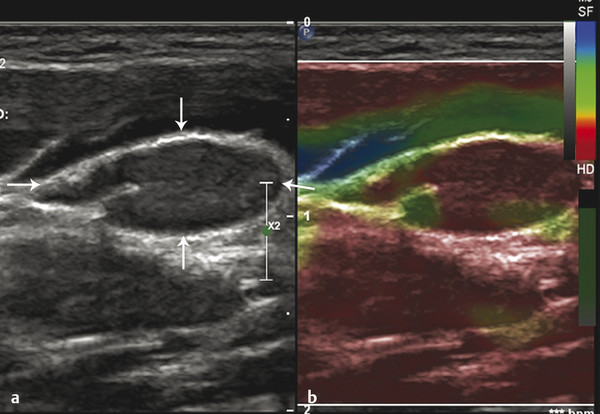
Fig. 8.7 Color elastogram of a lymph node (arrows) with an inverted color scale, in which red indicates stiff areas while blue indicates soft areas. (a) B-mode ultrasound image and (b) corresponding color elastogram. Red (stiff) areas are seen filling this node almost entirely. Note that shape and minor-to-major axis ratio of the node are typical of a benign node.
Interpretation of elastograms can be done in two ways: qualitative and quantitative. For qualitative analysis, elastograms are given various grades (an elasticity score [ES]) based on their appearance. For quantitative analysis, a strain ratio (SR), or strain index (SI), is calculated. The SR represents the ratio of the strain of a reference tissue to that of the lymph node of interest in the ROI.20 Most often, cervical muscles are used as reference tissue. Different cutoffs for SR have been suggested.
The following sections describe the two types of elastograms and the various grading systems used in evaluating them .
Grayscale Elastograms
When using grayscale elastograms it is important to turn off the background B-mode grayscale image so only the grayscale elastogram is displayed.
One of the methods adopted by Lyshchik et al to evaluate elastograms for lymph node visibility, relative brightness, margin regularity, and margin definition uses a 4-point rating scale (▶ Table 8.1).
Criterion | Score | 1 | 2 | 3 | 4 |
Node visualization | Not visible | Barely visible | Partially visible | Intensely visible | |
Brightness index | Very dark | Substantially darker | Slightly darker | Same or brighter | |
Margin regularity | Regular | Slightly irregular | Moderately irregular | Very irregular | |
Margin definition | Distinct, > 50% | Indistinct, < 50% | |||
It has been found that the majority of the benign nodes are barely visible (visualization score < 3) and have the same brightness as the surrounding structures (brightness index > 2) (▶ Fig. 8.8), while metastatic lymph nodes are partially or very visible (visualization score > 2) and appear substantially darker as compared to the surrounding muscle (brightness index ≤ 2) (▶ Fig. 8.9). This is because while metastatic lymph nodes are relatively stiffer than the surrounding muscle, there is not much difference between the stiffness of benign lymph nodes and muscle. Due to the same differences in relative stiffness, the margins of the metastatic lymph nodes appear more regular and distinct (regularity score and definition score 1 or 2) than the margins of the benign lymph nodes. This could also be attributed to the desmoplastic reaction surrounding metastases. These qualitative criteria have low diagnostic accuracy.11
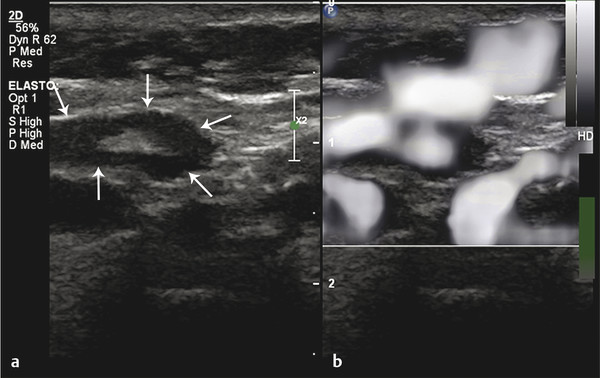
Fig. 8.8 Grayscale elastogram of benign lymph node. (a) B-mode ultrasound image showing a cervical lymph node (arrows) with a short-axis diameter of 5mm and a short-to-long-axis diameter ratio smaller than 0.5. (b) On the corresponding grayscale elastogram, the node looks as bright as the surrounding muscle.
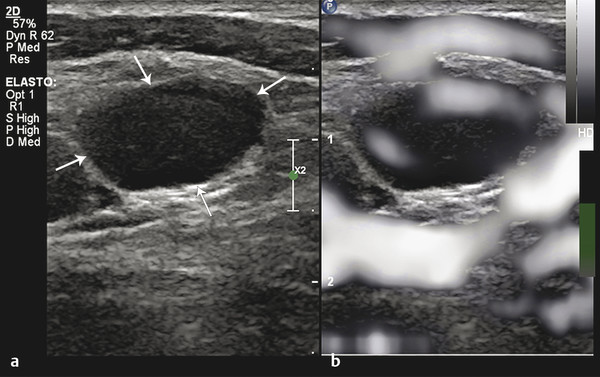
Fig. 8.9 Grayscale elastogram of metastatic lymph node. (a) B-mode ultrasound image showing a cervical lymph node (arrows) with a short-axis diameter of 8mm and a short-to-long axis diameter ratio greater than 0.5. (b) Corresponding grayscale elastogram. The major portion of the lymph node is darker than the surrounding muscle.
Color Elastograms
Color elastograms often allow better visual distinction between normal and pathologic areas. Various scoring and grading systems have been described for the interpretation of color elastograms.1,15,20,21,22,23,24,25 The system proposed by Alam et al seems to be the most accurate (sensitivity, 83%, and specificity,100%).1 It is described here in detail. Other noteworthy grading systems are briefly described thereafter.
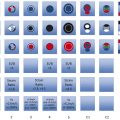
For the analysis of a color elastogram, an image with optimum compression force is first chosen. The color scale commonly used for color elastograms is shown in ▶ Fig. 8.10.
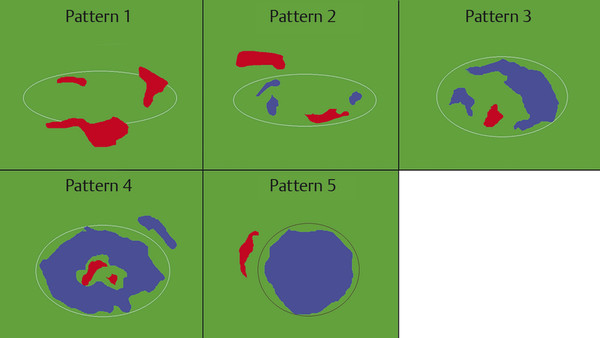
Fig. 8.10 Schematic showing elastogram color pattern as suggested by Alam et al.1 Pattern 1: absent or very small blue area. Pattern 2: small scattered blue areas, total blue area < 45%. Pattern 3: large blue area(s), total blue area ≥ 45%. Pattern 4: peripheral blue area and central green area, suggesting central necrosis. Pattern 5: blue area with or without a green rim.
Related posts:
Stay updated, free articles. Join our Telegram channel

Full access? Get Clinical Tree


