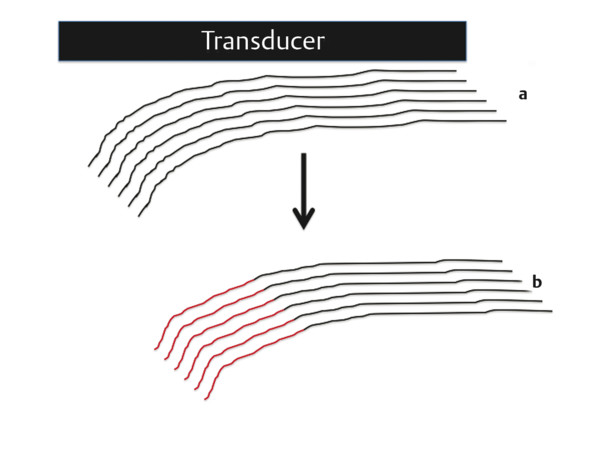
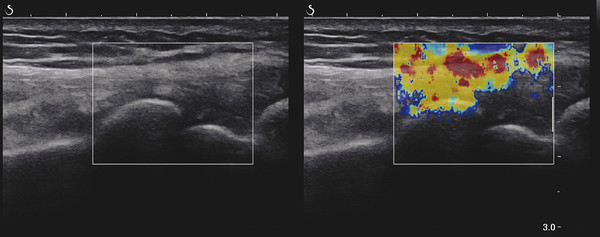
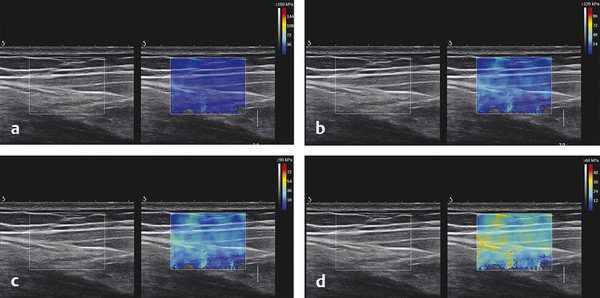
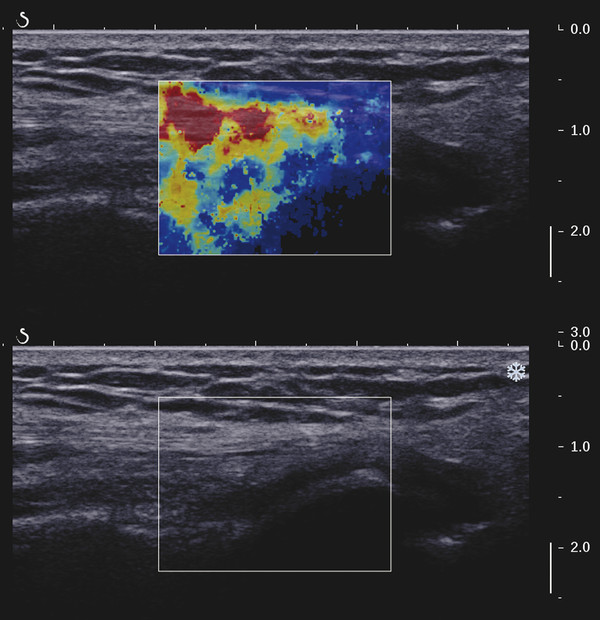
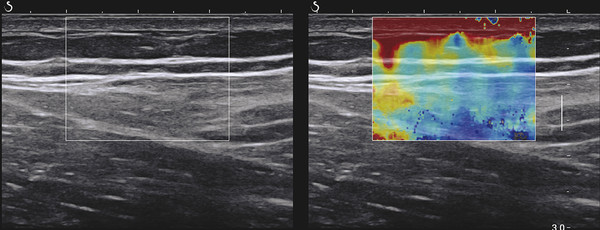
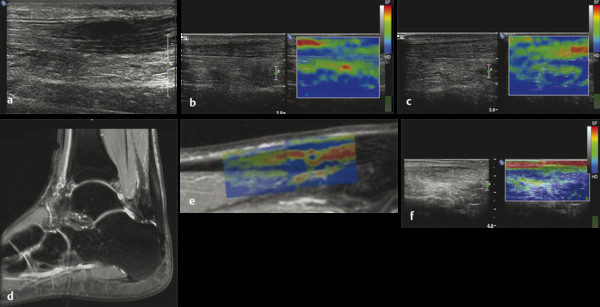
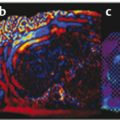
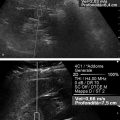
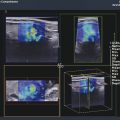
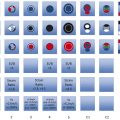
Structures with anisotropy have different acoustic properties in different directions, as just mentioned. It is important to have the transducer perpendicular to the structure so the angle of incidence of the beam is near 90 degrees. When the angle of incidence is not near 90 degrees, the structure may be hypoechoic due to refraction with no return of shear waves, and can simulate pathology. The effects of anisotropy on tendons or muscles are demonstrated in ▶ Fig. 10.1. In ▶ Fig. 10.1a, the transducer is placed on a tendon that is curved. In the ultrasound image ▶ Fig. 10.1b, the portion of the tendon that is perpendicular to the ultrasound beam (black) will appear normal with the linear structure of the tendon identifiable. However, in the portion where the angle of incidence is not 90 degrees (red), the linear structure of the tendon will not be identifiable and the tendon may appear hypoechoic and abnormal. Fig. 10.1 Schematic demonstrating the effect of the transducer not being parallel to the fibers of a tendon or muscle. (a) The transducer is placed on a tendon with the parallel fibers depicted.(b) In the resulting ultrasound image, fibers that are parallel to the transducer are visualized (black lines). However, where the tendon is not perpendicular to the transducer, the tendon fibers are not visualized (red lines). Both strain (SE) and shear wave elastography (SWE) have been applied to the MSK system. Chapter 2 details the basic science of both strain and shear wave elastography, as well as other references.3 Here we will highlight the unique features needed for performing adequate elastography on the MSK system. There are unique features of elastography when performed on the MSK system. Disease alters the biomechanical properties of muscles and tendons. The elasticity of tissues of the MSK system is altered in neoplastic conditions and in nonneoplastic disorders (e.g., injury, strain and/or sprain, tissue tear) such as tendinopathy, neuromuscular disease, or during wound healing.4,5,6,7,8 After discussion of strain and shear wave principles unique to the MSK system, we will review various applications of elastography in the MSK system. Several review papers are available on elastography of the MSK system.9,10,11 In strain elastography (SE) a stress is applied to the tissue (the transducer is the compression source) and how the tissue responds to that stress is measured with B-mode ultrasound. Stiff tissues do not deform significantly while soft tissues deform significantly. The compression–release used to generate the stress varies with each ultrasound system, with some requiring minimal or no compression and others requiring compression of 1 to 2mm and release. Most systems have a confidence scale that allows the users to monitor the amount of displacement; therefore you need to apply the appropriate amount of compression for accurate elastograms.12 SE is a relative technique. The stiffness of the tissue of interest in strain elastography is relative to the other tissues in the field of view (FOV). A grayscale or color scale is used to display the relative stiffness of the tissues in the FOV. Since tendons and ligaments are hard unless injured, using a color display with blue for hard and moving to green and then to red for soft can be helpful to indicate injury and/or disease. When using a color display, the B-mode image can be displayed behind the color elastogram to confirm tissue location. At this time SE can only be done when the tissues are static. A SE elastogram cannot be obtained when the tissue is moving (e.g., a tendon moving through its range of motion). However, an elastogram can be obtained when the MSK tissue is at various stages of its range of motion or in contraction. Because strain is relative, the exact stiffness of tissues cannot be determined. Therefore, to evaluate the stiffness of a tissue, it is compared to that of another tissue. For example, the stiffness of an abnormal tendon can be compared to that of a normal tendon or any normal tissue. Dividing the strain value of the tissue of interest by that of a normal tissue (one which has stable strain such as fat or relaxed muscle) calculates the strain ratio of the tissue of interest. The strain ratio can be used as a semiquantitative measurement of tissue elasticity. To perform SE in the MSK system, the transducer should be held perpendicular to the area of interest so that the strain is applied uniformly to the tissues. The transducer should be aligned to the orientation of the tissues; that is, it should be parallel to the tendons or muscle bundles. Because most MSK tissues are anisotropic, elastography results will vary if the transducer is angled and not parallel to the normal anatomy of the tissue. Obtaining a short cine loop is helpful so that the best image can be identified on review. Applying pressure with the transducer will increase the stiffness of the tissues and leads to inaccurate results. The elastogram should be obtained with minimal transducer pressure.13 A steady hand and soft touch are needed to obtain accurate elastograms. It is helpful to have several tissues in the FOV to allow for an appropriate dynamic range of stiffnesses for scaling of results. If a strain ratio is desired, both the tissue of interest and the reference tissue should be included in the FOV. Try not to include bone in the elastographic FOV; because due its marked stiffness, it will affect the scaling of the elastographic image. Since most MSK applications involve scanning of superficial tissue, the use of a high-frequency linear transducer is preferred. When the tissue of interest is very superficial (just a few millimeters below the skin), the use of ample coupling gel or a standoff pad is recommended to increase the distance between the transducer and tissue of interest.14 Align the transducer with the normal anatomical features of the MSK tissue. Maintain the tissue or area of interest in the FOV during the acquisition. Be aware of the state of the MSK tissue. The elasticity changes with the degree of muscle contraction and of stress on the tendon. Do not apply precompression. Minimize motion while scanning (of both the patient and sonologist). For most MSK elastography applications, the transducer must be aligned with the normal anatomical structure of the tissue of interest. ▶ Fig. 10.2 demonstrates the difference in results if the transducer is not aligned properly with the tissue. As the SE image is calculated based on the changes in the B-mode signal with the addition of stress, bad B-mode images will lead to poor or inaccurate elastograms. Fig. 10.2 When the transducer is not parallel to a tendon or muscle fibers, inadequate images are obtained. Not only is the B-mode image degraded, but the elastogram is inaccurate. In this case, the tendon shows normal stiffness where parallel to the transducer, but, where the tendon curves, the B-mode image is degraded with the tendon appearing hypoechoic and the two-dimensional shear wave imaging unable to calculate a stiffness value (no color-coding). Ideally it would be useful to obtain the change in stiffness of the tissue during its range of motion. However, this cannot be done dynamically with SE, but one can evaluate the tissue of interest at various points in its range of motion. A detailed discussion of how to interpret results is provided in the Section 10.4, Applications . In general, SE compares the stiffness of the tissue of interest to either the normal form of that tissue or to another tissue that has relatively uniform stiffness across patients. The strain ratio calculated can be used as a semiquantitative method to assess stiffness. For tendons and muscles, many pathologic states are softer than the normal tissue. For masses, malignant lesions are usually stiffer than the normal tissue. The use of color or power Doppler can also add additional information, demonstrating hyperemia and healing of the tissue. In shear wave elastography (SWE), a low-frequency strong push pulse, called an acoustic radiation force impulse (ARFI), designed to generate shear waves is applied to the tissue. B-mode ultrasound is then used to monitor the tissue displacement caused by the shear wave as it passes through the tissue, and with this the velocity of the shear wave can then be calculated. The shear wave speed increases in stiffer tissues and is slower in softer tissues. Therefore, SWE provides a quantitative measurement of the tissue stiffness. That stiffness can be expressed as shear wave speed in meters per second (m/s) or can be converted to Young’s modulus in kilopascals (kPa) by making some assumptions regarding the tissue.12 There are two types of SWE, point shear wave elastography (p-SWE) and two-dimensional shear wave elastography (2D-SWE). In p-SWE, a small ROI is placed on the tissue of interest and when activated the stiffness value in that small ROI is obtained. With 2D-SWE, a large FOV is placed over the area of interest and when activated the shear wave speeds for each pixel are calculated and displayed as a color-coded map. A small ROI can then be placed to obtain the stiffness value of a certain location. 2D-SWE can be performed either as a single shot (one image) or in real-time (with continuous updating of the elastographic measurements). However, when using real-time 2D-SWE, the transducer must remain in one location for several seconds to get a stable and accurate measurement. Tendons are very stiff and their shear wave velocities are quite high. The appropriate default settings must be selected so that the system can monitor the fast shear wave speeds. The stiff tissue also attenuates the shear waves as they travel. Therefore, closer ARFI pulses are needed to measure tendons accurately. As with SE, applying precompression with the transducer will increase the stiffness of all the tissues. The examination should be obtained with minimal pressure applied by the transducer. Ample coupling gel is often very helpful. When using real-time 2D-SWE, the transducer must remain in one location fo several seconds to allow the image to stabilize for accurate stiffness measurements. Adjust the maximum stiffness scale to be appropriate for the tissue of interest (▶ Fig. 10.3). Do not apply precompression. Watch for motion (of both the patient and the sonologist). Fig. 10.3 The tissues in the musculoskeletal system have a wide range of stiffnesses from very soft fat to very stiff tendons. To adequately visualize the tissues of interest, the color scale on two-dimensional shear wave imaging can be adjusted to identify stiffness changes in the tissues. In this series of images the stiffness scale is adjusted from 180 kPa (a), to 120 kPa (b), to 90 kPa, (c) to 60 kPa (d). Note that with the decreasing stiffness range, more variability can be identified in the stiffness of the tissues. If the proper preset is not selected, the number and spacing of ARFI pulses may not be sufficient to get accurate measurements (▶ Fig. 10.4). With very stiff tissues, the shear wave may dissipate before the next ARFI pulse and give an alternating pattern of stiff followed by soft. The ARFI pulse is similar to other ultrasound pulses and can be reflected or refracted. Having appropriate alignment with the tissue is needed to obtain an accurate elastogram. In the near field, the ARFI pulse can be very strong and have reverberations that can lead to a region of high stiffness just under the transducer. This is called the bang artifact (▶ Fig. 10.5). This can also occur when there is too much precompression applied. Fig. 10.4 To perform two-dimensional shear wave imaging, multiple acoustic radiation force impulse (ARFI) pulses are used and the shear wave speeds at each ARFI pulse are measured over several millimeters. If the ARFI pulses are too widely spaced for the tissue being interrogated, the shear waves may be attenuated between the ARFI pulses and therefore the speed reading may be inaccurate or there may be no reading at all and so no color-coding of the elastogram may be seen in this area. Also the B-mode tracing pulses must be appropriately placed to accurately measure the expected shear wave velocity. This occurs especially when very stiff tissues are being evaluated such as tendon. The appropriate preset must be selected to have the appropriate number and spacing of ARFI pulses as well as spacing of the B-mode tracking pulses. In this example, where a preset for soft tissues was used on a stiff tendon, note the “banding” of the color-coding (arrows). This is where the ARFI push pulses were too widely spaced and the low stiffness values between pulses are due to attenuation. This can be corrected by choosing the appropriate preset. Fig. 10.5 If too much precompression is applied or there is poor coupling between the transducer and the skin, an area of high stiffness in the near field is seen, the bang artifact. Applying less precompression and using ample coupling gel can eliminate this artifact. With SWE, a quantitative measure of stiffness is obtained. That value can be used to determine if a tissue is normal or abnormal. The stiffness ratio of the tissue of interest to normal tissues can also be used as in SE. In general for tumors, a cutoff value can be obtained to distinguish benign from malignant lesions. Cutoff values and comparison to normal tissues can also be used to determine injury and monitor healing. In most tendons, their tension has a reproducible and difficult-to-control effect on imaging. For example, when the patella tendon is contracted, it is uniformly stiff. However, when relaxed, even a normal tendon may demonstrate soft spots and more relatively slack points. Controlling the tendon tension is important in obtaining consistent results. Soft regions in tendons correspond to edema, tendinitis, and/or neovascularization. Most work with elastography on tendons has been done on the Achilles tendon. Achilles tendinopathy usually occurs 3 to 5 cm from the insertion. The second most common location is at the insertion. Less commonly it occurs at the myotendinous junction of the gastrocnemius.15,16 Achilles tendinopathy is believed to begin with microtears leading to a degenerative cascade.15,16 Tendinopathy is a degenerative process with collagen fiber separation, increased cellularity, neovascularization, and fatty infiltration.17 This process softens and weakens the tendon and eventually leads to spontaneous tendon rupture.18,19 Elastography, both strain and shear wave techniques, can be used to identify the softening of the tendon in tendinopathy. The Achilles tendon is normally very stiff. The tendon stiffness value varies with the degree of extension of the tendon. Aubry et al measured the mean stiffness value of the Achilles tendon as 104 kPa during extension, 464 kPa in the neutral position, and 410 kPa during maximum dorsiflexion in the longitudinal plane.20 Using 2D-SWE, the Achilles tendon in healthy volunteers in the resting position was 51.5 kPa.21 Elastography had a sensitivity and specificity of more than 90% in detecting tendinopathy compared to clinical findings.22 The strain elastography of surgically sutured Achilles tendon ruptures has been investigated using a color scale. The Achilles tendon showed a homogeneous stiff structure in healthy volunteers, while in patients with complete tendon rupture 38 months after surgical repair, a stiff elastogram with a heterogeneous pattern was found.4 ▶ Fig. 10.6 is an example of a patient with Achilles tendonitis using SE. ▶ Fig. 10.6a is the B-mode image. ▶ Fig. 10.6b is just superior to the abnormal area and ▶ Fig. 10.6c is the area of tendinopathy. The tendon is soft (red) at the area of tendinitis and small tears, while it is stiff (blue) in the areas that are normal. The elastographic findings are similar to the magnetic resonance imaging (MRI) findings (▶ Fig. 10.6d). ▶ Fig. 10.6e is the fused MRI and SE images. The abnormal findings are similar on both techniques. This patient was followed during his treatment and SE was able to monitor the healing of the tendon (▶ Fig. 10.6f). Fig. 10.6 (a) The B-mode image of a runner who presents with Achilles tendon pain demonstrates a hypoechoic area consistent with a small tear or tendonosis. (b) The SE image just above the hypoechoic area demonstrates the tendon is stiff (blue) but is softer as it nears the hypoechoic area. (c) Over the area of hypoechogenicity the tendon becomes very soft (red). (d) The corresponding T2-weighted magnetic resonance (MR) image taken at the same time demonstrates an area of increased signal at the site of hypoechogenicity on US. (e) Fusion of the strain elastography (SE) image and T2-weighted MR image confirms the areas of abnormality on both modalities are identical. After two months of treatment the patient returned for (f) a repeat SE image that shows the tendon has returned to near normal with only a small area of softness (green).
10.2 Strain Imaging
10.2.1 Techniques
10.2.2 Tips and Tricks
10.2.3 Artifacts and Pitfalls
10.2.4 Interpretation of Results
10.3 Shear Wave Imaging
10.3.1 Techniques
10.3.2 Tips and Tricks
10.3.3 Artifacts and Pitfalls
10.3.4 Interpretation of Results
10.4 Applications
10.4.1 Tendons
Achilles Tendinopathy
Related posts:
Stay updated, free articles. Join our Telegram channel

Full access? Get Clinical Tree


