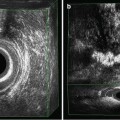
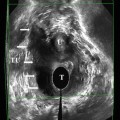
Fig. 11.1
3D EVUS of the pelvic floor of a patient with bilateral levator ani separation from the pubic bone. BK 8838 probe is used for imaging. PS pubic symphysis, U urethra, V vagina, R rectum, LAD levator ani defect, LA levator ani. Source: Shobeiri. Surgical repair of bilateral levator ani muscles. IUGJ 2012
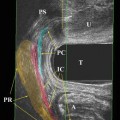
A direct repair technique has been described with a “bridging” method using fascia lata [27]. This surgery is technically difficult and not easily adaptable. A recent report documents the implementation of needle-guidance and 3D endovaginal ultrasound for the surgical repair of levator ani muscle defects (Fig. 11.2) [24]. As described, the technique involves an intraoperative 3D endovaginal ultrasound (using the 8838 probe), and under ultrasound guidance, the detached levator muscles are tagged with J-hook needles (MPM Medical, Elmwood Park, NJ, USA). The authors describe the ability to manipulate the needle in order to identify the torn ends of the muscles. Further longitudinal follow-up in a series of patient will be needed to determine the success of this approach.
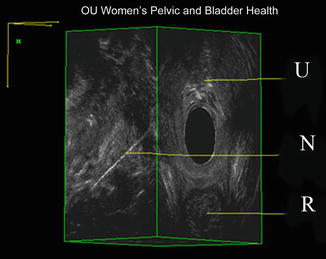
Fig. 11.2
J-hook needle in the puborectalis muscle by endovaginal 360° ultrasound. U urethra, N needle, R rectum. Source: Shobeiri. Surgical repair of bilateral levator ani muscles. IUGJ 2012
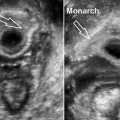
A useful utilization of 3D endovaginal ultrasound is that of clear visualization of synthetic implants, such as midurethral sling materials (Fig. 11.3). Surgical removal of these synthetic materials can be challenging in nature, especially when performed in patients remote from surgery. 3D endovaginal ultrasound provides real-time visualization of the midurethral sling material. It allows for visualization of the precise location of the synthetic, relative to the urethrovasical junction, as an adjunct to surgical planning, or allows for real-time needle localization of the location of the material, just prior to surgical prepping [28].
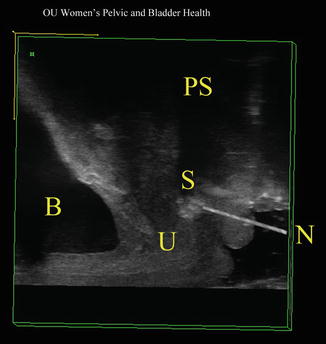
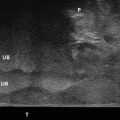
Fig. 11.3
During surgery, in cases where the sling is not palpable, a needle is inserted into the sling which facilitates location and division of the sling. B bladder, PS pubic symphysis, S sling, N needle, U urethra. Source: Shobeiri. Transvaginal sling release with intraoperative ultrasound guidance. JPMS 2013
Ultrasonography can also be used for localization of rectovaginal fistula tracts while patient is under anesthesia. To view small complex fistulas, injection of hydrogen peroxide into the fistula tract may be required (Fig. 11.4).
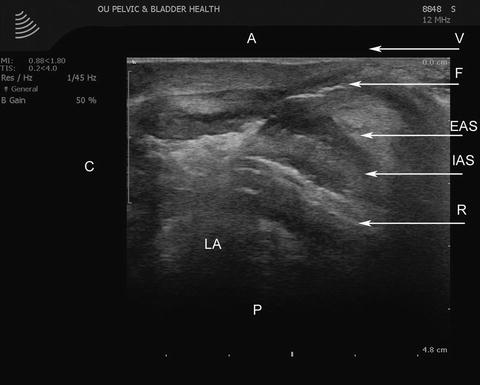
Fig. 11.4
The transvaginal ultrasound image in a mid-sagittal orientation with full visualization of the fistula tract after hydrogen peroxide injection. A anterior, C cephalad, EAS external anal sphincter, F fistula tract, IAS internal anal sphincter, LA levator ani muscle, P posterior, R rectum, V vagina. Source: © Shobeiri
11.3 Functional Imaging
11.3.1 Manometry
Currently, the best functional imaging may be afforded by the magnetic resonance imaging (MRI) because of its extended field of view. However, pelvic organ prolapse staging with the use of POP-Q, dynamic MR imaging, and perineal ultrasonography only correlates in the anterior compartment and has poor correlation in central and posterior compartments [29]. MRI has been useful for creating finite element models to evaluate mechanisms of pelvic floor injury [30, 31]. What have been missing in functional evaluation are manometric measurements. Manometry has been used in years for evaluation of the anal sphincter complex [32]. Vaginal pressure is a key measure of the strength of the pelvic floor muscles. Kegel was the first to use a pneumatic resistance chamber to measure vaginal pressure and perform biofeedback therapy using his device to improve the strength of pelvic floor muscle. Since then, several investigators have used various types of devices to measure vaginal pressure/force as a measure of the pelvic floor strength. Pressures in general are directionless and should be symmetrical on all sides. However, such is not the case in various sphincters or high-pressure zones (HPZs) of the body because these are contact and not the cavity or fluid pressures. Using a side-hole infusion manometry technique that can measure contact pressure at a point location, we found that there is a HPZ in the distal part of the vagina that shows axial and circumferential asymmetry of the contact pressures both at rest and during contraction. Furthermore, the contact pressures increase significantly during pelvic floor contraction. Static and dynamic characteristics of vaginal HPZ using a novel, tactile pressure-sensing technology (i.e., high definition manometry—HDM) have been investigated [33]. To further understand the characteristics of vaginal HPZ revealed by HDM, the authors recorded dynamic, two-dimensional (2D) US images of the pelvic floor muscles. Additionally, dynamic magnetic resonance (MR) imaging of the pelvis and pelvic floor muscles was performed to study the anatomical relationship between vaginal HPZ and the adjacent pelvic floor structures [33]. Their data showed the following results. First, HDM plots revealed that, in the vaginal HPZ, the contact pressures are distributed asymmetrically in different quadrants, with lateral contact pressures being significantly smaller than the anterior and posterior ones. During pelvic floor contraction, there is significant increase in the contact pressure in all quadrants of the vaginal HPZ, but the major increase occurs in the anterior and posterior directions. Second, with pelvic floor contraction, there is significant cranial movement of the posterior contact pressure cluster in relationship to the anterior contact pressure cluster. In fact, anterior and posterior contact pressure clusters come axially (along the probe) closer to each other. Third, 2D US and MR images showed that the anorectal angle moves in the ventral and cranial directions during pelvic floor contraction. The cranial movement of the anorectal angle, as revealed by US images and MR images, is of the same magnitude as that of the vertical movement of the posterior contact pressure cluster on the HDM probe. Fourth, MR images with a collapsible bag in the vagina showed the location of vaginal HPZ in relationship to the pubic symphysis, urethra, anal canal, and other pelvic floor structures (Fig. 11.5) [33]. The investigators proposed that using HDM probe one may investigate whether it is possible to divide pelvic floor disorders into disorders of elevator (pubovisceralis) and constrictor (puborectalis) functions. Using the same technology, the same group reported on functional morphology of the anal sphincter complex (Fig. 11.6). They concluded that by high definition anal manometry (HDAM) plots the anal canal pressures are highly asymmetric in the axial and circumferential direction. Anal canal length determined by the 3D US images is slightly smaller than that measured by HDAM. The external anal sphincter (EAS) (1.9 ± 0.5 cm long) and PRM (1.7 ± 0.4 cm long) surround distal and proximal parts of the anal canal, respectively. With voluntary contraction, anal canal pressures increase in the proximal (PRM) and distal (EAS zone) parts of anal canal. Posterior peak pressure in the anal canal moves cranially in relation to the anterior peak pressure, with squeeze. Similar to the movement of peak posterior pressure, MR images show cranial movement of anorectal angle with squeeze [34].
Fig. 11.5
Sagittal view of the HDM plots at rest and during squeeze, demonstrating the location of the peak pressure in the anterior (A) and posterior (P) midline (n = 11). Black circle marks the location, and broken line depicts the level of peak pressures. With pelvic floor contraction, the distance (Δ = delta) between the peak pressures decreases from 1.0 to 0.2 cm. Cd caudal end, Cr cranial end, HDM high definition manometry. Source: Raizada. HDM, US, and MRI of pelvic floor muscles. Am J Obstet Gynecol 2010
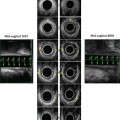
Fig. 11.6
Sagittal image of the high definition anal manometry pressure plot at rest and squeeze. A line connecting the peak pressure in the anterior and posterior midline shows movements of the peak posterior pressure in the cranial direction with squeeze. The change in the angle of the above line is similar to the change in angle measured in the magnetic resonance images and reflects the elevator function of the pelvic floor muscle. Cd caudal end, Cr cranial end, HDM high definition manometry. Source: Raizada. Functional morphology of anal sphincter complex, Neurogast & mobility, 2011
11.3.2 MR Imaging
A major shortcoming of the above manometric studies is that HDM can be used to measure pressures and MRI and TPUS are used to image the pelvic floor, and then the correlation is made. In the search for an improved three-dimensional (3D) imaging modality that simultaneously looks at anatomy and function, recently the use of diffusion tensor imaging (DTI) with fiber tractography was proposed for the visualization of the normal female pelvic floor using MRI [35]. The enhanced 3D visualization with DTI and fiber tractography might have the potential to both visualize and quantify abnormal pelvic floor support in patients with prolapse. Zijta and colleagues performed a study to examine the clinical application of DTI and fiber tractography of the pelvic floor support, by prospectively evaluating and comparing the fiber tract outcomes and basic DTI parameters of women with pelvic organ prolapse with those of women with pelvic floor symptoms but without pelvic organ prolapse, and with those of asymptomatic nulliparous women. We also intended to investigate the degree of inter-rater reliability. Their findings were as follows: anatomical representation of the pubovisceral muscle in 34 % (19/56); puborectal muscle in 13 % (7/56); superficial transverse perineal muscle in 27 % (15/56); ischiocavernosus muscle in 54 % (30/56); bulbospongiosus muscle in 43 % (12/28); and urethral sphincter complex in 29 % (8/28) of the datasets, respectively. No perceptible differences in tractability or nontractability were found in per-group distributions. The iliococcygeus muscle was rated non-satisfactory in all datasets (56/56). The following anatomical structures were identified in most of the DTI datasets: perineal body 100 % (28/28), anal sphincter complex 93 % (26/28), and internal obturator muscle 100 % (56/56) (Fig. 11.1). Despite the overall non-satisfactory visualization of the global appearance of the pubovisceral muscle in the datasets (37/56), analyses of its subdivisions resulted in a satisfactory visualization of the puboperineal muscle in 23 of the 28 subjects. Both the pubovaginal and puboanal subdivision could not or only insufficiently be tracked. Substantial overall inter-rater agreement was found for the independent qualitative scores. The overall weighted kappa for all muscle assessments was 0.71 (95 % CI 0.63–0.78). Qualitative inter-observer agreement for the anatomical structures which met the criteria for quantification was also substantial (PABAK 0 0.76). The authors concluded that DTI permits 3D visualization and quantification of part of the pelvic floor anatomy, with reliable high-quality tractability of the anal sphincter complex, perineal body, and the puboperineal muscle [35]. The authors state DTI and fiber tractography are feasible noninvasive tools to assess in vivo pelvic floor anatomy, which exceed the resolution of frequently applied conventional MR techniques and might provide complement information in pelvic floor disorders (Fig. 11.7) [36].
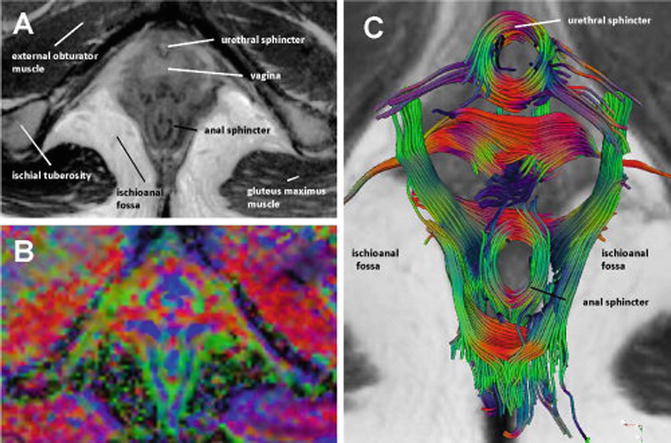
Fig. 11.7
Axial T2-weighted image of a 26-year-old nullipara (a) with corresponding directionally coded FA map (b). The pervoxel vector values are color coded as follows: green (anteroposterior direction), blue (craniocaudal direction), and red (mediolateral direction). Fiber tractography (c) demonstrates the multidirectional organization of the complex pelvic floor anatomy with a clear visualization of circularly orientated fibers at the level of the urethral and anal sphincter complex. Source: Zijta, Diffusion Tensor Imaging and Fiber Tractography, Clinical anatomy 2013
11.3.3 Endocavitary Ultrasound and Real-Time Elastography (RTE)
Ultrasound real-time elastography (RTE) is a rather new imaging modality based on differences in radiofrequency signals following endogenous/exogenous compression due to different elastic properties of the targeted tissues or organs. This may yield additional image information and, therefore, enhance diagnostic accuracy and potentially improve clinical management [37]. Elastography is a term referring to imaging techniques that aim to assess tissue elasticity. All approaches that have been introduced to date are based on a common three-step methodology:
1.
Generate a low frequency vibration in tissue to induce shear stress.
2.
Image the tissue with the goal of analyzing the resulting stress.
3.
Deduce from this analysis a parameter related to tissue stiffness elastography, which uses ultrasound to assess tissue differences in ultrasound imaging and provides both morphological (gray-scale images) and functional imaging (flow imaging) of soft tissue. Using ultrafast capabilities, a third dimension can be added to ultrasound: pathophysiological information through the assessment of tissue viscoelasticity. Ultrafast imaging can be used to capture phenomena that have never been imaged on commercial ultrasound devices: transient shear waves propagating in soft tissue. Shear wave imaging leads to quantification of tissue mechanical properties. Once properly generated and imaged, a transient shear wave can provide many insights on the mechanical properties of the imaged tissue.
Elastography technology is similar to DTI and tractography comprising enhanced MRI techniques that enable the three-dimensional visualization of anisotropic tissue, such as muscle fibers, and provide a quantitative description of tissue organization and integrity [36]. MR imaging utilizes (monochromatic) vibration. Stationary waves induced in the body are analyzed to deduce tissue elasticity. Dynamic elastography is well suited for MR systems as the vibration pattern is not time-dependent but must be assessed in a volume. It is a quantitative approach but suffers from the usual MR drawbacks: high cost, limited availability, and lack of real-time imaging. The elastographic pictures registered simultaneously with conventional gray-scale B-mode images during sonography or endosonography can be assumed to better help distinguish malignant from inflamed areas and thus facilitate the diagnostic work-up [38
 Endovaginal Imaging of Vaginal Implants
 Three-Dimensional Endoanal Ultrasonography of the Anorectal Region
 Endovaginal Urethra and Bladder Imaging
 3D Endovaginal Ultrasound Imaging of the Levator Ani Muscles
 Instrumentation and Techniques for Translabial and Transperineal Pelvic Floor Ultrasound
 2D/3D Endovaginal and Endoanal Instrumentation and Techniques


Related posts:
Endovaginal Imaging of Vaginal Implants
Three-Dimensional Endoanal Ultrasonography of the Anorectal Region
Endovaginal Urethra and Bladder Imaging
3D Endovaginal Ultrasound Imaging of the Levator Ani Muscles
Instrumentation and Techniques for Translabial and Transperineal Pelvic Floor Ultrasound
2D/3D Endovaginal and Endoanal Instrumentation and Techniques
Stay updated, free articles. Join our Telegram channel
Full access? Get Clinical Tree
