CHAPTER 50 Epilepsy
Seizures develop when cortical neurons undergo abnormal, excessive, hypersynchronous electrical discharges due to impaired regulation of neuronal excitation and inhibition. Epilepsy is a condition characterized by recurrent spontaneous seizures. It is a common disorder, present in 0.4% to 1% of the population.1
Generalized epilepsy is usually well controlled by medication. Epilepsy associated with partial complex seizures is often medically intractable and may require surgery to achieve seizure control. Overall, 15% to 30% of adult patients with partial seizures are not well controlled with antiepileptic medication.1 A major goal of epilepsy imaging is to identify an epileptogenic substrate or lesion that is amenable to surgery or other directed treatment. A second goal is to identify any syndromic cause of epilepsy.
The sensitivity of MRI for detecting seizure foci is dependent on the population investigated. The sensitivity is relatively low for those with new onset of seizures but high for patients with medically refractory partial epilepsy. In one series of 300 consecutive patients with new-onset seizure, an anatomic substrate was identified by MRI in 14% (38/263).2 In that study, all of the patients with an imaging abnormality had partial seizures. Patients with primary generalized seizures did not have imaging abnormalities. In another series of children with a new diagnosis of epilepsy, 13% (62/388) had a structural abnormality demonstrated by MRI.3 Conversely, in patients with medically intractable epilepsy, the sensitivity of MRI has been reported as 82% to 86%.4 In a series of 117 patients with refractory partial seizures who had surgery, the sensitivity for detecting anatomic substrates of seizure was 32% (35/109) for CT and 95% (104/109) for MRI.4
In surgical candidates, MRI is essential for identifying a structural lesion, localizing it, and demonstrating its relationship to eloquent regions of the brain. The MRI findings must be correlated with electrophysiologic and clinical data to avoid falsepositive localization of the epileptogenic substrate.5 When MRI findings and noninvasive electrophysiologic data are concordant, surgery may be undertaken without resorting to invasive electroencephalography. MRI also helps to prognosticate the potential for successful surgical control of seizures by identifying and characterizing the seizure substrate.6 Postoperative MRI helps to localize electrode placement, identify surgical complications, and elucidate causes for treatment failure, such as recurrent or residual structural lesion.
EVALUATING THE PATIENT WITH SEIZURES
Current Concepts and Definitions
A few clinical terms are commonly used in epilepsy. Seizure semiology is the study and description of seizure signs and symptoms. An aura is a subjective or sensory simple partial seizure that may precede or herald a more severe complex partial or generalized seizure. An automatism is an intraictal repetitive motor activity often occurring during cognitive impairment, such as lip smacking. After a seizure, patients may experience transitory functional neurologic abnormalities referred to as postictal phenomena. A postictal unilateral neurologic deficit is referred to as a lateralizing phenomenon. A postictal phenomenon that is nonfocal and involves impaired cognition, psychosis, or amnesia is referred to as a nonlateralizing postictal phenomenon. Postictal hemiparesis is a common lateralizing sign called Todd’s paralysis.
Study Protocols
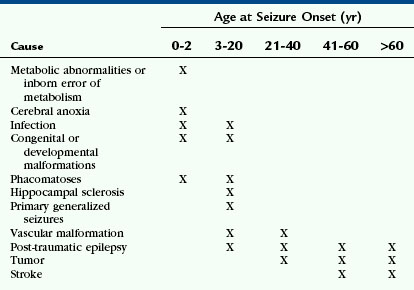
Many factors determine which imaging protocols are “appropriate” or “optimal” for evaluating seizure disorders. These include patient age, the specific features of the population being imaged, and the imaging characteristics of the epileptogenic substrates expected at that age in that population. The imaging characteristics of normal brain change with age, so the optimal imaging protocol must also change with age. This particularly applies to the incompletely myelinated infant brain. The likely causes of epilepsy also vary with age, so imaging protocols must be optimized for the lesions most likely at each age (Table 50-1).
AGE DIFFERENCES
Infants
In infants younger than 18 months of age, myelination is still incomplete. The water content of the brain is higher, so fluid-attenuated inversion recovery (FLAIR) sequences are less useful for detecting areas of abnormal T2-weighted (T2W) signal. The interface between gray and white matter is usually indistinct on spoiled gradient-recalled-echo (SPGR) sequences, especially when the patient is younger than 6 months of age, so inversion recovery and fast spin-echo (FSE)/T2W sequences may be needed to optimize gray matter/white matter differentiation in these patients (Fig. 50-1). In neonates, infection, stroke and malformations of cortical development (MCD) are primary considerations, so attention is directed toward display of the cortex. Mesial temporal sclerosis is not a diagnostic consideration in this age group, so coronal oblique imaging through the hippocampus is not employed routinely. Diffusion-weighted imaging (DWI) and administration of gadolinium (Gd) may be useful in these patients, particularly in patients with new-onset seizures.

FIGURE 50-1 Immature myelination. A, Coronal spoiled gradient (SPGR) MR image obtained from a 4-month-old infant appears to demonstrate diffuse cortical thickening. There is poor differentiation between gray and white matter. This appearance, however, is due to the immature myelination, demonstrating the limited value of SPGR sequences before 12 months of age. B, Coronal FLAIR MR image from the same patient shows diffuse hyperintensity of the incompletely myelinated white matter. The utility of this sequence is also limited before 12 to 18 months of age. C, Coronal T2W FSE MR image from the same patient shows better gray matter/white matter differentiation.
Mature Patients
In patients older than age 50 years, stroke and neoplasm are more common causes of new-onset seizure. Therefore, DWI is required to detect areas of ischemia; a contrast agent should be administered routinely to help detect neoplasms (Fig. 50-2). The frequency of hippocampal sclerosis is low in this population, so sequences tailored for evaluation of the hippocampus are not used routinely.
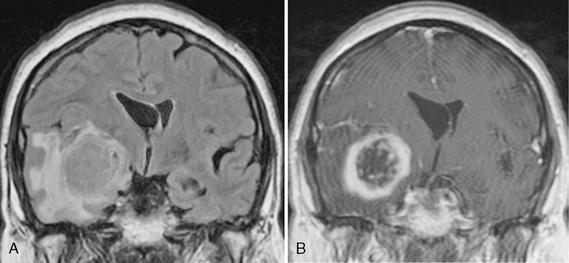
FIGURE 50-2 Right temporal lobe glioblastoma. A, Coronal FLAIR MR image of a 65-year-old patient who presented to the emergency department with new-onset seizures demonstrates a large medial right temporal lobe mass with surrounding vasogenic edema. B, Coronal T1W MR image post contrast agent administration shows thick irregular ring enhancement of the temporal lobe lesion. Pathology after resection confirmed this was a glioblastoma multiforme.
Patients 18 Months to 50 Years of Age
The patients most likely to be evaluated for medically refractory partial epilepsy are those between the ages of 18 months and 50 years. This population will have the highest yield for detection of structural pathology by MRI, including hippocampal sclerosis. These patients have completed myelination and can undergo detailed evaluation for subtle epileptogenic abnormalities. In this age group, special protocols are needed to increase the likelihood of identifying hippocampal sclerosis and cortical malformations.7 Administration of a contrast agent is not needed routinely unless there is specific concern for tumor, vascular malformation, or infection. One notable exception to this is in the patient with hemiatrophy, where use of contrast enhancement may reveal the Sturge-Weber malformation.
TECHNIQUES
Evaluation of the Hippocampus
Slice Inclination
The coronal plane oriented perpendicular to the long axis of the hippocampus is ideal for assessing signal change within the hippocampus, abnormal hippocampal architecture, and hippocampal atrophy (Fig. 50-3).
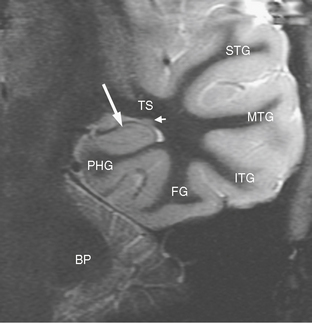
FIGURE 50-3 Normal coronal temporal lobe anatomy. Coronal inversion recovery MR image of normal temporal lobe anatomy. Large arrow, hippocampus; BP, brachium pontis (middle cerebellar peduncle); PHG, parahippocampal gyrus; TS, temporal stem; FG, fusiform gyrus; ITG, inferior temporal gyrus; MTG, middle temporal gyrus; STG, superior temporal gyrus; small arrow, tail of the caudate nucleus.
Signal Intensity
FLAIR pulse sequences are most sensitive for detecting signal abnormalities of the hippocampus. However, it is best to use a combination of coronal FSE/T2W sequences and coronal FLAIR for assessing the hippocampus, because the normal hippocampus may appear slightly hyperintense as compared with neocortical gray matter on FLAIR sequences.8
Hippocampal Morphology
T1-weighted (T1W) gradient volume acquisitions (SPGR or MP-RAGE) are excellent for evaluating the morphology of the hippocampus. The raw data from these images can be reformatted into any plane that is helpful for qualitative and volumetric analysis of the hippocampus.
Evaluation of Neocortical Structures and Malformations
Further Assessment
High field magnets (3 T or greater) and high-resolution phased-array coils help to detect cortical malformations. Photographic image reversal of inversion recovery or T2W sequences may be helpful. Multiplanar or 3D reconstructions of volume-acquired data can demonstrate sulcal morphologic abnormalities, cortical dysplasia, indistinctness of the gray matter/white matter interface, and the relationship of developmental abnormalities to eloquent areas of the brain. However, the location and extent of cortical dysplasia identified by MRI may not correlate directly with the seizure semiology or the electrophysiologic data.5
MESIAL TEMPORAL SCLEROSIS
Epidemiology
Epilepsy affects 0.5% to 1% of the population. Up to 30% of cases are medically intractable or medically refractory, that is, seizures persist despite optimal medical therapy.1 Temporal lobe epilepsy accounts for about 70% of intractable epilepsy. In patients undergoing surgery for intractable epilepsy, hippocampal sclerosis is found pathologically in 60% to 70%. MRI has also shown hippocampal sclerosis in patients with medically controlled, complex partial epilepsy and in relatives of epileptics without clinical seizures.
Clinical Presentation
Patients with hippocampal sclerosis often have a history of a childhood insult, usually complicated febrile seizure or encephalitis before the age of 5. After a quiescent period, recurrent temporal lobe seizures begin during the second decade. A subset of patients with medial temporal lobe epilepsy have paradoxical medial temporal lobe epilepsy, in which the MRI is normal. In this group, hippocampal gliosis occurs without neuronal loss. The postoperative outcome is somewhat poorer in this group than in classic hippocampal sclerosis.9
Dual pathology is the term to describe the coexistence of hippocampal sclerosis with another epileptogenic substrate. This occurs in 8% to 22% of surgical epilepsy patients.10 The most frequent coexisting epileptogenic substrate is cortical dysgenesis. Dual pathology is associated with less favorable surgical outcome, unless both the hippocampus and the other substrate are resected. In this situation, a residual sclerotic hippocampus or a residual extrahippocampal substrate will become the epileptogenic source after the initial surgery.
Pathophysiology
The complex pathophysiology leading to hippocampal sclerosis is incompletely understood. Multiple factors may cause this condition. The “two-hit” hypothesis proposes that an initial precipitating injury (e.g., complicated febrile seizures or encephalitis) must occur in the presence of a predisposing factor (e.g., genetic disposition or developmental anomaly) that increases vulnerability. The presence of dual pathologic processes within the temporal lobe supports this proposal. Hippocampal sclerosis is associated with a second abnormality on MRI in 15% to 30% of cases.10 “Kindling,” induction of a secondary seizure focus by repeated exposure from a primary seizure focus, may also contribute to the development of, or bilateral extension of, hippocampal sclerosis.
Pathology
In hippocampal sclerosis there is usually loss of more than 50% of the neurons, notably loss of pyramidal cells in regions CA1, CA2, and CA4 and loss of granule cells within the dentate gyrus (Fig. 50-4). Hippocampal reorganization and changes in energy metabolism are also seen in hippocampal sclerosis. Findings of reorganization include abnormal axonal sprouting and loss of interneurons, which is thought to change the balance of neuronal excitation and inhibition.
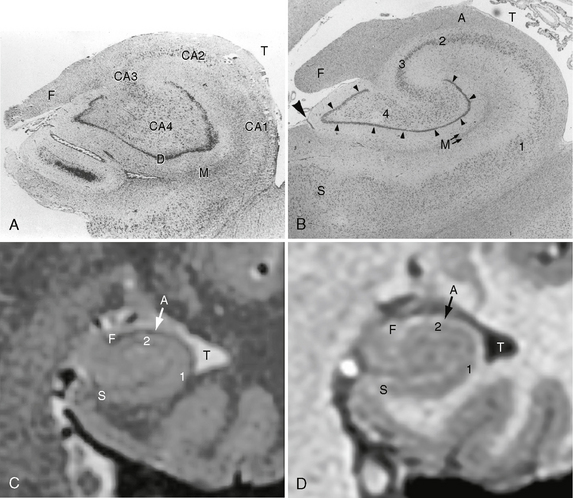
FIGURE 50-4 Hippocampal sclerosis histology. A, Coronal histologic section of an adult hippocampus with hippocampal sclerosis. There is significant loss of pyramidal cells within the CA1 and CA4 fields. T, temporal lobe; F, fimbria; D, dentate gyrus; M, molecular strata of the dentate gyrus. B, Coronal histologic section of a normal adult hippocampus. S, subiculum; 1 to 4, CA1, CA2, CA3, and CA4 fields of the cornu ammonis, respectively; small arrowheads, dentate gyrus; M, molecular strata of the dentate gyrus; F, fimbria; A, alveus; large arrowhead, minimal residual hippocampal sulcus; T, temporal horn of the lateral ventricle. C, High-resolution thin-section coronal T2W MR image of a normal adult hippocampus. The general aspects of the hippocampal internal architecture are visible. S, subiculum; 1 and 2, CA1 and CA2 fields of the cornu ammonis; A, alveus; F, fimbria; T, temporal horn of the lateral ventricle. D, High-resolution thin-section coronal SPGR MR image of the same patient. S, subiculum; 1 and 2, CA1 and CA2 fields of the cornu ammonis; A, alveus; F, fimbria; T, temporal horn of the lateral ventricle.
(A, modified from Bronen RA, Cheung G, Charles JT, et al. Imaging findings in hippocampal sclerosis: correlation with pathology. AJNR Am J Neuroradiol 12:933-940, 1991, © by American Society of Neuroradiology; B from Kier EL, Kim JH, Fulbright RK, et al. Embryology of the human fetal hippocampus: MR imaging, anatomy, and histology. AJNR Am J Neuroradiol 18:530, 1997, © by American Society of Neuroradiology.)
Imaging
MRI
MRI is the principal imaging modality used for evaluation of hippocampal sclerosis.
Visual Analysis
More than 75% of patients with surgically proven hippocampal sclerosis show prolonged T2 relaxation time (hyperintense signal on T2W images), hippocampal atrophy, and loss of the internal architecture of the hippocampus (Fig. 50-5). Other MRI findings associated with hippocampal sclerosis include loss of the digitations along the hippocampal head, dilatation of the adjacent temporal horn, atrophy of the white matter in the adjacent parahippocampal gyrus, increased T2 signal in the anterior temporal white matter, and secondary atrophy of the fornix and mammillary bodies due to degeneration of hippocampal tracts (Fig. 50-6). Overall, qualitative (i.e., visual) assessment of MRI detects hippocampal sclerosis with a sensitivity in the range of 75% to 90%.

FIGURE 50-5 Normal versus abnormal hippocampus. A, Coronal SPGR MR image from a patient with long-standing seizures shows a normal-sized right hippocampus (white arrow) in comparison with the smaller, atrophic left hippocampus (black arrow). B, Coronal T2W MR image of the same patient again shows the atrophy of the left hippocampus (black arrow), but without a significant signal difference from that of the right hippocampus (white arrow). C, Coronal FLAIR MR image demonstrates normal signal within the right hippocampus (white arrow) and also definitely depicts slight T2 prolongation within the atrophic left hippocampus (black arrow), suggesting mesial temporal sclerosis.
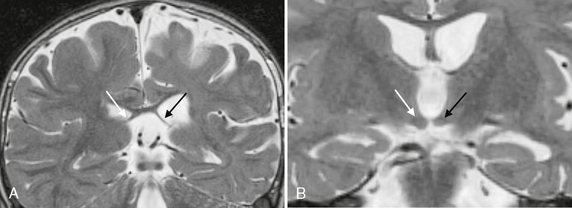
FIGURE 50-6 Associated findings with hippocampal sclerosis. A, Coronal T2W MR image in a patient with left hippocampal sclerosis shows asymmetric thinning and atrophy of the left fornix (black arrow) compared with the normal right fornix (white arrow). B, A more anterior coronal T2W MR image of the same patient also shows atrophy of the left mammillary body (black arrow) as compared with the normal right mammillary body (white arrow).
Quantitative Methods
Quantitative MR methods, such as hippocampal volumetry and T2 relaxometry, increase the sensitivity for detecting hippocampal sclerosis to 90% to 95%. These quantitative methods are especially useful when hippocampal sclerosis occurs bilaterally without obvious T2 signal changes (Fig. 50-7). Proton MR spectroscopy may also be used quantitatively.
Hippocampal Volumetry
The criteria set forth by Watson and coworkers11 are best for defining the anatomic boundaries needed to measure the volumes of the hippocampus and amygdala. Each center needs to establish its own normative data for hippocampal volume because the precise paradigm used in the quantitative imaging program varies from center to center. One needs to normalize for such variables as head size, patient age, patient gender, and the hemisphere imaged (right or left).
T2 Relaxometry
Quantitative measurements of T2 signal (T2 relaxometry) are obtained on a single-slice multi-echo sequence through the hippocampal body. The T2 signal is measurably elevated in approximately 70% of cases with hippocampal sclerosis.12 Measurements of T2 relaxometry are particularly useful in detecting abnormalities of the amygdala (amygdala sclerosis), which may be difficult to identify on routine anatomic imaging.13 Concurrent involvement of the amygdala in mesial temporal sclerosis reduces the likelihood that resective surgery will achieve a seizure-free outcome from 80% to 50%.14
MR Spectroscopy
Proton magnetic resonance spectroscopy (MRS) can be useful in evaluating the hippocampus and lateralizing a seizure focus. MRS of the hippocampus is typically performed using single voxel spectroscopy, which often includes some of the adjacent mesial temporal structures. The contralateral hippocampus is interrogated for comparison. The most important spectroscopic finding in mesial temporal sclerosis is decreased N-acetyl-aspartate (NAA). Reduced ratios of NAA to creatine or NAA to (choline + creatine) reflect metabolic dysfunction and/or neuronal loss. NAA may be a dynamic marker of neuronal dysfunction, rather than a simple sign of decreased numbers of neurons. Abnormally low NAA concentrations have been reported to recover in the unoperated temporal lobe after successful contralateral temporal lobectomy.15 In patients with bilateral temporal lobe MRI abnormalities, reduced NAA ratios successfully lateralize the site of epileptogenesis in 65% to 96% of cases.16 In temporal epilepsy patients without MRI abnormalities, reduced NAA ratios have correctly lateralized the seizure focus in at least 20% of cases. Bilaterally reduced NAA to creatine ratios have been associated with failed resective surgery.
Quantitative methods have great value for research, allowing the investigator to test hypotheses correlating MRI data with clinical and pathologic data. Hippocampal volume has been correlated with cell loss, frequency of childhood febrile seizures, memory functions, duration of epilepsy, and successful surgical outcome.17,18 One study correlated recurrent temporal lobe seizures with hippocampal volume loss, whereas generalized seizures were linked to progressive neuronal damage.15 This study supports early intervention for seizure control to prevent progressive brain damage. Although quantitative MRI has many advantages for research, routine clinical use of quantitative measures faces some obstacles: operator time, the need for dedicated personnel, workstation, and software, and the requirement of a truly representative data sample of normal controls.
Diffusion MRI Techniques
DWI with its corresponding apparent diffusion coefficient (ADC) maps, diffusion tensor images (DTI), and fiber tract trajectography (FTT) also contribute to assessing mesial temporal sclerosis.
Diffusion-Weighted Imaging
Sclerotic hippocampi may show abnormally elevated ADCs,19 even when conventional MRI is normal, likely reflecting early change. The ADCs of the abnormal hippocampi are higher than the ADCs of the corresponding contralateral hippocampi and higher than the ADCs from hippocampi of healthy volunteers. Interestingly, in patients with one sclerotic hippocampus, the ADCs of the contralateral normal-appearing hippocampi are higher than the ADCs of healthy volunteers. The ADC abnormalities in the contralateral normal-appearing hippocampi may resolve after resection of the ipsilateral abnormal hippocampus, suggesting that the biochemical change may be related to ongoing epileptic activity. In one study, ADC maps correctly lateralized the abnormality in 100% of patients. When the conventional MRI is nonlateralizing, however, the ADC values are also less helpful in lateralization.
Diffusion Tensor Imaging
DTI has shown reduced fractional anisotropy and increased mean diffusivity in the hippocampi on the side of seizure lateralization (Fig. 50-8) versus the contralateral normal-appearing hippocampus in control subjects.20 Compared with normal controls, patients with hippocampal sclerosis and negative conventional MRI have higher mean diffusivity and low fractional anisotropy in the hippocampi bilaterally. Decreased fractional anisotropy values have also been demonstrated in the uncinate fasciculus on the side of seizure lateralization, suggesting that this tract has a role in the spread of temporal lobe seizures.
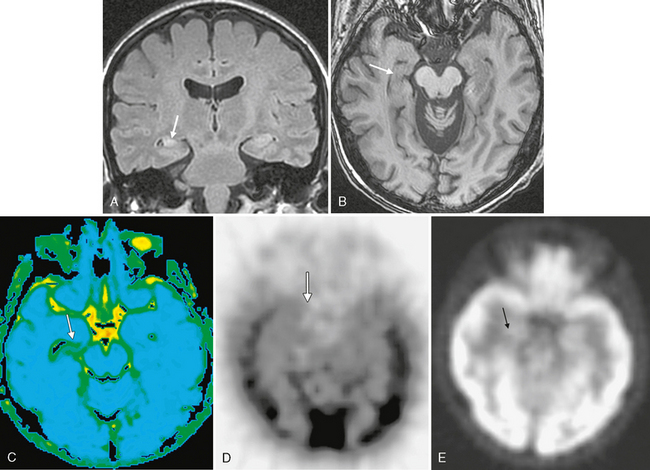
FIGURE 50-8 Right mesial temporal sclerosis. A, Coronal FLAIR MR image in a patient with chronic seizures shows classic findings of mesial temporal sclerosis with an atrophic, hyperintense right hippocampus (arrow) compared with the left hippocampus with normal size and signal. B, Axial SPGR MR image of the same patient also demonstrates the atrophy of the right hippocampus (arrow) when compared with the normal left hippocampus. C, Diffusion tensor imaging (average diffusivity map) demonstrates increased average diffusivity within the abnormal right hippocampus (arrow). D, Axial interictal 99mTc HMPAO SPECT image demonstrates hypoperfusion of the right hippocampus/medial temporal lobe (arrow). E, Axial PET image shows subtly decreased glucose metabolism within the right medial temporal lobe (arrow).
Functional MRI
In the planning of lesional resective surgery, many epilepsy centers use functional MRI (fMRI) to localize eloquent regions of the brain that should be preserved. Less frequently, functional mapping can be used to localize the activated cortex during an ictal seizure. fMRI uses blood oxygen level–dependent (BOLD) changes in T2* signal to demonstrate areas of increased neuronal activity and resultant increased perfusion. EEG and fMRI can be used in combination to obtain whole-brain maps of interictal epileptic spikes and their co-registered associated BOLD changes.
PET and SPECT
18F-fluorodeoxyglucose (FDG) positron emission tomography (PET) is used to map cerebral glucose metabolism. This study is usually performed in an interictal period. Routine FDG-PET has a sensitivity of more than 70% for lateralization of mesial temporal epilepsy. The epileptogenic temporal lobe demonstrates interictal hypometabolism, that is, decreased uptake of the glucose analogue. Hypometabolism may also occur in the contralateral temporal lobe and in ipsilateral extratemporal locations such as the frontoparietal cortex, basal ganglia, and thalamus. These additional areas, however, all demonstrate a lesser degree of hypometabolism compared with the epileptogenic temporal lobe. Bilateral asymmetric temporal lobe hypometabolism is commonly seen in mesial temporal epilepsy. One should keep in mind that antiepileptic medications, particularly barbiturates, can result in a global decrease in glucose metabolism.
PET with 11C-flumazenil (FMZ) is a newer technique that has shown much promise. GABA is the most important inhibitory neurotransmitter. Flumazenil specifically binds to GABA receptors, which are decreased in mesial temporal sclerosis. Early studies have shown 11C-FMZ abnormalities to be better localized than 18F-FDG abnormalities,21 so this technique may prove particularly useful in cases in which MRI is negative.
