Fig. 1
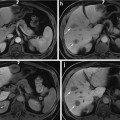
US images (a, c) showing both hyperechoic livers in comparison to the parenchyma of the right kidney. Corresponding CT images of the same patients demonstrate respectively hypodense liver parenchyma due to marked fatty infiltration (b) and hyperattenuating liver parenchyma in a patient with liver fibrosis (d)
As a result, some work groups have preferred the designation “fatty fibrotic pattern” to describe this pattern of increased echogeneity, despite the fact that the echo shadows tend to be coarser in the presence of pure fibrosis [31].
As predicted, sensitivity of US raises with increasing degrees of fatty infiltration [28]. For example, in the presence of hepatic fat content of 10–19 %, it has a sensitivity of 55 %, which increases to 80 % in the presence of >30 % fatty infiltration. However, in the presence of morbid obesity (as defined by a body mass index superior to 40 kg/m2), the sensitivity and specificity of US fall to 49 % and 75 %, respectively, possibly due to technical problems in performing US in such patients [32].
Most US studies refer to a three-point scoring system for grading hepatic steatosis (mild, moderate, and severe), based on subjective evaluation of hyperechogenic liver tissue, the increased discrepancy of echogeneity between liver and kidney, and the loss of echoes from the walls of the portal system [33]. A recent study performed in a pediatric population scored steatosis identified by US using a 0–3 scale as follows: absent steatosis (score 0)—normal liver echotexture; mild steatosis (score 1)—slight and diffuse increase in fine parenchymal echoes with normal visualization of diaphragm and portal vein borders; moderate steatosis (score 2)—moderate and diffuse increase in fine echoes with slightly impaired visualization of portal vein borders and diaphragm; and severe steatosis (score 3)—fine echoes with poor or no visualization of portal vein borders, diaphragm, and posterior portion of the right liver lobe. It was demonstrated that this ultrasonographic steatosis score (USS) had an excellent correlation with the histological grade of steatosis and a USS score of 2 had a sensitivity of almost 80 % for moderate to severe steatosis [34].
However, this visual quantification can be very subjective; in a retrospective US study of liver fat, the intra-observer agreement for severity of steatosis ranged from 55 to 68 % [35]. Therefore, it should be stressed that US visual examination is accurate for detecting moderate to severe hepatic steatosis, but the diagnosis of mild steatosis can be difficult.
In addition, recent studies demonstrated that US is very poor at discriminating small changes in hepatic fat content. For example, Fishbein and colleagues suggested from their study that an individual with hepatic steatosis undergoing a reduction of MRI hepatic fat fraction from 40 to 20 % through successful intervention would be unlikely to have a corresponding change in US appearance [19].
As mentioned above, the hyperechogenicity of the liver visually compared with that of the kidney parenchyma is well recognized as one of the most important signs of steatosis (Fig. 1a). Some studies suggested a computed hepatorenal index for quantification of liver fat, as a means of overcoming variability related to subjective evaluation [36–38]. In fact, a significant correlation was found between the hepatorenal sonographic index and magnetic resonance spectroscopy or histological steatosis in several studies, including one that showed very high concordance (sensitivity and specificity higher than 90 %) between the hepatorenal sonographic index and the degree of steatosis in biopsy [38]. Moreover, the hepatorenal sonographic index showed higher sensitivity than traditional US qualitative methods in detecting mild hepatic steatosis [38]. Furthermore, this index is reproducible and operator-independent, as shown by an interobserver agreement rate of 95.6 % for the diagnosis of hepatic steatosis [37]. There are however some drawbacks. The most important occurs in patients with inhomogeneous distribution of the liver fat, in whom sampling errors may be found (the measurements of echo intensity in only one region of interest (ROI) could not be representative of the entire liver). Another possible limitation to the use of this ratio is related to the presence of renal diseases, including structural disease or ectopic or absent right kidneys [38].
Another method available for quantitative grading of liver fat infiltration encompasses the estimation of the decrease in amplitude of the backscattered echo—the far-field slope (FFS) value. Normal liver has an FFS of 33 ± 6, and values of 38 ± 10, 44 ± 8, and 49 ± 4 are reported to be indicative of mild to severe hepatic steatosis, respectively. However, qualitative rating of steatosis at US was more accurate than quantitative estimation (sensitivity, specificity, and accuracy of 60 %–100 %, 77 %–95 %, and 96 %, in comparison with 77 %, 77 %, and 71 %, respectively) [39].
Ultimately, the US assessment of hepatic fat content is based on a subjective visual assessment rather than an objective quantification of sonographic images in the setting of the daily clinical practice. The lack of reliable quantitative methods, weak reproducibility, failure in differentiating fatty infiltration from fibrosis, and its relative inability to detect small changes in liver fat with time are impeditive of a widespread use of US in the quantification of hepatic steatosis. Further analysis on the validity of computer-aided US (hepatorenal index) should be performed in order to confirm the accuracy, reproducibility, and standardization value of this method, as it seems to be a promising effective noninvasive imaging modality that can be applied for quantifying fatty infiltration of the liver and that could be used for follow-up.
Computed Tomography
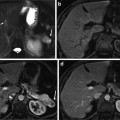
Computed tomography (CT) can be useful in the assessment of hepatic steatosis. Fatty infiltration typically results in decreased attenuation of the liver parenchyma (hypodense liver) in non-enhanced CT images (Fig. 2).
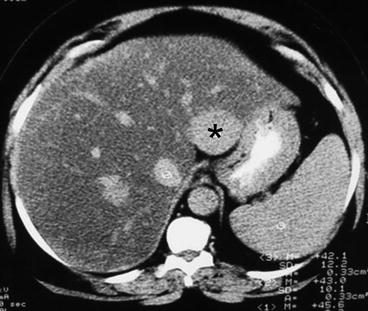

Fig 2
Non-enhanced CT scan. There is hypoattenuation of liver parenchyma relative to the hepatic vessels and the spleen, corresponding to marked fatty infiltration. Asterisk is placed over a focal area of fatty sparing in the left liver lobe
The visual assessment of liver fat usually requires an internal control in order to compare its attenuation with that of the liver (usually the spleen but also the kidney and the skeletal muscle).
In non-enhanced CT, the hepatic fat content can be assessed either subjectively by visual inspection or objectively by placing an ROI and measuring the attenuation values within it [40].
Several scales for visual assessment of the amount of steatosis on non-enhanced CT images have been suggested. A recent study used a five-point scale as follows: grade 1, hepatic vessels show lower attenuation than the hepatic parenchyma out to the peripheral third of the liver; grade 2, hepatic vessels show lower attenuation than hepatic parenchyma out to the middle third of the liver; grade 3, hepatic vessels show lower attenuation than hepatic parenchyma in the central third of the liver; grade 4, hepatic vessels show the same attenuation as that of hepatic parenchyma; and grade 5, hepatic vessels show higher attenuation than the hepatic parenchyma [41] (Fig. 2).
When placing a ROI to determine the attenuation of the liver parenchyma, three kinds of measurements have been investigated, which include (1) the absolute measurement of liver attenuation in Hounsfield units (HU), (2) the calculation of the spleen-to-liver attenuation ratio, and (3) the difference in attenuation values between liver and spleen. The comparison with the spleen permits to minimize errors in attenuation measurements caused by variations in CT parameters due to individual factors (such as body habit and metallic instruments) [30].
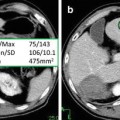
The placement of one or two ROIs as large as possible (at least 1 cm2), avoiding inclusion of any large vessels or biliary structures in the right hepatic lobe, is commonly the preferred method in the measurement of hepatic attenuation (Fig. 3).
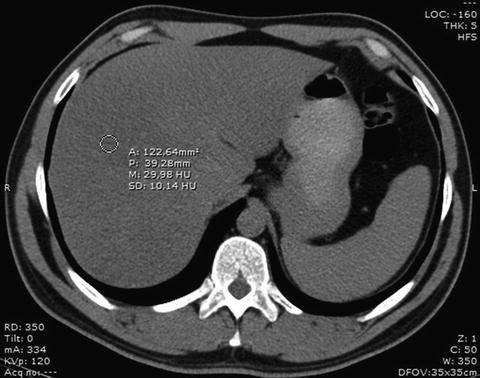

Fig. 3
ROI placing over the right liver lobe for measurement of the attenuation of the liver parenchyma. In this patient, the density value of about 30 HU reflects a marked fatty infiltration of the liver
Kodama and co-workers found that a hepatic attenuation of 40 HU represents a degree of fatty infiltration of approximately 30 % (moderate to severe steatosis). Their study showed that liver CT numbers of 64.4 HU ± 3.1, 59.1 HU ± 7.3, 41.9 HU ± 6.7, and 25.0 HU ± 15.5 at non-enhanced imaging correlated with degrees of fatty change of 0 %, 1–25 %, 26–50 %, and more than 50 %, respectively. This retrospective study suggested that the absolute liver attenuation value on non-enhanced CT was the best predictor of pathologic fat content and that comparison methods with splenic attenuation were deemed unnecessary, as they did not contribute to accurately predict fat content and were more complex and time-consuming [42]. In clinical practice, however, the absolute value of hepatic attenuation is unreliable because most CT scanners are not appropriately calibrated for this purpose and because an overlap exists between normal and abnormal liver attenuation values. Therefore, most investigators favor a comparison between the hepatic attenuation value and an internal standard devoid of fat, such as the spleen [43].
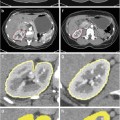
This hepatic attenuation index can be achieved by calculating the ratio of hepatic attenuation to splenic attenuation (Fig. 4).
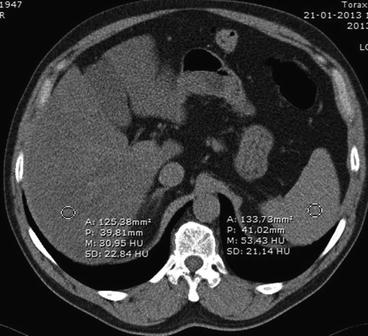

Fig. 4
Measurement of the hepatic attenuation index. Placing a ROI over the liver and other over the spleen allows determination of their attenuation values and calculation of the index. In this case, attenuation coefficients were approximately 31 and 53 HU for liver and spleen, respectively. As a result, the hepatic attenuation index was 0,58, corresponding to marked steatosis
Several studies showed that the ratio of liver to spleen attenuation values provides a useful index of liver fat. Park and collaborators reported that a hepatic to splenic attenuation ratio of less than 0.8 had 100 % specificity for the diagnosis of moderate to severe (>30 %) macrovesicular steatosis [44]. Even in markedly obese patients (BMI of 44.4 ± 1.1), the liver to spleen index correlated strongly with histological macrosteatosis [45].
Another method of obtaining the quantification of liver fat involves the measurement of the difference between the hepatic and splenic attenuation (Fig. 5).
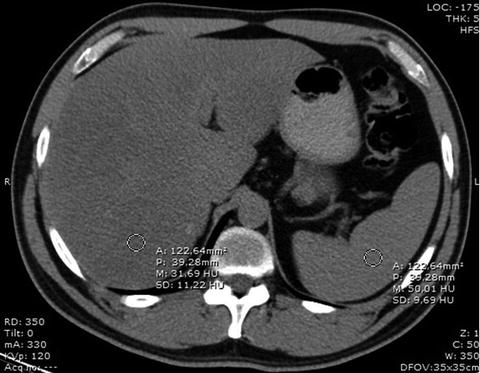

Fig. 5
Measurement of the difference in attenuation values between liver and spleen by placing ROIs over the liver and the spleen for determination of their attenuation values. In this patient, attenuation coefficients were approximately 32 and 50 HU for liver and spleen, respectively. The difference in attenuation was −18, reflecting marked fatty liver infiltration
Attenuation value of normal healthy liver parenchyma is about 50–57 HU, which is 8–10 HU higher than that of the spleen [46]. Two studies found a specificity of 100 % for the detection of steatosis of more than 30 % when the hepatic–splenic attenuation difference was less than −9 HU [44] and less than −10 HU [24]. Limanond and co-workers showed that a hepatic–splenic attenuation difference of more than 5 HU was an accurate predictor of the absence of significant macrovesicular steatosis (0–5 %) and a difference of −10 to 5 HU was suggestive of mild to moderate steatosis (6–30 %) [24]. However, the sensitivity of these measurements for the diagnosis of macrovesicular steatosis of more than 30 % was comprehended between 73 and 82 % [24, 41, 44].
Contrast-enhanced CT plays a limited role in the diagnosis of steatosis because in this case the attenuation values of liver parenchyma depend on several factors related to the contrast and the patient, such as total volume and rate of injection, iodine concentration, body weight, cardiac output, location of intravenous access, and timing of the measurement [40, 47]. These factors lead to significant overlap between the densities of normal and fatty livers as Jacobs and colleagues found in their study [48].
However, in order to reduce the radiation burden to the patient, frequently only contrast-enhanced images are acquired. In this setting, the attenuation measurements should ideally be done 80–100 s after the beginning of contrast injection to minimize those factors [48]. Using this delay, a difference of at least 20 UH between the liver and spleen was reported to have high sensitivity and specificity (86 % and 87 %, respectively) in the diagnosis of fatty liver infiltration, when using 150 mL of iothalamate meglumine injected at a rate of 2 mL/s [48].
Panicek and co-workers suggested that when only contrast-enhanced images are available, comparing attenuation of liver to skeletal muscle is preferable as it is considered to be more specific, particularly with severe degrees of fatty infiltration. However, this hypothesis is true only if the grade of fatty infiltration is high [49].
The first studies evaluating dual-source/dual-energy CT suggest that this technique may be used to measure the extent and grade of fatty liver infiltration [50, 51], by measuring changes in hepatic attenuation between images acquired at the lower and higher energy levels (typically, 140 and 80 kVp). The attenuation of fatty liver changes more markedly with the change in tube potential than does that of normal liver [40]. Raptopoulos et al. showed that an attenuation change by more than 10 HU with a tube potential change from 140 and 80 kVp was indicative of fatty infiltration of more than 25 % [52]. The value of dual-energy CT in the quantification of steatosis, however, has to be evaluated in further studies, because attenuation difference varies significantly in the presence of iron overload.
The most important drawback of CT in the quantification of steatosis is that tissue attenuation does not depend solely on fat content. It might be influenced by an assortment of other factors, some immeasurable by CT, such as iron, copper, glycogen, fibrosis, or edema [43]. As such, underlying diffuse liver diseases may alter attenuation values of liver parenchyma so that hepatic steatosis may be misdiagnosed or concealed. For example, increased iron deposition in liver parenchyma in case of hemochromatosis may lead to a significant increase in attenuation values of the liver. Subsequently, the increase of attenuation due to iron deposition and the decrease due to fatty infiltration might add up to almost normal attenuation values, so that hepatic steatosis can be masked [52, 53].
Furthermore, it has recently been demonstrated in vitro that CT attenuation values vary significantly between different manufacturers’ multi-detector row CT (MDCT) scanners, among different generations of MDCT scanners, and even with individual combinations of scanner and convolution kernel [54]. Moreover, CT is associated with radiation exposure which limits its use in longitudinal studies and in specific age groups (children).
Although non-contrast-enhanced CT is a viable option for the qualitative diagnosis of macrovesicular steatosis of 30 % or greater, it is not clinically acceptable for the diagnosis and quantification of mild to moderate hepatic steatosis, especially in living donor liver transplant candidates, in whom preoperative evaluation of fatty infiltration is critical for donor selection.
Magnetic Resonance Imaging
At present, MRI is considered to be the most sensitive and objective imaging tool for the demonstration and quantification of hepatic steatosis. Three MR techniques for the detection and quantification of steatosis are available for clinical use: chemical shift imaging, frequency-selective imaging, and MR spectroscopy [55]. These techniques help to detect fat signals on the basis of the difference in precessional frequency between water and fat.
Although fat detection may be enough to suggest the diagnosis of fatty liver, fat quantification is required to determine the severity of steatosis, actively monitor patients over time, and assess response to therapeutic intervention.
Unlike fat detection, which can be accomplished by recognizing certain qualitative imaging features, fat quantification requires quantitative analysis of the MR signal. Regardless of the MR imaging technique used, the key step is to break down the net MR signal into fat signal and water signal. Once fat and water signals have been identified and their intensities measured, the fat signal fraction (FSF) can be calculated as the ratio of the fat signal to the total MR signal:
 where S fat = fat signal and S water = water signal

However, all MR signals are subject to longitudinal (T1) and transverse (T2 or T2*) relaxation effects and are influenced by the imaging parameters that control T1 and T2 (or T2*) weighting. Therefore, the accuracy of quantification varies depending on the pulse sequence and imaging parameters used.
Chemical Shift
Chemical shift imaging is by far the most widely used method for the detection of steatosis in clinical practice, since in-phase and out-of-phase images are routinely acquired as part of the abdominal MR imaging protocol.
Chemical shift is related to the difference in resonance frequency between two proton MR signals, expressed in parts per million (ppm) of the resonance frequency of the static magnetic field B0. The difference of resonance frequency between protons bound to methylene groups of triglycerides (CH2 in fatty acid chains) and water (H2O) protons amounts to approximately 3.5 ppm. This means that when a standard nonselective radiofrequency pulse is applied to a fat–water admixture, both proton species are excited, but the water signal precesses faster than the fat signal by about 3.5 ppm (224 Hz at 1.5 T and 447 Hz at 3.0 T) [28, 30, 55].
Because of the phase interference between the fat and water signals, the gradient echoes obtained at the in-phase and out-of-phase echo times can be summarized with the equations
 where SIP and SOP are the net signal within a given pixel in the in-phase and out-of-phase echoes, respectively, and S fat and S water are the contributions from fat signal and water signal, respectively.

The strength of fat signal relative to water signal (FSF) can be quantified by measuring the signal on the in-phase and out-of-phase images and then applying the equation


If out-of-phase and in-phase images are acquired with the dual-echo sequence, pixel-by-pixel computation of the FSF values over the entire image is possible by means of a simple and rapid post-processing technique to generate an “FSF map.” Such an image depicts, at each pixel location, the proportion of the total signal arising from fat (Fig. 6).
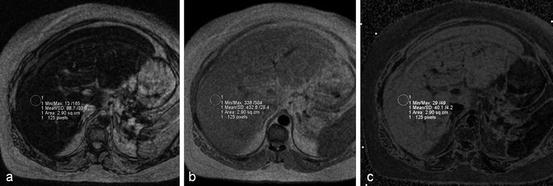

Fig. 6
Calculation of FSF. Out-of-phase (a) and in-phase (b) MR images obtained at 1.5 T show a fatty liver. Cancellation of fat and water signals causes diffuse signal intensity loss on the out-of-phase image. (c) FSF map. Fat–water admixture (fatty liver) appears bright, whereas subcutaneous fat (almost exclusively fat) appears similar to lean tissue (e.g., spleen) due to fat–water dominance ambiguity. FSF can be estimated by measuring the liver signal on the FSF map (40 % in this case). If no FSF map is available, FSF can be calculated with the equation (SIP–SOP)/2 SIP; in this case, (433–89)/(2 × 433) = 40 %
While conventional spin-echo sequences possess acquisition times of several minutes for the whole liver, the development of fast gradient-echo techniques and parallel imaging [56, 57] has reduced acquisition time sufficiently enough to permit breath-hold sequences and, since the in-phase and out-of-phase images are acquired simultaneously, misregistration errors to be minimized [58]. In clinical practice, a breath-hold T1-weighted gradient-echo in-/out-of-phase sequence is used [59, 60]. The dual-echo technique is an implementation of the out-of-phase/in-phase gradient-echo sequence, in which both the out-of-phase and in-phase echoes are acquired after a single radiofrequency excitation [55].
With 1.5-T magnets, the fat and water protons are in phase or out of phase when the TE is an even or odd multiple, respectively, of 2.32 ms [16].
With an echo time at which the fat and water signals are in phase, their signals add constructively; when they are out of phase, their signals cancel [58]. Fat detection is possible by comparing the signal intensity on the in-phase and out-of-phase images. In the presence of steatosis, there is a signal loss on out-of-phase images due to phase cancellation of fat and water (Figs. 7 and 8).
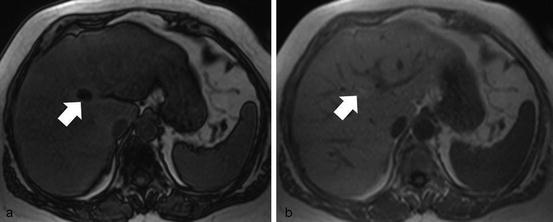
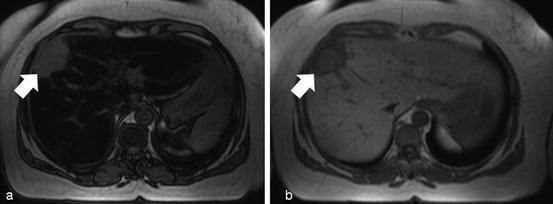

Fig. 7
Chemical shift imaging. Out-of-phase (a) and in-phase (b) MR images obtained at 1.5 T show diffuse signal intensity loss on the out-of-phase image in a fatty liver. There is a focal area of greater signal loss on out-of-phase image (white arrow), corresponding to a more marked focal fatty infiltration

Fig. 8
Chemical shift imaging. Out-of-phase (a) and in-phase (b) MR images show marked diffuse signal intensity loss on the out-of-phase image in a fatty liver. There is a liver metastasis from a gastric cancer (white arrow) that does not show signal intensity changes in the out-of-phase image due to the absence of fatty components within it
This has been shown to be an accurate predictor of hepatic fat content, with very good correlation with the histological assessment of liver fat [16, 28, 61–63].
Chemical shift imaging provides a simple and rapid method for fat quantification over the entire imaging field. The method is robust because it is relatively unaffected by magnetic field inhomogeneity and works well at a variety of B0 field strengths.
Despite its conceptual simplicity and ease of implementation, however, the chemical shift method has important limitations. With standard clinical post-processing, images are reconstructed from the signal intensity (magnitude of the magnetization vector) and not the signal phase (direction of the magnetization vector). In the out-of-phase echo, the water and fat magnetizations are opposed; consequently, the direction of the net magnetization vector is aligned with whichever signal is dominant. However, because only the signal intensity image is reconstructed, the out-of-phase intensity represents water minus fat or fat minus water, whichever value is positive. The consequence of this so-called fat–water signal dominance ambiguity is that the FSF calculated from a single pair of out-of-phase and in-phase echoes cannot distinguish water-dominant fatty tissue (“wet” fat) from fat-dominant fatty tissue (“dry” fat). For example, a tissue with 20 % fat by signal composition would appear to have the same FSF as a tissue with 80 % fat. This phenomenon is apparent on the FSF map, on which subcutaneous adipose tissue (dry fat) appears darker than the fatty liver parenchyma (wet fat) (Fig. 6). Nevertheless, this may be more of a theoretic concern rather than a practical one, since a liver fat fraction above 50 % is relatively rare.
A dual-flip-angle technique using low- and high-flip-angle gradient-echo sequences to determine the dominant component has been suggested by some authors to answer this problem [58]. Because greater T1 weighting amplifies the fat signal, a high flip angle increases the out-of-phase signal cancellation if water is the dominant component but diminishes the out-of-phase signal cancellation if fat is dominant. If the signal loss is more pronounced with a high flip angle, water is dominant; if it is more marked with a low flip angle, fat is dominant.
To overcome ambiguity, a phase-sensitive processing has also been proposed. This method (three-point Dixon method) requires the acquisition of an additional image with a phase shift of −180º or 360º and elaborated phase-correction algorithms to obtain true fat-only and true water-only images [64–71]. Unfortunately, the necessity of recording several images for the Dixon method from the liver is critical, due to the restricted duration of a breath-hold of the patient. On the other hand, several measurements in different breath-hold periods suffer from potentially variable positions of the liver in the fixed coordinate system of the scanner.
Reeder and co-workers have developed the so-called IDEAL technique [72], combining iterative decomposition of water and fat with echo asymmetry and least-squares estimation. This technique describes a multipoint fat–water separation using optimized echo shifts in order to achieve maximal signal-to-noise performance. Combined with gradient-echo imaging, it provides robust fat–water separation even in the presence of inhomogeneities of the static magnetic field [73].
Comparing chemical shift images obtained before and after gadolinium administration could also help resolve fat–water dominance ambiguity. Because gadolinium amplifies the water signal relative to the fat signal, its administration diminishes the out-of-phase signal cancellation if water is dominant but increases the out-of-phase signal cancellation if fat is dominant. Thus, if the FSF is greater after than before gadolinium administration, fat is the dominant signal component; if the reverse is true, water is the dominant signal component.
Out-of-phase/in-phase chemical shift imaging relies on the premise that the fat and water signals characteristically interfere with each other at a known frequency. However, the human fat spectrum has multiple peaks, each representing a distinct proton species. Although the dominant CH2 peak has the greatest role in canceling the water signal in the out-of-phase echo times, other less dominant peaks may also contribute to the fat signal. Because fat quantification with a pair of in-phase and out-of-phase echoes is based only on the interaction between water and the CH2 component of the total fat signal, it does not account for complex phase interference patterns from other chemical moieties and may, therefore, be somewhat inaccurate.
Another general limitation of the in-phase/out-of-phase techniques is that in the resultant fat-only and water-only images, T1 and T2* relaxation effects cannot be completely ruled out so that hepatic fat content may be misdiagnosed [47, 49, 74]. The relaxation times can be measured separately and considered in the fat calculation, but additional measurement of relaxation times leads to increased examination times [58, 75].
Stay updated, free articles. Join our Telegram channel

Full access? Get Clinical Tree


